Precision Food Thermometers Market Analysis North America, Europe, Asia, Rest of World (ROW) - US, Canada, Germany, France, China - Size and Forecast 2024-2028

Precision Food Thermometers Market Analysis North America, Europe, Asia, Rest of World (ROW) - US, Canada, Germany, France, China - Size and Forecast 2024-2028

Published: Nov 2023 150 Pages SKU: IRTNTR76793

Market Overview at a Glance

$132.71 Mn
Market Opportunity
8.69%
CAGR
8.05
YoY growth 2023-2024(%)

Precision Food Thermometers Market Size 2024-2028

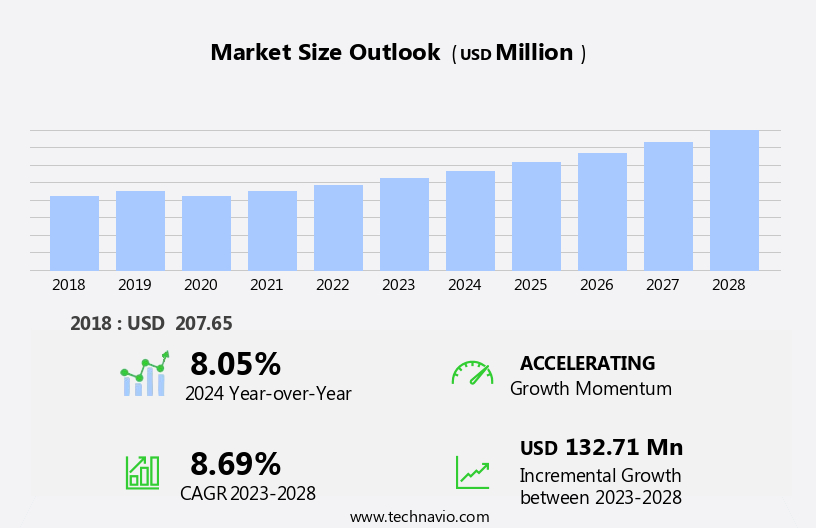
The precision food thermometers market size is forecast to increase by USD 132.71 million, at a CAGR of 8.69% between 2023 and 2028.

  • The market is driven by the growing demand for food safety and quality, as consumers increasingly prioritize health and wellness. The importance of cooking at the right temperature to ensure food safety and maintain desirable textures and flavors is a significant factor fueling market growth. However, low awareness about food thermometers poses a challenge for market expansion. Despite this obstacle, opportunities exist for companies to capitalize on the increasing consumer focus on food safety and the potential for innovation in thermometer technology to enhance cooking experiences.
  • By addressing consumer education and developing user-friendly, technologically advanced precision food thermometers, market participants can effectively navigate this competitive landscape and meet the evolving needs of health-conscious consumers.

What will be the Size of the Precision Food Thermometers Market during the forecast period?

Precision Food Thermometers Market Size

Explore in-depth regional segment analysis with market size data - historical 2018-2022 and forecasts 2024-2028 - in the full report.  
Request Free Sample

The market continues to evolve, driven by the need for accurate temperature measurement in various sectors. Food storage temperature is a critical factor in maintaining product quality and ensuring food safety. Candy making requires precise temperature control for optimal results. Temperature probe accuracy is essential for hygiene protocols compliance and foodborne illness prevention. High-accuracy temperature measurement is crucial in food processing sanitation and industrial food processing. Thermocouple response time is a significant consideration for temperature data acquisition in commercial food service and restaurant kitchen equipment. Digital thermometer resolution offers enhanced precision for culinary applications. Instant-read thermometers provide features for product quality assurance, while data logging thermometers enable remote temperature display and industrial food processing efficiency.

Baking temperature precision is vital for consistent results in commercial kitchens, and high-accuracy temperature measurement is crucial for meeting kitchen safety standards and food safety regulations. Oven temperature control and pasteurization temperature range are essential for food processing, ensuring the destruction of harmful bacteria and maintaining product quality. Continuous innovation in temperature measurement technology drives the market, with applications extending beyond food processing to include sterilization temperature monitoring and hygiene protocols compliance. The market's dynamism reflects the ongoing importance of temperature control in food production and food safety.

How is this Precision Food Thermometers Industry segmented?

The precision food thermometers industry research report provides comprehensive data (region-wise segment analysis), with forecasts and estimates in "USD million" for the period 2024-2028, as well as historical data from 2018-2022 for the following segments.

  • Distribution Channel
    • Offline
    • Online
  • Application
    • Industrial
    • Household
  • Geography
    • North America
      • US
      • Canada
    • Europe
      • France
      • Germany
    • APAC
      • China
    • Rest of World (ROW)

By Distribution Channel Insights

The offline segment is estimated to witness significant growth during the forecast period.

In the realm of food preparation and safety, precision food thermometers have become indispensable tools for both commercial food service and home kitchens. These instruments ensure accurate temperature measurements for various applications, including refrigerator temperature control, sterilization temperature monitoring, oven temperature control, pasteurization temperature range, and food processing sanitation. HACCP compliance thermometers are essential for maintaining food safety regulations and preventing foodborne illnesses. Infrared thermometers undergo rigorous calibration and thermal accuracy testing to ensure high-accuracy temperature measurement. Digital thermometers, with their instant-read features and data logging capabilities, offer enhanced product quality assurance. Culinary thermometers cater to specific applications, such as candy making, while wireless food thermometers enable remote temperature display for industrial food processing and commercial kitchens.

Food storage temperature monitoring is crucial for maintaining food quality, and precision food thermometers play a significant role in this process. Thermocouple response time is a critical factor in temperature measurement, and manufacturers prioritize quick response times to ensure accurate readings. Hygiene protocols compliance is another essential aspect, with precision food thermometers ensuring adherence to kitchen safety standards and food safety regulations. In the market, offline distribution channels hold the largest share, with department stores, hypermarkets, and kitchen specialty stores being popular choices for consumers. These retailers offer a wide range of precision food thermometers from various brands, allowing consumers to evaluate products closely and receive expert support and information.

Consumers value the convenience of purchasing these essential tools from these retailers, ensuring food safety and quality in their food preparation processes.

Precision Food Thermometers Market Size

Request Free Sample

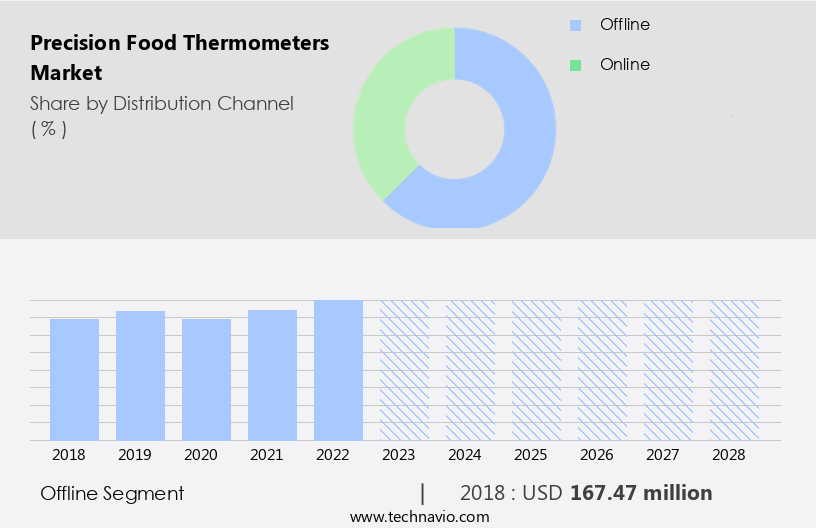
The Offline segment was valued at USD 167.47 million in 2018 and showed a gradual increase during the forecast period.

Regional Analysis

North America is estimated to contribute 37% to the growth of the global market during the forecast period. Technavio's analysts have elaborately explained the regional trends and drivers that shape the market during the forecast period.

Precision Food Thermometers Market Share by Geography

 Request Free Sample

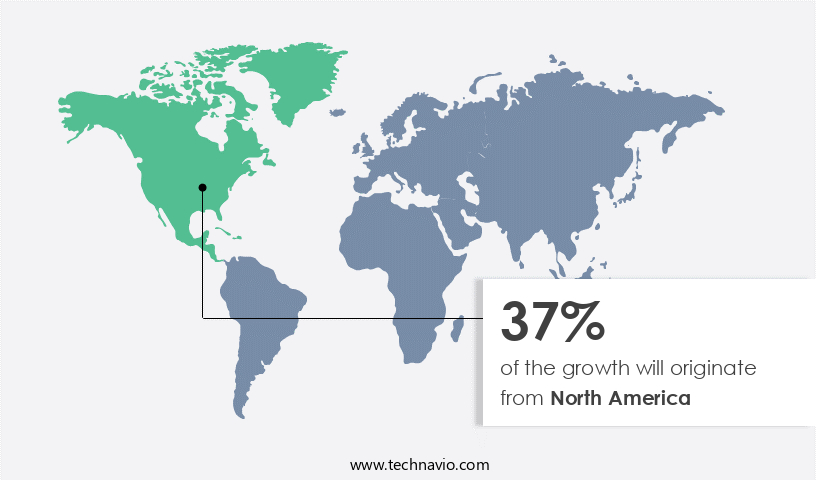
The market in North America is currently leading the global market, driven by the region's high standard of living and increased disposable income. According to the Food Safety and Inspection Service (FSIS) of the US Department of Agriculture (USDA), approximately 55% of individuals in the US utilize food thermometers to ensure food safety, as opposed to relying on color, hardness, or time as indicators. Hygiene protocols compliance and foodborne illness prevention are crucial in both residential and commercial food processing settings. In the food industry, high-accuracy temperature measurement is essential for refrigerator temperature control, sterilization temperature monitoring, oven temperature control, pasteurization temperature range, and baking temperature precision.

Thermal accuracy testing and infrared thermometer calibration are vital for maintaining food processing sanitation and food storage temperature. Culinary thermometer applications, such as candy making, require precise temperature control. Digital thermometers offer instant-read features, data logging capabilities, and meat doneness indicators. Wireless food thermometers provide remote temperature display, enhancing kitchen safety and efficiency in commercial food service and industrial food processing. Food safety regulations mandate adherence to strict kitchen safety standards, making temperature measurement a priority for product quality assurance.

Market Dynamics

Our researchers analyzed the data with 2023 as the base year, along with the key drivers, trends, and challenges. A holistic analysis of drivers will help companies refine their marketing strategies to gain a competitive advantage.

What are the key market drivers leading to the rise in the adoption of Precision Food Thermometers Industry?

  • The increasing importance of food safety and quality is the primary factor fueling market growth. (Maintaining a professional tone, ensuring grammatical correctness, and adhering to the 100-word limit.) 
  • Precision food thermometers play a crucial role in the food industry for ensuring food safety and regulatory compliance. These specialized gadgets are essential for monitoring the internal temperature of various food items, such as poultry, during cooking or chilling processes. The food processing industries, commercial kitchens, and professional chefs rely on these thermometers to maintain accurate temperatures, reducing the risk of foodborne illnesses and ensuring regulatory requirements are met. The market for precision food thermometers is experiencing significant growth, driven by increasing consumer awareness and demand for high-quality, safe food. Thermal accuracy testing and infrared thermometer calibration are essential for maintaining the reliability and precision of these thermometers.
  • In food processing, refrigerator temperature control, sterilization temperature monitoring, oven temperature control, and pasteurization temperature range are critical applications for precision food thermometers. Food processing sanitation is also a significant factor in the market's growth, as maintaining proper temperatures is essential for food safety and hygiene. The market's expansion is expected to continue during the forecast period, making it an attractive investment opportunity for businesses in the food industry.

What are the market trends shaping the Precision Food Thermometers Industry?

  • The growing importance of cooking at the correct temperature is a notable market trend. This emphasis on temperature control in culinary practices reflects a heightened focus on food quality and consistency.
  • In today's food industry, maintaining the correct temperature is crucial for food safety and storage. Foodborne illnesses can be prevented by ensuring perishable items are held at appropriate cold temperatures or cooked to high temperatures that kill harmful microorganisms. A precision food thermometer is an essential tool for achieving these temperature requirements. These devices provide accurate temperature readings, enabling food handlers to monitor food storage temperature and ensure compliance with hygiene protocols. During candy making or cooking, a candy making thermometer comes in handy for precise temperature data acquisition.
  • High-accuracy temperature measurement is essential for food safety and quality, and thermocouple response time is a critical factor in ensuring prompt and reliable readings. By using a precision food thermometer, food establishments can prioritize foodborne illness prevention and maintain the trust of their customers.

What challenges does the Precision Food Thermometers Industry face during its growth?

  • The lack of awareness regarding the utilization and importance of food thermometers poses a significant challenge to the growth of the industry. 
  • The market faces hindrances due to the traditional cooking methods of household consumers and the lack of awareness in certain regions. Many individuals rely on the color of food items to determine doneness, which can be inaccurate and may hinder the adoption of precision food thermometers. Furthermore, some consumers infrequently use food thermometers, relying instead on visual cues. In developing countries, the use of food thermometers is not widespread, which negatively impacts market demand. Despite these challenges, the market offers advanced technologies such as wireless, digital, instant-read, data logging, and meat doneness indicators.
  • These features enhance product quality assurance, particularly in commercial kitchens, including restaurants. Precision food thermometers ensure consistent and accurate food temperature readings, ensuring food safety and reducing the risk of foodborne illnesses.

Exclusive Customer Landscape

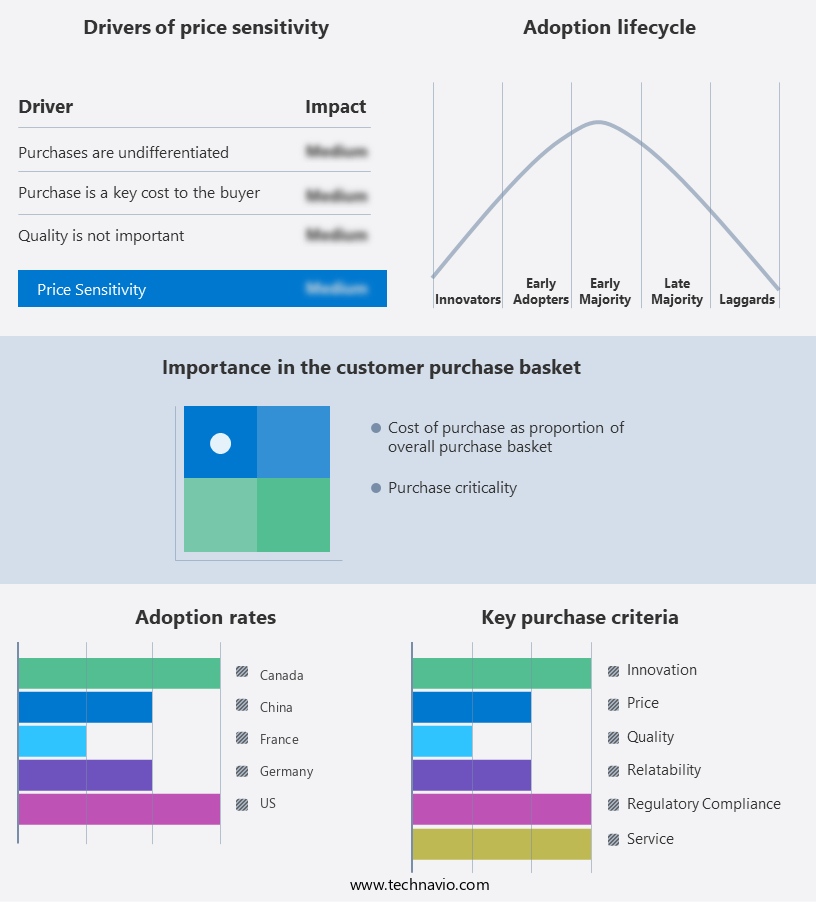
The precision food thermometers market forecasting report includes the adoption lifecycle of the market, covering from the innovator's stage to the laggard's stage. It focuses on adoption rates in different regions based on penetration. Furthermore, the precision food thermometers market report also includes key purchase criteria and drivers of price sensitivity to help companies evaluate and develop their market growth analysis strategies.

Precision Food Thermometers Market Share by Geography

 Customer Landscape

Key Companies & Market Insights

Companies are implementing various strategies, such as strategic alliances, precision food thermometers market forecast, partnerships, mergers and acquisitions, geographical expansion, and product/service launches, to enhance their presence in the industry.

Antylia Scientific - The company introduces a range of high-precision food thermometers under the brand name Traceable. Notable models include the 2 Second-Temp Food Traceable Thermometer, Robo Traceable Thermometer, and Platinum Ultra-Accurate Digital Traceable Thermometer, delivering reliable temperature readings for food safety and quality assurance.

The industry research and growth report includes detailed analyses of the competitive landscape of the market and information about key companies, including:

  • Antylia Scientific
  • B B Thermo Technik GmbH
  • CHINO Corp.
  • Digitron Italia Srl
  • Endress Hauser Group Services AG
  • Fortive Corp.
  • Gunther GmbH Temperaturmesstechnik
  • Hanna Instruments Inc.
  • Lavatools LLC
  • Lifetime Brands Inc.
  • Maverick Industries Inc.
  • S. L. TECHNOLOGIES
  • Shiv Dial Sud and Son
  • Tel Tru Manufacturing Co.
  • Testo SE and Co. KGaA
  • ThermoWorks
  • Xylem Inc.

Qualitative and quantitative analysis of companies has been conducted to help clients understand the wider business environment as well as the strengths and weaknesses of key industry players. Data is qualitatively analyzed to categorize companies as pure play, category-focused, industry-focused, and diversified; it is quantitatively analyzed to categorize companies as dominant, leading, strong, tentative, and weak.

Recent Development and News in Precision Food Thermometers Market

  • In January 2024, Thermo Fisher Scientific, a leading life sciences solutions provider, launched the "Thermo Scientific StarFish Precision Food Thermometer," which offers real-time temperature monitoring and data logging capabilities. This innovation was announced in a company press release (Thermo Fisher Scientific, 2024).
  • In March 2024, Hanna Instruments, a global manufacturer of process analytical instruments, entered into a strategic partnership with ChefSteps, a leading culinary technology company. The collaboration aimed to integrate Hanna's precision temperature sensors into ChefSteps' Joule Sous Vide machine, enhancing its temperature control capabilities (Hanna Instruments, 2024).
  • In May 2025, iDevices LLC, a smart home technology company, completed a Series C funding round, securing USD 30 million in investments. The funds will be used to expand their product line, including their iDevices Precision Sous Vide and Cook+ Smart Thermometer (iDevices LLC, 2025).
  • In the same month, the European Union's Food Safety Authority (EFSA) approved the use of Bluetooth Low Energy (BLE) technology for temperature monitoring in food establishments. This approval marked a significant shift towards digital food safety solutions, including precision food thermometers (EFSA, 2025).

Research Analyst Overview

  • The precision food thermometer market is characterized by a focus on calibration frequency and user training materials to ensure accurate temperature readings. Readability and ergonomics, software compatibility, and thermal drift compensation are essential features that cater to the evolving needs of businesses in the food industry. Data storage capacity, safety certifications, and data transfer protocols are crucial considerations for seamless integration into existing systems. Signal interference mitigation and signal transmission range are essential for uninterrupted temperature monitoring in industrial settings. Sensor technology types, response time variation, waterproof and dustproof designs, probe material compatibility, power source options, durability and longevity, cost-effectiveness analysis, material sourcing, cleaning and maintenance, user interface design, manufacturing processes, and environmental impact are all critical factors shaping the market.
  • Battery life expectancy, shock resistance testing, temperature compensation, hygiene guidelines adherence, and sensor life cycle are essential aspects that influence the total cost of ownership and overall value proposition for businesses.

Dive into Technavio's robust research methodology, blending expert interviews, extensive data synthesis, and validated models for unparalleled Precision Food Thermometers Market insights. See full methodology.

Market Scope

Report Coverage

Details

Page number

150

Base year

2023

Historic period

2018-2022

Forecast period

2024-2028

Growth momentum & CAGR

Accelerate at a CAGR of 8.69%

Market growth 2024-2028

USD 132.71 million

Market structure

Fragmented

YoY growth 2023-2024(%)

8.05

Key countries

US, Canada, Germany, France, and China

Competitive landscape

Leading Companies, Market Positioning of Companies, Competitive Strategies, and Industry Risks

Request Free Sample

What are the Key Data Covered in this Precision Food Thermometers Market Research and Growth Report?

  • CAGR of the Precision Food Thermometers industry during the forecast period
  • Detailed information on factors that will drive the growth and forecasting between 2024 and 2028
  • Precise estimation of the size of the market and its contribution of the industry in focus to the parent market
  • Accurate predictions about upcoming growth and trends and changes in consumer behaviour
  • Growth of the market across North America, Europe, Asia, and Rest of World (ROW)
  • Thorough analysis of the market's competitive landscape and detailed information about companies
  • Comprehensive analysis of factors that will challenge the precision food thermometers market growth of industry companies

We can help! Our analysts can customize this precision food thermometers market research report to meet your requirements.

Get in touch

1 Executive Summary

  • 1.1 Market overview
    • Exhibit 01: Executive Summary – Chart on Market Overview
    • Exhibit 02: Executive Summary – Data Table on Market Overview
    • Exhibit 03: Executive Summary – Chart on Global Market Characteristics
    • Exhibit 04: Executive Summary – Chart on Market by Geography
    • Exhibit 05: Executive Summary – Chart on Market Segmentation by Distribution Channel
    • Exhibit 06: Executive Summary – Chart on Market Segmentation by Application
    • Exhibit 07: Executive Summary – Chart on Incremental Growth
    • Exhibit 08: Executive Summary – Data Table on Incremental Growth
    • Exhibit 09: Executive Summary – Chart on Vendor Market Positioning

2 Market Landscape

  • 2.1 Market ecosystem
    • Exhibit 10: Parent market
    • Exhibit 11: Market Characteristics

3 Market Sizing

  • 3.1 Market definition
    • Exhibit 12: Offerings of vendors included in the market definition
  • 3.2 Market segment analysis
    • Exhibit 13: Market segments
  • 3.3 Market size 2023
    • 3.4 Market outlook: Forecast for 2023-2028
      • Exhibit 14: Chart on Global - Market size and forecast 2023-2028 ($ million)
      • Exhibit 15: Data Table on Global - Market size and forecast 2023-2028 ($ million)
      • Exhibit 16: Chart on Global Market: Year-over-year growth 2023-2028 (%)
      • Exhibit 17: Data Table on Global Market: Year-over-year growth 2023-2028 (%)

    4 Historic Market Size

    • 4.1 Global precision food thermometers market 2018 - 2022
      • Exhibit 18: Historic Market Size – Data Table on global precision food thermometers market 2018 - 2022 ($ million)
    • 4.2 Distribution Channel Segment Analysis 2018 - 2022
      • Exhibit 19: Historic Market Size – Distribution Channel Segment 2018 - 2022 ($ million)
    • 4.3 Application Segment Analysis 2018 - 2022
      • Exhibit 20: Historic Market Size – Application Segment 2018 - 2022 ($ million)
    • 4.4 Geography Segment Analysis 2018 - 2022
      • Exhibit 21: Historic Market Size – Geography Segment 2018 - 2022 ($ million)
    • 4.5 Country Segment Analysis 2018 - 2022
      • Exhibit 22: Historic Market Size – Country Segment 2018 - 2022 ($ million)

    5 Five Forces Analysis

    • 5.1 Five forces summary
      • Exhibit 23: Five forces analysis - Comparison between 2023 and 2028
    • 5.2 Bargaining power of buyers
      • Exhibit 24: Chart on Bargaining power of buyers – Impact of key factors 2023 and 2028
    • 5.3 Bargaining power of suppliers
      • Exhibit 25: Bargaining power of suppliers – Impact of key factors in 2023 and 2028
    • 5.4 Threat of new entrants
      • Exhibit 26: Threat of new entrants – Impact of key factors in 2023 and 2028
    • 5.5 Threat of substitutes
      • Exhibit 27: Threat of substitutes – Impact of key factors in 2023 and 2028
    • 5.6 Threat of rivalry
      • Exhibit 28: Threat of rivalry – Impact of key factors in 2023 and 2028
    • 5.7 Market condition
      • Exhibit 29: Chart on Market condition - Five forces 2023 and 2028

    6 Market Segmentation by Distribution Channel

    • 6.1 Market segments
      • Exhibit 30: Chart on Distribution Channel - Market share 2023-2028 (%)
      • Exhibit 31: Data Table on Distribution Channel - Market share 2023-2028 (%)
    • 6.2 Comparison by Distribution Channel
      • Exhibit 32: Chart on Comparison by Distribution Channel
      • Exhibit 33: Data Table on Comparison by Distribution Channel
    • 6.3 Offline - Market size and forecast 2023-2028
      • Exhibit 34: Chart on Offline - Market size and forecast 2023-2028 ($ million)
      • Exhibit 35: Data Table on Offline - Market size and forecast 2023-2028 ($ million)
      • Exhibit 36: Chart on Offline - Year-over-year growth 2023-2028 (%)
      • Exhibit 37: Data Table on Offline - Year-over-year growth 2023-2028 (%)
    • 6.4 Online - Market size and forecast 2023-2028
      • Exhibit 38: Chart on Online - Market size and forecast 2023-2028 ($ million)
      • Exhibit 39: Data Table on Online - Market size and forecast 2023-2028 ($ million)
      • Exhibit 40: Chart on Online - Year-over-year growth 2023-2028 (%)
      • Exhibit 41: Data Table on Online - Year-over-year growth 2023-2028 (%)
    • 6.5 Market opportunity by Distribution Channel
      • Exhibit 42: Market opportunity by Distribution Channel ($ million)
      • Exhibit 43: Data Table on Market opportunity by Distribution Channel ($ million)

    7 Market Segmentation by Application

    • 7.1 Market segments
      • Exhibit 44: Chart on Application - Market share 2023-2028 (%)
      • Exhibit 45: Data Table on Application - Market share 2023-2028 (%)
    • 7.2 Comparison by Application
      • Exhibit 46: Chart on Comparison by Application
      • Exhibit 47: Data Table on Comparison by Application
    • 7.3 Industrial - Market size and forecast 2023-2028
      • Exhibit 48: Chart on Industrial - Market size and forecast 2023-2028 ($ million)
      • Exhibit 49: Data Table on Industrial - Market size and forecast 2023-2028 ($ million)
      • Exhibit 50: Chart on Industrial - Year-over-year growth 2023-2028 (%)
      • Exhibit 51: Data Table on Industrial - Year-over-year growth 2023-2028 (%)
    • 7.4 Household - Market size and forecast 2023-2028
      • Exhibit 52: Chart on Household - Market size and forecast 2023-2028 ($ million)
      • Exhibit 53: Data Table on Household - Market size and forecast 2023-2028 ($ million)
      • Exhibit 54: Chart on Household - Year-over-year growth 2023-2028 (%)
      • Exhibit 55: Data Table on Household - Year-over-year growth 2023-2028 (%)
    • 7.5 Market opportunity by Application
      • Exhibit 56: Market opportunity by Application ($ million)
      • Exhibit 57: Data Table on Market opportunity by Application ($ million)

    8 Customer Landscape

    • 8.1 Customer landscape overview
      • Exhibit 58: Analysis of price sensitivity, lifecycle, customer purchase basket, adoption rates, and purchase criteria

    9 Geographic Landscape

    • 9.1 Geographic segmentation
      • Exhibit 59: Chart on Market share by geography 2023-2028 (%)
      • Exhibit 60: Data Table on Market share by geography 2023-2028 (%)
    • 9.2 Geographic comparison
      • Exhibit 61: Chart on Geographic comparison
      • Exhibit 62: Data Table on Geographic comparison
    • 9.3 North America - Market size and forecast 2023-2028
      • Exhibit 63: Chart on North America - Market size and forecast 2023-2028 ($ million)
      • Exhibit 64: Data Table on North America - Market size and forecast 2023-2028 ($ million)
      • Exhibit 65: Chart on North America - Year-over-year growth 2023-2028 (%)
      • Exhibit 66: Data Table on North America - Year-over-year growth 2023-2028 (%)
    • 9.4 Europe - Market size and forecast 2023-2028
      • Exhibit 67: Chart on Europe - Market size and forecast 2023-2028 ($ million)
      • Exhibit 68: Data Table on Europe - Market size and forecast 2023-2028 ($ million)
      • Exhibit 69: Chart on Europe - Year-over-year growth 2023-2028 (%)
      • Exhibit 70: Data Table on Europe - Year-over-year growth 2023-2028 (%)
    • 9.5 Asia - Market size and forecast 2023-2028
      • Exhibit 71: Chart on Asia - Market size and forecast 2023-2028 ($ million)
      • Exhibit 72: Data Table on Asia - Market size and forecast 2023-2028 ($ million)
      • Exhibit 73: Chart on Asia - Year-over-year growth 2023-2028 (%)
      • Exhibit 74: Data Table on Asia - Year-over-year growth 2023-2028 (%)
    • 9.6 Rest of World (ROW) - Market size and forecast 2023-2028
      • Exhibit 75: Chart on Rest of World (ROW) - Market size and forecast 2023-2028 ($ million)
      • Exhibit 76: Data Table on Rest of World (ROW) - Market size and forecast 2023-2028 ($ million)
      • Exhibit 77: Chart on Rest of World (ROW) - Year-over-year growth 2023-2028 (%)
      • Exhibit 78: Data Table on Rest of World (ROW) - Year-over-year growth 2023-2028 (%)
    • 9.7 US - Market size and forecast 2023-2028
      • Exhibit 79: Chart on US - Market size and forecast 2023-2028 ($ million)
      • Exhibit 80: Data Table on US - Market size and forecast 2023-2028 ($ million)
      • Exhibit 81: Chart on US - Year-over-year growth 2023-2028 (%)
      • Exhibit 82: Data Table on US - Year-over-year growth 2023-2028 (%)
    • 9.8 China - Market size and forecast 2023-2028
      • Exhibit 83: Chart on China - Market size and forecast 2023-2028 ($ million)
      • Exhibit 84: Data Table on China - Market size and forecast 2023-2028 ($ million)
      • Exhibit 85: Chart on China - Year-over-year growth 2023-2028 (%)
      • Exhibit 86: Data Table on China - Year-over-year growth 2023-2028 (%)
    • 9.9 Germany - Market size and forecast 2023-2028
      • Exhibit 87: Chart on Germany - Market size and forecast 2023-2028 ($ million)
      • Exhibit 88: Data Table on Germany - Market size and forecast 2023-2028 ($ million)
      • Exhibit 89: Chart on Germany - Year-over-year growth 2023-2028 (%)
      • Exhibit 90: Data Table on Germany - Year-over-year growth 2023-2028 (%)
    • 9.10 France - Market size and forecast 2023-2028
      • Exhibit 91: Chart on France - Market size and forecast 2023-2028 ($ million)
      • Exhibit 92: Data Table on France - Market size and forecast 2023-2028 ($ million)
      • Exhibit 93: Chart on France - Year-over-year growth 2023-2028 (%)
      • Exhibit 94: Data Table on France - Year-over-year growth 2023-2028 (%)
    • 9.11 Canada - Market size and forecast 2023-2028
      • Exhibit 95: Chart on Canada - Market size and forecast 2023-2028 ($ million)
      • Exhibit 96: Data Table on Canada - Market size and forecast 2023-2028 ($ million)
      • Exhibit 97: Chart on Canada - Year-over-year growth 2023-2028 (%)
      • Exhibit 98: Data Table on Canada - Year-over-year growth 2023-2028 (%)
    • 9.12 Market opportunity by geography
      • Exhibit 99: Market opportunity by geography ($ million)
      • Exhibit 100: Data Tables on Market opportunity by geography ($ million)

    10 Drivers, Challenges, and Trends

    • 10.1 Market drivers
      • 10.2 Market challenges
        • 10.3 Impact of drivers and challenges
          • Exhibit 101: Impact of drivers and challenges in 2023 and 2028
        • 10.4 Market trends

          11 Vendor Landscape

          • 11.1 Overview
            • 11.2 Vendor landscape
              • Exhibit 102: Overview on Criticality of inputs and Factors of differentiation
            • 11.3 Landscape disruption
              • Exhibit 103: Overview on factors of disruption
            • 11.4 Industry risks
              • Exhibit 104: Impact of key risks on business

            12 Vendor Analysis

            • 12.1 Vendors covered
              • Exhibit 105: Vendors covered
            • 12.2 Market positioning of vendors
              • Exhibit 106: Matrix on vendor position and classification
            • 12.3 Antylia Scientific
              • Exhibit 107: Antylia Scientific - Overview
              • Exhibit 108: Antylia Scientific - Product / Service
              • Exhibit 109: Antylia Scientific - Key news
              • Exhibit 110: Antylia Scientific - Key offerings
            • 12.4 B B Thermo Technik GmbH
              • Exhibit 111: B B Thermo Technik GmbH - Overview
              • Exhibit 112: B B Thermo Technik GmbH - Product / Service
              • Exhibit 113: B B Thermo Technik GmbH - Key offerings
            • 12.5 CHINO Corp.
              • Exhibit 114: CHINO Corp. - Overview
              • Exhibit 115: CHINO Corp. - Product / Service
              • Exhibit 116: CHINO Corp. - Key offerings
            • 12.6 Digitron Italia Srl
              • Exhibit 117: Digitron Italia Srl - Overview
              • Exhibit 118: Digitron Italia Srl - Product / Service
              • Exhibit 119: Digitron Italia Srl - Key offerings
            • 12.7 Endress Hauser Group Services AG
              • Exhibit 120: Endress Hauser Group Services AG - Overview
              • Exhibit 121: Endress Hauser Group Services AG - Product / Service
              • Exhibit 122: Endress Hauser Group Services AG - Key news
              • Exhibit 123: Endress Hauser Group Services AG - Key offerings
            • 12.8 Fortive Corp.
              • Exhibit 124: Fortive Corp. - Overview
              • Exhibit 125: Fortive Corp. - Business segments
              • Exhibit 126: Fortive Corp. - Key news
              • Exhibit 127: Fortive Corp. - Key offerings
              • Exhibit 128: Fortive Corp. - Segment focus
            • 12.9 Hanna Instruments Inc.
              • Exhibit 129: Hanna Instruments Inc. - Overview
              • Exhibit 130: Hanna Instruments Inc. - Product / Service
              • Exhibit 131: Hanna Instruments Inc. - Key offerings
            • 12.10 Lavatools LLC
              • Exhibit 132: Lavatools LLC - Overview
              • Exhibit 133: Lavatools LLC - Product / Service
              • Exhibit 134: Lavatools LLC - Key offerings
            • 12.11 Lifetime Brands Inc.
              • Exhibit 135: Lifetime Brands Inc. - Overview
              • Exhibit 136: Lifetime Brands Inc. - Business segments
              • Exhibit 137: Lifetime Brands Inc. - Key offerings
              • Exhibit 138: Lifetime Brands Inc. - Segment focus
            • 12.12 Maverick Industries Inc.
              • Exhibit 139: Maverick Industries Inc. - Overview
              • Exhibit 140: Maverick Industries Inc. - Product / Service
              • Exhibit 141: Maverick Industries Inc. - Key offerings
            • 12.13 S. L. TECHNOLOGIES
              • Exhibit 142: S. L. TECHNOLOGIES - Overview
              • Exhibit 143: S. L. TECHNOLOGIES - Product / Service
              • Exhibit 144: S. L. TECHNOLOGIES - Key offerings
            • 12.14 Shiv Dial Sud and Son
              • Exhibit 145: Shiv Dial Sud and Son - Overview
              • Exhibit 146: Shiv Dial Sud and Son - Product / Service
              • Exhibit 147: Shiv Dial Sud and Son - Key offerings
            • 12.15 Testo SE and Co. KGaA
              • Exhibit 148: Testo SE and Co. KGaA - Overview
              • Exhibit 149: Testo SE and Co. KGaA - Product / Service
              • Exhibit 150: Testo SE and Co. KGaA - Key offerings
            • 12.16 ThermoWorks
              • Exhibit 151: ThermoWorks - Overview
              • Exhibit 152: ThermoWorks - Product / Service
              • Exhibit 153: ThermoWorks - Key offerings
            • 12.17 Xylem Inc.
              • Exhibit 154: Xylem Inc. - Overview
              • Exhibit 155: Xylem Inc. - Business segments
              • Exhibit 156: Xylem Inc. - Key offerings
              • Exhibit 157: Xylem Inc. - Segment focus

            13 Appendix

            • 13.1 Scope of the report
              • 13.2 Inclusions and exclusions checklist
                • Exhibit 158: Inclusions checklist
                • Exhibit 159: Exclusions checklist
              • 13.3 Currency conversion rates for US$
                • Exhibit 160: Currency conversion rates for US$
              • 13.4 Research methodology
                • Exhibit 161: Research methodology
                • Exhibit 162: Validation techniques employed for market sizing
                • Exhibit 163: Information sources
              • 13.5 List of abbreviations
                • Exhibit 164: List of abbreviations

              Research Methodology

              Technavio presents a detailed picture of the market by way of study, synthesis, and summation of data from multiple sources. The analysts have presented the various facets of the market with a particular focus on identifying the key industry influencers. The data thus presented is comprehensive, reliable, and the result of extensive research, both primary and secondary.

              INFORMATION SOURCES

              Primary sources

              • Manufacturers and suppliers
              • Channel partners
              • Industry experts
              • Strategic decision makers

              Secondary sources

              • Industry journals and periodicals
              • Government data
              • Financial reports of key industry players
              • Historical data
              • Press releases

              DATA ANALYSIS

              Data Synthesis

              • Collation of data
              • Estimation of key figures
              • Analysis of derived insights

              Data Validation

              • Triangulation with data models
              • Reference against proprietary databases
              • Corroboration with industry experts

              REPORT WRITING

              Qualitative

              • Market drivers
              • Market challenges
              • Market trends
              • Five forces analysis

              Quantitative

              • Market size and forecast
              • Market segmentation
              • Geographical insights
              • Competitive landscape

              Interested in this report?

              Get your sample now to see our research methodology and insights!

              Download Now

              Frequently Asked Questions

              Precision Food Thermometers market growth will increase by $ 132.71 mn during 2024-2028.

              The Precision Food Thermometers market is expected to grow at a CAGR of 8.69% during 2024-2028.

              Precision Food Thermometers market is segmented by Distribution Channel( Offline, Online) Application( Industrial, Household)

              Antylia Scientific, B B Thermo Technik GmbH, CHINO Corp., Digitron Italia Srl, Endress Hauser Group Services AG, Fortive Corp., Gunther GmbH Temperaturmesstechnik, Hanna Instruments Inc., Lavatools LLC, Lifetime Brands Inc., Maverick Industries Inc., S. L. TECHNOLOGIES, Shiv Dial Sud and Son, Tel Tru Manufacturing Co., Testo SE and Co. KGaA, ThermoWorks, Xylem Inc. are a few of the key vendors in the Precision Food Thermometers market.

              North America will register the highest growth rate of 37% among the other regions. Therefore, the Precision Food Thermometers market in North America is expected to garner significant business opportunities for the vendors during the forecast period.

              US, Canada, Germany, France, China

              • Growing demand for food safety and qualityTo precisely monitor the internal temperature of different food items is the driving factor this market.
              • such as chicken is the driving factor this market.
              • the food industry uses precision food thermometers is the driving factor this market.
              • which are specialized gadgets. They are made to meet the unique needs of the food processing industries is the driving factor this market.
              • commercial kitchens is the driving factor this market.
              • and professional chefs. By ensuring that food is cooked or chilled to the correct temperature is the driving factor this market.
              • these thermometers help lower the risk of foodborne illnesses and ensure that food safety regulations are satisfied. The market for precision food thermometers is expanding significantly and is predicted to continue during the forecast period. The market is expanding as a result of rising consumer awareness and increased demand for high-quality and safe food. The market growth is also being aided by the stringent rules and guidelines that food regulatory agencies such as the Food Safety and Standards Authority of India (FSSAI) have enforced regarding food safety. Thus is the driving factor this market.
              • the growing demand for food safety and quality is expected to fuel the growth of the global precision food thermometers market during the forecast period. is the driving factor this market.

              The Precision Food Thermometers market vendors should focus on grabbing business opportunities from the Offline segment as it accounted for the largest market share in the base year.
              RIA - Research AI Assistant
              Ask RIA