Preclinical Animal Imaging Market Analysis North America, Europe, Asia, Rest of World (ROW) - US, China, Germany, Japan, UK, India, France, Canada, Brazil, Australia - Size and Forecast 2024-2028

Preclinical Animal Imaging Market Analysis North America, Europe, Asia, Rest of World (ROW) - US, China, Germany, Japan, UK, India, France, Canada, Brazil, Australia - Size and Forecast 2024-2028

Published: Oct 2024 204 Pages SKU: IRTNTR80268

Market Overview at a Glance

$1.17 B
Market Opportunity
5.3%
CAGR
4.9
YoY growth 2023-2024(%)

Preclinical Animal Imaging Market Size 2024-2028

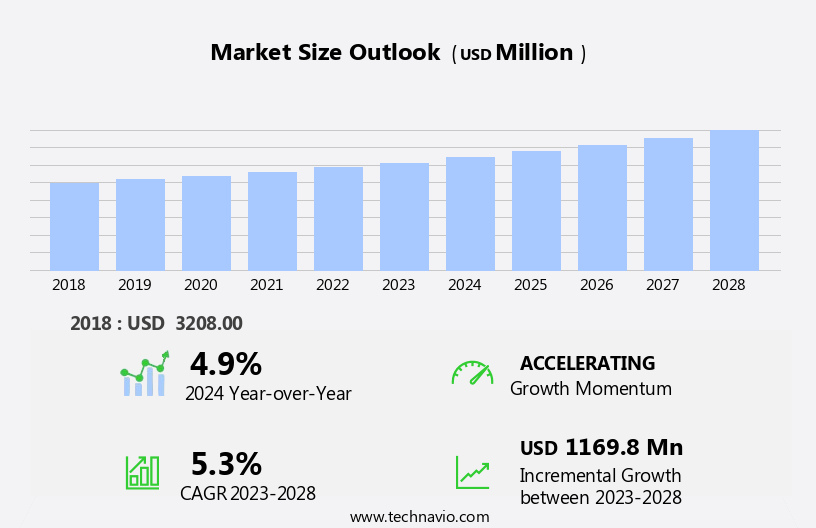
The preclinical animal imaging market size is forecast to increase by USD 1.17 billion, at a CAGR of 5.3% between 2023 and 2028.

  • The market is experiencing significant growth, driven by government initiatives in veterinary services and the increasing adoption of animal-friendly imaging technologies, such as CT and MRI scans. These non-invasive imaging techniques enable researchers to study animal models in greater detail, contributing to advancements in drug discovery and development. However, the market faces challenges, including the availability of viable alternatives, such as ultrasound and nuclear imaging, which may offer lower costs and less complexity. As the demand for more accurate and non-invasive imaging techniques continues to grow, companies in the market must innovate and differentiate their offerings to meet the evolving needs of researchers and veterinary services.
  • To capitalize on opportunities and navigate challenges effectively, market players should focus on developing advanced imaging technologies that offer superior image quality, ease of use, and cost-effectiveness. Additionally, partnerships and collaborations with research institutions and veterinary services can help companies expand their reach and enhance their market position. Overall, the market is poised for continued growth, driven by technological advancements and increasing demand for non-invasive imaging solutions in research and veterinary applications.

What will be the Size of the Preclinical Animal Imaging Market during the forecast period?

Preclinical Animal Imaging Market Size

Explore in-depth regional segment analysis with market size data - historical 2018-2022 and forecasts 2024-2028 - in the full report.  
Request Free Sample

The market continues to evolve, driven by advancements in technology and increasing demand for more accurate and detailed insights into biological processes. Oncology imaging plays a significant role in this market, with applications in tumor growth monitoring and receptor ligand binding studies. Gene expression imaging and bioluminescence imaging are also essential tools, providing valuable information on cellular processes and gene function. Three-dimensional reconstruction and quantitative image analysis enable researchers to gain a better understanding of complex structures and processes within living organisms. Micro-CT systems and multimodal imaging systems offer high-resolution imaging capabilities, while inflammation imaging provides insights into immune responses and disease progression.

Pet imaging agents, drug delivery efficacy studies, and radiopharmaceutical development are other key areas of focus in the market. Small animal imaging is a critical application, with a growing need for in vivo fluorescence and functional imaging techniques to study various diseases and conditions. Advancements in image registration algorithms, transgenic animal models, image fusion techniques, and pharmacokinetic modeling continue to unfold, enabling more precise and accurate data analysis. The integration of these technologies with contrast enhanced imaging, neurological imaging, and optical molecular imaging expands the scope of preclinical research and facilitates the development of new therapeutics.

Cardiovascular imaging and anatomical landmarking are also important applications of preclinical animal imaging, with potential for significant impact on disease diagnosis and treatment. Image processing software plays a crucial role in enhancing the quality and accuracy of imaging data, enabling researchers to extract valuable insights from complex images. The market is characterized by continuous innovation and evolving patterns, with ongoing research and development in various sectors. The integration of these advanced imaging technologies is transforming the way researchers study biological processes and develop new therapeutics, ultimately leading to improved patient outcomes.

How is this Preclinical Animal Imaging Industry segmented?

The preclinical animal imaging industry research report provides comprehensive data (region-wise segment analysis), with forecasts and estimates in "USD million" for the period 2024-2028, as well as historical data from 2018-2022 for the following segments.

  • Product Type
    • Instrument
    • Reagent
    • Software
  • End-user
    • Pharmaceutical and biotechnology companies
    • Academic and research institutes
    • Others
  • Geography
    • North America
      • US
    • Europe
      • Germany
      • UK
    • APAC
      • China
      • Japan
    • Rest of World (ROW)

    By Product Type Insights

    The instrument segment is estimated to witness significant growth during the forecast period.

    The market is marked by the integration of advanced technologies to facilitate comprehensive research in various fields. One significant development is the use of versatile imaging systems, such as the IVIS SpectrumCT from Perkin Elmer Inc., which combines optical and micro-CT capabilities. This system supports longitudinal imaging studies in small animal models, providing researchers with critical insights into complex biological systems through simultaneous molecular and anatomical imaging. The IVIS SpectrumCT's advanced features include a constant horizontal gantry motion, flat panel detector, and automated integration of optical and micro-CT imaging. These elements ensure exceptional performance for low-dose imaging, streamlining the process and enabling detailed, accurate results.

    Furthermore, this technology is instrumental in various applications, including tumor growth monitoring, receptor ligand binding, image registration algorithms, transgenic animal models, image fusion techniques, pharmacokinetic modeling, cellular imaging probes, biodistribution studies, knockout animal models, oncology imaging, gene expression imaging, bioluminescence imaging, three-dimensional reconstruction, quantitative image analysis, micro-CT systems, multimodal imaging systems, inflammation imaging, pet imaging agents, drug delivery efficacy, radiopharmaceutical development, small animal imaging, infection imaging, spect radiotracers, targeted molecular imaging, neurological imaging, contrast enhanced imaging, optical molecular imaging, functional imaging techniques, preclinical MRI scanners, therapeutic response assessment, anatomical landmarking, cardiovascular imaging, image processing software, and in vivo fluorescence.

    These applications span various research areas, including oncology, neurology, inflammation, and cardiovascular diseases, among others. The market's continuous evolution is driven by the development of innovative imaging technologies and their integration into preclinical research, enabling researchers to gain deeper insights into complex biological systems and accelerate the drug discovery process.

    Preclinical Animal Imaging Market Size

    Request Free Sample

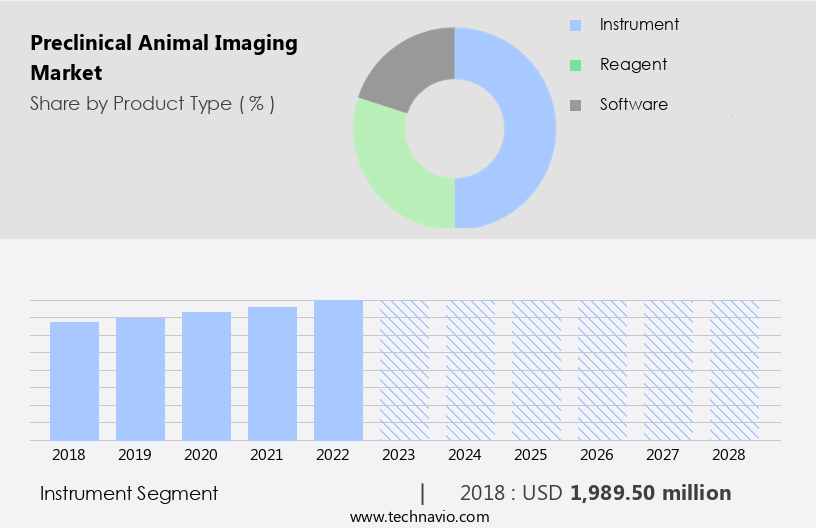
    The Instrument segment was valued at USD 1.99 billion in 2018 and showed a gradual increase during the forecast period.

    Regional Analysis

    North America is estimated to contribute 34% to the growth of the global market during the forecast period.Technavio’s analysts have elaborately explained the regional trends and drivers that shape the market during the forecast period.

    Preclinical Animal Imaging Market Share by Geography

     Request Free Sample

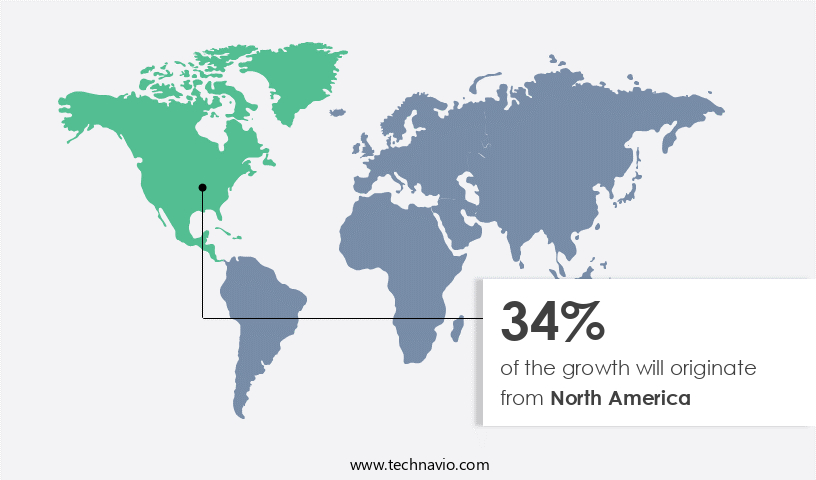
    The market in North America is experiencing significant growth due to advancements in veterinary diagnostics and increasing emphasis on animal welfare. In this context, VolitionRx Limited, a global epigenetics company, recently introduced the Nu.Q Vet Cancer Test in veterinary clinics across the United States through Antech, a leading veterinary diagnostics provider. Operated on the Element Analyzer, this in-clinic test offers veterinarians a rapid, accurate, and cost-effective tool for cancer screening in high-risk breeds and older dogs. This development underscores the region's commitment to enhancing diagnostic capabilities and improving animal health outcomes. Advancements in preclinical animal imaging technologies are driving innovation in various fields, including tumor growth monitoring, receptor ligand binding, image registration algorithms, transgenic animal models, image fusion techniques, pharmacokinetic modeling, cellular imaging probes, biodistribution studies, knockout animal models, oncology imaging, gene expression imaging, bioluminescence imaging, three-dimensional reconstruction, quantitative image analysis, micro-CT systems, multimodal imaging systems, inflammation imaging, pet imaging agents, drug delivery efficacy, radiopharmaceutical development, small animal imaging, infection imaging, spect radiotracers, targeted molecular imaging, neurological imaging, contrast enhanced imaging, optical molecular imaging, functional imaging techniques, preclinical MRI scanners, therapeutic response assessment, anatomical landmarking, cardiovascular imaging, image processing software, and in vivo fluorescence.

    These technologies enable researchers to study various aspects of animal health and disease, from molecular and cellular levels to whole organ systems, facilitating a more comprehensive understanding of animal physiology and pathology. Moreover, the integration of advanced imaging techniques with other research areas, such as pharmacokinetic modeling and drug delivery efficacy assessment, is enabling the development of more effective therapeutic interventions for various diseases. The use of targeted molecular imaging, for instance, allows researchers to visualize and quantify the distribution and accumulation of therapeutic agents in specific cells or tissues, providing valuable information for optimizing drug dosing and delivery strategies.

    Similarly, the application of multimodal imaging systems, which combine multiple imaging modalities, enables researchers to obtain complementary information on tissue structure, function, and molecular composition, enhancing the accuracy and sensitivity of diagnostic and therapeutic interventions. In the field of oncology imaging, for example, the use of contrast-enhanced imaging techniques, such as CT and MRI, enables the detection and characterization of tumors, while functional imaging techniques, such as positron emission tomography (PET) and optical molecular imaging, provide information on tumor metabolism and molecular signaling pathways. This information is crucial for developing more effective cancer therapies and monitoring their response in preclinical animal models.

    The integration of imaging technologies with other research areas, such as gene expression imaging and inflammation imaging, is also shedding new light on the underlying mechanisms of various diseases. For instance, gene expression imaging, which uses techniques such as fluorescence in situ hybridization (FISH) and bioluminescence imaging, enables the visualization and quantification of specific genes and their expression patterns in living animals. This information can be used to identify novel therapeutic targets and biomarkers for various diseases, including cancer, neurological disorders, and inflammatory diseases. Similarly, inflammation imaging, which uses techniques such as magnetic resonance imaging (MRI) and optical imaging, enables the visualization and quantification of inflammatory processes in living animals.

    This information is crucial for understanding the underlying mechanisms of various inflammatory diseases, such as arthritis and colitis, and for developing more effective therapeutic interventions. In conclusion, the market is experiencing significant growth due to the increasing demand for more accurate, sensitive, and cost-effective diagnostic and therapeutic interventions for various animal diseases. The integration of advanced imaging technologies with other research areas, such as pharmacokinetic modeling, drug delivery efficacy assessment, gene expression imaging, and inflammation imaging, is enabling researchers to obtain a more comprehensive understanding of animal physiology and pathology, facilitating the development of more effective therapeutic interventions and improving animal health outcomes.

    Market Dynamics

    Our researchers analyzed the data with 2023 as the base year, along with the key drivers, trends, and challenges. A holistic analysis of drivers will help companies refine their marketing strategies to gain a competitive advantage.

    The market encompasses advanced non-invasive imaging technologies used to examine the internal structures and functions of animals in a research setting. This market is characterized by continuous innovation and expanding applications, focusing on improving the efficiency and accuracy of preclinical studies. Key areas involve the use of magnetic resonance imaging (MRI), computed tomography (CT), positron emission tomography (PET), and optical imaging techniques to assess various aspects of animal health. Through methods such as dynamic contrast-enhanced MRI and multimodal imaging, researchers can gain valuable insights into the pathophysiology of diseases, enabling the development of novel therapeutic strategies. With considerations like increased sensitivity, specificity, and resolution, the market players are investing in advanced imaging technologies. For instance, high-field MRI systems offer superior image quality and are increasingly being adopted for preclinical research. Furthermore, the integration of artificial intelligence (AI) and machine learning algorithms in imaging analysis is revolutionizing the way data is interpreted, enhancing the overall value of preclinical studies. In addition, the adoption of preclinical animal imaging is driven by the need for non-invasive, repeatable, and standardized imaging techniques to assess animal models of human diseases. This not only accelerates the drug discovery process but also reduces the need for invasive procedures, thereby improving animal welfare. The market is poised for significant growth, as research institutions and pharmaceutical companies continue to invest in cutting-edge imaging technologies to advance their research objectives. This investment in innovation is expected to lead to the development of more sophisticated imaging systems, improved imaging protocols, and enhanced data analysis tools.

    What are the key market drivers leading to the rise in the adoption of Preclinical Animal Imaging Industry?

    • Government initiatives play a crucial role in driving the market growth in veterinary services. 

    • The market is experiencing substantial growth due to increasing investments in veterinary services and research. This growth is driven by the importance of understanding animal health and disease progression, particularly in areas such as tumor growth monitoring and pharmacokinetic modeling. Advanced imaging techniques, including receptor ligand binding, image registration algorithms, and image fusion, are essential tools for researchers working with transgenic and knockout animal models. These techniques enable the use of cellular imaging probes for biodistribution studies, providing valuable insights into drug efficacy and toxicity.
    • The integration of imaging data from multiple modalities can further enhance the accuracy and comprehensiveness of these studies. The development of these advanced imaging technologies is a critical step towards improving animal welfare and advancing scientific research.

    What are the market trends shaping the Preclinical Animal Imaging Industry?

    • The adoption of animal-friendly CT and MRI scans is gaining momentum as the preferred trend in the medical imaging market. These advanced technologies offer accurate diagnostic capabilities while minimizing animal distress and discomfort.

    • The market is experiencing a substantial growth due to the increasing adoption of advanced imaging technologies, prioritizing animal welfare. Oncology imaging, gene expression imaging, and inflammation imaging are key application areas driving market expansion. Technologies such as bioluminescence imaging, three-dimensional reconstruction, and quantitative image analysis are gaining popularity. Micro-ct systems and multimodal imaging systems are also in high demand, offering improved diagnostic accuracy. Pet imaging agents are essential for enhancing the contrast and resolution of images. The market is witnessing innovation, with new developments in bioluminescence imaging and multimodal imaging systems.
    • These advancements aim to provide more accurate and non-invasive diagnostic solutions, reducing animal stress during procedures. The market is poised for continued growth, driven by the need for more precise and humane diagnostic tools.

    What challenges does the Preclinical Animal Imaging Industry face during its growth?

    • The growth of the industry is significantly impacted by the limited availability of viable alternatives. 

    • The market is experiencing notable developments in various imaging modalities, driven by advancements in drug delivery efficacy assessment and radiopharmaceutical development. Small animal imaging, including infection imaging, neurological imaging, and contrast-enhanced imaging, benefits from these innovations. Spect radiotracers and targeted molecular imaging are key techniques advancing the field, enabling researchers to monitor biological processes and evaluate therapeutic interventions with high precision. Optical molecular imaging is another promising approach, offering real-time, high-resolution visualization of biological processes. Despite challenges posed by the emergence of non-animal testing alternatives, the market remains dynamic due to the continued demand for accurate and reliable preclinical imaging solutions.
    • Innovative technologies, such as organs-on-a-chip and 3D bioprinting, are revolutionizing the field by simplifying biological systems and providing a more precise and cost-effective platform for drug screening and development.

    Exclusive Customer Landscape

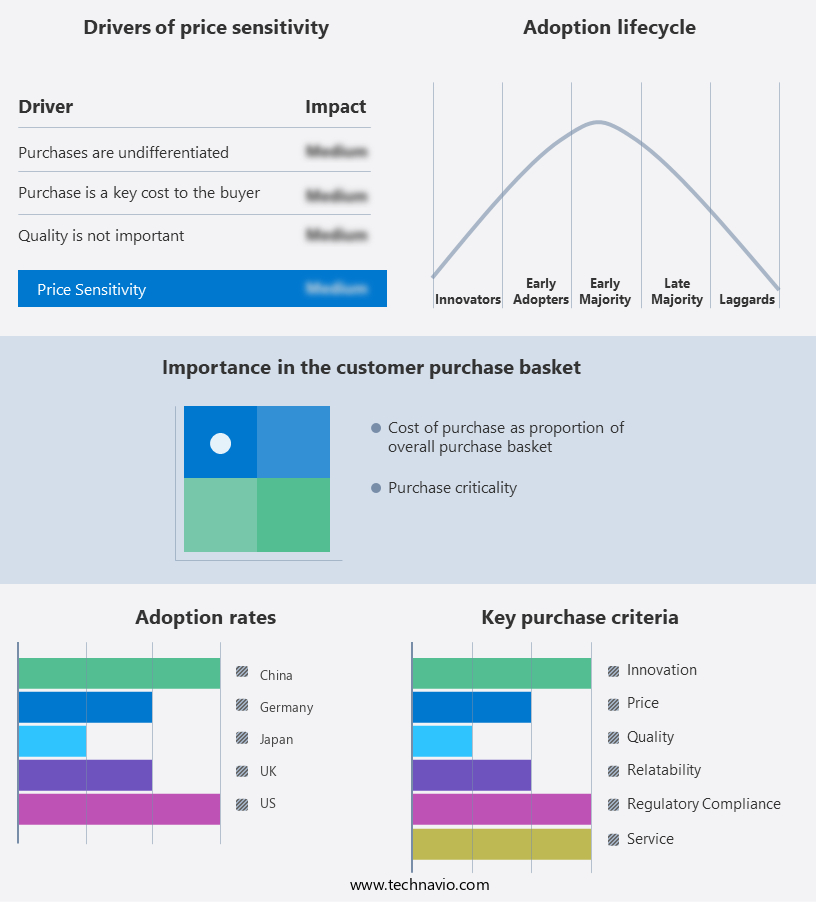
    The preclinical animal imaging market forecasting report includes the adoption lifecycle of the market, covering from the innovator’s stage to the laggard’s stage. It focuses on adoption rates in different regions based on penetration. Furthermore, the preclinical animal imaging market report also includes key purchase criteria and drivers of price sensitivity to help companies evaluate and develop their market growth analysis strategies.

    Preclinical Animal Imaging Market Share by Geography

     Customer Landscape

    Key Companies & Market Insights

    Companies are implementing various strategies, such as strategic alliances, preclinical animal imaging market forecast, partnerships, mergers and acquisitions, geographical expansion, and product/service launches, to enhance their presence in the industry.

    Agilent Technologies Inc. - The company specializes in providing advanced preclinical animal imaging solutions, encompassing MRI, PET-CT, optical, and ultrasound systems. These technologies enable comprehensive evaluation of animal subjects in research and development settings, contributing significantly to scientific discovery and innovation.

    The industry research and growth report includes detailed analyses of the competitive landscape of the market and information about key companies, including:

    • Agilent Technologies Inc.
    • Aspect Imaging Ltd.
    • Axion BioSystems Inc.
    • Berthold Technologies GmbH and Co.KG
    • Bruker Corp.
    • Cubresa Inc.
    • FUZIFILM Sonosite Inc.
    • GE Healthcare Technologies Inc.
    • Invicro. LLC
    • LI COR Inc.
    • Mediso Ltd.
    • MILabs BV
    • Perkin Elmer Inc.
    • Scintica Instrumentation Inc
    • Siemens Healthineers AG
    • Taconic Biosciences Inc.
    • Thermo Fisher Scientific Inc.
    • TriFoil Imaging
    • Vieworks Co Ltd

    Qualitative and quantitative analysis of companies has been conducted to help clients understand the wider business environment as well as the strengths and weaknesses of key industry players. Data is qualitatively analyzed to categorize companies as pure play, category-focused, industry-focused, and diversified; it is quantitatively analyzed to categorize companies as dominant, leading, strong, tentative, and weak.

    Recent Development and News in Preclinical Animal Imaging Market

    • In January 2024, Siemens Healthineers, a leading medical technology company, announced the launch of its new preclinical MRI system, the Vida, designed specifically for small animal imaging. This system offers higher resolution and faster imaging capabilities, enabling more detailed and accurate research (Siemens Healthineers press release).
    • In March 2024, Philips and Bruker, two major players in the preclinical imaging market, entered into a strategic collaboration to integrate Philips' image registration and analysis software with Bruker's preclinical MRI systems. This partnership aims to improve the efficiency and accuracy of preclinical imaging studies (Philips and Bruker press releases).
    • In May 2024, Medtronic, a global healthcare solutions company, completed the acquisition of Mazor Robotics, a leading provider of robotic-assisted surgical systems. While primarily focused on human healthcare, this acquisition could potentially expand Medtronic's offerings into the market, particularly in the area of surgical planning and guidance (Medtronic press release).
    • In February 2025, the European Commission approved the use of PET-CT scans for preclinical research under the European Medicines Agency's Centralised Procedure. This approval is expected to increase the adoption of preclinical PET-CT imaging in Europe, as it offers improved diagnostic accuracy and better understanding of disease mechanisms (European Medicines Agency press release).

    Research Analyst Overview

    • The preclinical imaging market encompasses various noninvasive imaging methods, including radiotracer metabolism studies and molecular imaging, which utilize contrast agents for enhanced sensitivity and spatial resolution. Preclinical imaging models are essential for longitudinal imaging studies, enabling researchers to track disease progression and response to therapeutics. Machine learning applications in image data processing improve temporal resolution and reduce image artifacts, enhancing the accuracy of results. Invasive imaging methods, such as histological correlation with immunohistochemistry analysis, remain crucial for validating noninvasive findings. Anesthesia protocols and animal handling procedures are essential considerations to ensure consistent imaging results. Dose optimization studies and image quality metrics are critical for assessing the safety and efficacy of imaging probes, including optical imaging probes and micropet technology.
    • Three-dimensional image visualization and image segmentation methods facilitate better understanding of complex structures and processes. Contrast agent selection and imaging biomarkers play a pivotal role in enhancing the diagnostic value of preclinical imaging. High-throughput screening and data analysis workflows enable researchers to process large datasets efficiently, accelerating the pace of discovery. Image acquisition protocols and dose optimization studies are ongoing areas of research to improve the overall quality and reliability of preclinical imaging data.

    Dive into Technavio’s robust research methodology, blending expert interviews, extensive data synthesis, and validated models for unparalleled Preclinical Animal Imaging Market insights. See full methodology.

    Market Scope

    Report Coverage

    Details

    Page number

    204

    Base year

    2023

    Historic period

    2018-2022

    Forecast period

    2024-2028

    Growth momentum & CAGR

    Accelerate at a CAGR of 5.3%

    Market growth 2024-2028

    USD 1169.8 million

    Market structure

    Fragmented

    YoY growth 2023-2024(%)

    4.9

    Key countries

    US, China, Germany, Japan, and UK

    Competitive landscape

    Leading Companies, Market Positioning of Companies, Competitive Strategies, and Industry Risks

    Request Free Sample

    What are the Key Data Covered in this Preclinical Animal Imaging Market Research and Growth Report?

    • CAGR of the Preclinical Animal Imaging industry during the forecast period
    • Detailed information on factors that will drive the growth and forecasting between 2024 and 2028
    • Precise estimation of the size of the market and its contribution of the industry in focus to the parent market
    • Accurate predictions about upcoming growth and trends and changes in consumer behaviour
    • Growth of the market across North America, Europe, Asia, and Rest of World (ROW)
    • Thorough analysis of the market’s competitive landscape and detailed information about companies
    • Comprehensive analysis of factors that will challenge the preclinical animal imaging market growth of industry companies

    We can help! Our analysts can customize this preclinical animal imaging market research report to meet your requirements.

    Get in touch


    1 Executive Summary

    • 1.1 Market overview
      • Executive Summary - Chart on Market Overview
      • Executive Summary - Data Table on Market Overview
      • Executive Summary - Chart on Global Market Characteristics
      • Executive Summary - Chart on Market by Geography
      • Executive Summary - Chart on Market Segmentation by Product Type
      • Executive Summary - Chart on Market Segmentation by End-user
      • Executive Summary - Chart on Incremental Growth
      • Executive Summary - Data Table on Incremental Growth
      • Executive Summary - Chart on Company Market Positioning

    2 Technavio Analysis

    • 2.1 Analysis of price sensitivity, lifecycle, customer purchase basket, adoption rates, and purchase criteria
      • Analysis of price sensitivity, lifecycle, customer purchase basket, adoption rates, and purchase criteria
    • 2.2 Criticality of inputs and Factors of differentiation
      • Overview on criticality of inputs and factors of differentiation
    • 2.3 Factors of disruption
      • Overview on factors of disruption
    • 2.4 Impact of drivers and challenges
      • Impact of drivers and challenges in 2023 and 2028

    3 Market Landscape

    • 3.1 Market ecosystem
      • Parent Market
      • Data Table on - Parent Market
    • 3.2 Market characteristics
      • Market characteristics analysis
    • 3.3 Value chain analysis
      • Value Chain Analysis

    4 Market Sizing

    • 4.1 Market definition
      • Offerings of companies included in the market definition
    • 4.2 Market segment analysis
      • Market segments
    • 4.3 Market size 2023
      • 4.4 Market outlook: Forecast for 2023-2028
        • Chart on Global - Market size and forecast 2023-2028 ($ million)
        • Data Table on Global - Market size and forecast 2023-2028 ($ million)
        • Chart on Global Market: Year-over-year growth 2023-2028 (%)
        • Data Table on Global Market: Year-over-year growth 2023-2028 (%)

      5 Historic Market Size

      • 5.1 Global Preclinical Animal Imaging Market 2018 - 2022
        • Historic Market Size - Data Table on Global Preclinical Animal Imaging Market 2018 - 2022 ($ million)
      • 5.2 Product Type segment analysis 2018 - 2022
        • Historic Market Size - Product Type Segment 2018 - 2022 ($ million)
      • 5.3 End-user segment analysis 2018 - 2022
        • Historic Market Size - End-user Segment 2018 - 2022 ($ million)
      • 5.4 Geography segment analysis 2018 - 2022
        • Historic Market Size - Geography Segment 2018 - 2022 ($ million)
      • 5.5 Country segment analysis 2018 - 2022
        • Historic Market Size - Country Segment 2018 - 2022 ($ million)

      6 Qualitative Analysis

      • 6.1 Impact of AI on the Global preclinical animal imaging market

        7 Five Forces Analysis

        • 7.1 Five forces summary
          • Five forces analysis - Comparison between 2023 and 2028
        • 7.2 Bargaining power of buyers
          • Bargaining power of buyers - Impact of key factors 2023 and 2028
        • 7.3 Bargaining power of suppliers
          • Bargaining power of suppliers - Impact of key factors in 2023 and 2028
        • 7.4 Threat of new entrants
          • Threat of new entrants - Impact of key factors in 2023 and 2028
        • 7.5 Threat of substitutes
          • Threat of substitutes - Impact of key factors in 2023 and 2028
        • 7.6 Threat of rivalry
          • Threat of rivalry - Impact of key factors in 2023 and 2028
        • 7.7 Market condition
          • Chart on Market condition - Five forces 2023 and 2028

        8 Market Segmentation by Product Type

        • 8.1 Market segments
          • Chart on Product Type - Market share 2023-2028 (%)
          • Data Table on Product Type - Market share 2023-2028 (%)
        • 8.2 Comparison by Product Type
          • Chart on Comparison by Product Type
          • Data Table on Comparison by Product Type
        • 8.3 Instrument - Market size and forecast 2023-2028
          • Chart on Instrument - Market size and forecast 2023-2028 ($ million)
          • Data Table on Instrument - Market size and forecast 2023-2028 ($ million)
          • Chart on Instrument - Year-over-year growth 2023-2028 (%)
          • Data Table on Instrument - Year-over-year growth 2023-2028 (%)
        • 8.4 Reagent - Market size and forecast 2023-2028
          • Chart on Reagent - Market size and forecast 2023-2028 ($ million)
          • Data Table on Reagent - Market size and forecast 2023-2028 ($ million)
          • Chart on Reagent - Year-over-year growth 2023-2028 (%)
          • Data Table on Reagent - Year-over-year growth 2023-2028 (%)
        • 8.5 Software - Market size and forecast 2023-2028
          • Chart on Software - Market size and forecast 2023-2028 ($ million)
          • Data Table on Software - Market size and forecast 2023-2028 ($ million)
          • Chart on Software - Year-over-year growth 2023-2028 (%)
          • Data Table on Software - Year-over-year growth 2023-2028 (%)
        • 8.6 Market opportunity by Product Type
          • Market opportunity by Product Type ($ million)
          • Data Table on Market opportunity by Product Type ($ million)

        9 Market Segmentation by End-user

        • 9.1 Market segments
          • Chart on End-user - Market share 2023-2028 (%)
          • Data Table on End-user - Market share 2023-2028 (%)
        • 9.2 Comparison by End-user
          • Chart on Comparison by End-user
          • Data Table on Comparison by End-user
        • 9.3 Pharmaceutical and biotechnology companies - Market size and forecast 2023-2028
          • Chart on Pharmaceutical and biotechnology companies - Market size and forecast 2023-2028 ($ million)
          • Data Table on Pharmaceutical and biotechnology companies - Market size and forecast 2023-2028 ($ million)
          • Chart on Pharmaceutical and biotechnology companies - Year-over-year growth 2023-2028 (%)
          • Data Table on Pharmaceutical and biotechnology companies - Year-over-year growth 2023-2028 (%)
        • 9.4 Academic and research institutes - Market size and forecast 2023-2028
          • Chart on Academic and research institutes - Market size and forecast 2023-2028 ($ million)
          • Data Table on Academic and research institutes - Market size and forecast 2023-2028 ($ million)
          • Chart on Academic and research institutes - Year-over-year growth 2023-2028 (%)
          • Data Table on Academic and research institutes - Year-over-year growth 2023-2028 (%)
        • 9.5 Others - Market size and forecast 2023-2028
          • Chart on Others - Market size and forecast 2023-2028 ($ million)
          • Data Table on Others - Market size and forecast 2023-2028 ($ million)
          • Chart on Others - Year-over-year growth 2023-2028 (%)
          • Data Table on Others - Year-over-year growth 2023-2028 (%)
        • 9.6 Market opportunity by End-user
          • Market opportunity by End-user ($ million)
          • Data Table on Market opportunity by End-user ($ million)

        10 Customer Landscape

        • 10.1 Customer landscape overview
          • Analysis of price sensitivity, lifecycle, customer purchase basket, adoption rates, and purchase criteria

        11 Geographic Landscape

        • 11.1 Geographic segmentation
          • Chart on Market share by geography 2023-2028 (%)
          • Data Table on Market share by geography 2023-2028 (%)
        • 11.2 Geographic comparison
          • Chart on Geographic comparison
          • Data Table on Geographic comparison
        • 11.3 North America - Market size and forecast 2023-2028
          • Chart on North America - Market size and forecast 2023-2028 ($ million)
          • Data Table on North America - Market size and forecast 2023-2028 ($ million)
          • Chart on North America - Year-over-year growth 2023-2028 (%)
          • Data Table on North America - Year-over-year growth 2023-2028 (%)
        • 11.4 Europe - Market size and forecast 2023-2028
          • Chart on Europe - Market size and forecast 2023-2028 ($ million)
          • Data Table on Europe - Market size and forecast 2023-2028 ($ million)
          • Chart on Europe - Year-over-year growth 2023-2028 (%)
          • Data Table on Europe - Year-over-year growth 2023-2028 (%)
        • 11.5 Asia - Market size and forecast 2023-2028
          • Chart on Asia - Market size and forecast 2023-2028 ($ million)
          • Data Table on Asia - Market size and forecast 2023-2028 ($ million)
          • Chart on Asia - Year-over-year growth 2023-2028 (%)
          • Data Table on Asia - Year-over-year growth 2023-2028 (%)
        • 11.6 Rest of World (ROW) - Market size and forecast 2023-2028
          • Chart on Rest of World (ROW) - Market size and forecast 2023-2028 ($ million)
          • Data Table on Rest of World (ROW) - Market size and forecast 2023-2028 ($ million)
          • Chart on Rest of World (ROW) - Year-over-year growth 2023-2028 (%)
          • Data Table on Rest of World (ROW) - Year-over-year growth 2023-2028 (%)
        • 11.7 US - Market size and forecast 2023-2028
          • Chart on US - Market size and forecast 2023-2028 ($ million)
          • Data Table on US - Market size and forecast 2023-2028 ($ million)
          • Chart on US - Year-over-year growth 2023-2028 (%)
          • Data Table on US - Year-over-year growth 2023-2028 (%)
        • 11.8 China - Market size and forecast 2023-2028
          • Chart on China - Market size and forecast 2023-2028 ($ million)
          • Data Table on China - Market size and forecast 2023-2028 ($ million)
          • Chart on China - Year-over-year growth 2023-2028 (%)
          • Data Table on China - Year-over-year growth 2023-2028 (%)
        • 11.9 Germany - Market size and forecast 2023-2028
          • Chart on Germany - Market size and forecast 2023-2028 ($ million)
          • Data Table on Germany - Market size and forecast 2023-2028 ($ million)
          • Chart on Germany - Year-over-year growth 2023-2028 (%)
          • Data Table on Germany - Year-over-year growth 2023-2028 (%)
        • 11.10 Japan - Market size and forecast 2023-2028
          • Chart on Japan - Market size and forecast 2023-2028 ($ million)
          • Data Table on Japan - Market size and forecast 2023-2028 ($ million)
          • Chart on Japan - Year-over-year growth 2023-2028 (%)
          • Data Table on Japan - Year-over-year growth 2023-2028 (%)
        • 11.11 UK - Market size and forecast 2023-2028
          • Chart on UK - Market size and forecast 2023-2028 ($ million)
          • Data Table on UK - Market size and forecast 2023-2028 ($ million)
          • Chart on UK - Year-over-year growth 2023-2028 (%)
          • Data Table on UK - Year-over-year growth 2023-2028 (%)
        • 11.12 India - Market size and forecast 2023-2028
          • Chart on India - Market size and forecast 2023-2028 ($ million)
          • Data Table on India - Market size and forecast 2023-2028 ($ million)
          • Chart on India - Year-over-year growth 2023-2028 (%)
          • Data Table on India - Year-over-year growth 2023-2028 (%)
        • 11.13 France - Market size and forecast 2023-2028
          • Chart on France - Market size and forecast 2023-2028 ($ million)
          • Data Table on France - Market size and forecast 2023-2028 ($ million)
          • Chart on France - Year-over-year growth 2023-2028 (%)
          • Data Table on France - Year-over-year growth 2023-2028 (%)
        • 11.14 Canada - Market size and forecast 2023-2028
          • Chart on Canada - Market size and forecast 2023-2028 ($ million)
          • Data Table on Canada - Market size and forecast 2023-2028 ($ million)
          • Chart on Canada - Year-over-year growth 2023-2028 (%)
          • Data Table on Canada - Year-over-year growth 2023-2028 (%)
        • 11.15 Brazil - Market size and forecast 2023-2028
          • Chart on Brazil - Market size and forecast 2023-2028 ($ million)
          • Data Table on Brazil - Market size and forecast 2023-2028 ($ million)
          • Chart on Brazil - Year-over-year growth 2023-2028 (%)
          • Data Table on Brazil - Year-over-year growth 2023-2028 (%)
        • 11.16 Australia - Market size and forecast 2023-2028
          • Chart on Australia - Market size and forecast 2023-2028 ($ million)
          • Data Table on Australia - Market size and forecast 2023-2028 ($ million)
          • Chart on Australia - Year-over-year growth 2023-2028 (%)
          • Data Table on Australia - Year-over-year growth 2023-2028 (%)
        • 11.17 Market opportunity by geography
          • Market opportunity by geography ($ million)
          • Data Tables on Market opportunity by geography ($ million)

        12 Drivers, Challenges, and Opportunity/Restraints

        • 12.1 Market drivers
          • 12.2 Market challenges
            • 12.3 Impact of drivers and challenges
              • Impact of drivers and challenges in 2023 and 2028
            • 12.4 Market opportunities/restraints

              13 Competitive Landscape

              • 13.1 Overview
                • 13.2 Competitive Landscape
                  • Overview on criticality of inputs and factors of differentiation
                • 13.3 Landscape disruption
                  • Overview on factors of disruption
                • 13.4 Industry risks
                  • Impact of key risks on business

                14 Competitive Analysis

                • 14.1 Companies profiled
                  • Companies covered
                • 14.2 Company ranking index
                  • Company ranking index
                • 14.3 Market positioning of companies
                  • Matrix on companies position and classification
                • 14.4 Agilent Technologies Inc.
                  • Agilent Technologies Inc. - Overview
                  • Agilent Technologies Inc. - Business segments
                  • Agilent Technologies Inc. - Key news
                  • Agilent Technologies Inc. - Key offerings
                  • Agilent Technologies Inc. - Segment focus
                  • SWOT
                • 14.5 Aspect Imaging Ltd.
                  • Aspect Imaging Ltd. - Overview
                  • Aspect Imaging Ltd. - Product / Service
                  • Aspect Imaging Ltd. - Key offerings
                  • SWOT
                • 14.6 Axion BioSystems Inc.
                  • Axion BioSystems Inc. - Overview
                  • Axion BioSystems Inc. - Product / Service
                  • Axion BioSystems Inc. - Key offerings
                  • SWOT
                • 14.7 Bruker Corp.
                  • Bruker Corp. - Overview
                  • Bruker Corp. - Business segments
                  • Bruker Corp. - Key news
                  • Bruker Corp. - Key offerings
                  • Bruker Corp. - Segment focus
                  • SWOT
                • 14.8 FUZIFILM Sonosite Inc.
                  • FUZIFILM Sonosite Inc. - Overview
                  • FUZIFILM Sonosite Inc. - Product / Service
                  • FUZIFILM Sonosite Inc. - Key offerings
                  • SWOT
                • 14.9 GE Healthcare Technologies Inc.
                  • GE Healthcare Technologies Inc. - Overview
                  • GE Healthcare Technologies Inc. - Business segments
                  • GE Healthcare Technologies Inc. - Key news
                  • GE Healthcare Technologies Inc. - Key offerings
                  • GE Healthcare Technologies Inc. - Segment focus
                  • SWOT
                • 14.10 Invicro. LLC
                  • Invicro. LLC - Overview
                  • Invicro. LLC - Product / Service
                  • Invicro. LLC - Key offerings
                  • SWOT
                • 14.11 LI COR Inc.
                  • LI COR Inc. - Overview
                  • LI COR Inc. - Product / Service
                  • LI COR Inc. - Key offerings
                  • SWOT
                • 14.12 Mediso Ltd.
                  • Mediso Ltd. - Overview
                  • Mediso Ltd. - Product / Service
                  • Mediso Ltd. - Key offerings
                  • SWOT
                • 14.13 Perkin Elmer Inc.
                  • Perkin Elmer Inc. - Overview
                  • Perkin Elmer Inc. - Business segments
                  • Perkin Elmer Inc. - Key news
                  • Perkin Elmer Inc. - Key offerings
                  • Perkin Elmer Inc. - Segment focus
                  • SWOT
                • 14.14 Scintica Instrumentation Inc
                  • Scintica Instrumentation Inc - Overview
                  • Scintica Instrumentation Inc - Product / Service
                  • Scintica Instrumentation Inc - Key offerings
                  • SWOT
                • 14.15 Siemens Healthineers AG
                  • Siemens Healthineers AG - Overview
                  • Siemens Healthineers AG - Business segments
                  • Siemens Healthineers AG - Key news
                  • Siemens Healthineers AG - Key offerings
                  • Siemens Healthineers AG - Segment focus
                  • SWOT
                • 14.16 Taconic Biosciences Inc.
                  • Taconic Biosciences Inc. - Overview
                  • Taconic Biosciences Inc. - Product / Service
                  • Taconic Biosciences Inc. - Key offerings
                  • SWOT
                • 14.17 Thermo Fisher Scientific Inc.
                  • Thermo Fisher Scientific Inc. - Overview
                  • Thermo Fisher Scientific Inc. - Business segments
                  • Thermo Fisher Scientific Inc. - Key news
                  • Thermo Fisher Scientific Inc. - Key offerings
                  • Thermo Fisher Scientific Inc. - Segment focus
                  • SWOT
                • 14.18 TriFoil Imaging
                  • TriFoil Imaging - Overview
                  • TriFoil Imaging - Product / Service
                  • TriFoil Imaging - Key offerings
                  • SWOT

                15 Appendix

                • 15.1 Scope of the report
                  • 15.2 Inclusions and exclusions checklist
                    • Inclusions checklist
                    • Exclusions checklist
                  • 15.3 Currency conversion rates for US$
                    • Currency conversion rates for US$
                  • 15.4 Research methodology
                    • Research methodology
                  • 15.5 Data procurement
                    • Information sources
                  • 15.6 Data validation
                    • Data validation
                  • 15.7 Validation techniques employed for market sizing
                    • Validation techniques employed for market sizing
                  • 15.8 Data synthesis
                    • Data synthesis
                  • 15.9 360 degree market analysis
                    • 360 degree market analysis
                  • 15.10 List of abbreviations
                    • List of abbreviations

                  Research Methodology

                  Technavio presents a detailed picture of the market by way of study, synthesis, and summation of data from multiple sources. The analysts have presented the various facets of the market with a particular focus on identifying the key industry influencers. The data thus presented is comprehensive, reliable, and the result of extensive research, both primary and secondary.

                  INFORMATION SOURCES

                  Primary sources

                  • Manufacturers and suppliers
                  • Channel partners
                  • Industry experts
                  • Strategic decision makers

                  Secondary sources

                  • Industry journals and periodicals
                  • Government data
                  • Financial reports of key industry players
                  • Historical data
                  • Press releases

                  DATA ANALYSIS

                  Data Synthesis

                  • Collation of data
                  • Estimation of key figures
                  • Analysis of derived insights

                  Data Validation

                  • Triangulation with data models
                  • Reference against proprietary databases
                  • Corroboration with industry experts

                  REPORT WRITING

                  Qualitative

                  • Market drivers
                  • Market challenges
                  • Market trends
                  • Five forces analysis

                  Quantitative

                  • Market size and forecast
                  • Market segmentation
                  • Geographical insights
                  • Competitive landscape

                  Interested in this report?

                  Get your sample now to see our research methodology and insights!

                  Download Now

                  Frequently Asked Questions

                  Preclinical Animal Imaging market growth will increase by $ 1169.8 mn during 2024-2028 .

                  The Preclinical Animal Imaging market is expected to grow at a CAGR of 5.3% during 2024-2028 .

                  Preclinical Animal Imaging market is segmented by Product Type( Instrument, Reagent, Software) End-user( Pharmaceutical and biotechnology companies, Academic and research institutes, Others)

                  Agilent Technologies Inc., Aspect Imaging Ltd., Axion BioSystems Inc., Berthold Technologies GmbH and Co.KG, Bruker Corp., Cubresa Inc., FUZIFILM Sonosite Inc., GE Healthcare Technologies Inc., Invicro. LLC, LI COR Inc., Mediso Ltd., MILabs BV, Perkin Elmer Inc., Scintica Instrumentation Inc, Siemens Healthineers AG, Taconic Biosciences Inc., Thermo Fisher Scientific Inc., TriFoil Imaging, Vieworks Co Ltd are a few of the key vendors in the Preclinical Animal Imaging market.

                  North America will register the highest growth rate of 34% among the other regions. Therefore, the Preclinical Animal Imaging market in North America is expected to garner significant business opportunities for the vendors during the forecast period.

                  US, China, Germany, Japan, UK

                  • Government initiatives in veterinary servicesThe global preclinical animal imaging market is poised for significant growth is the driving factor this market.
                  • driven by substantial government initiatives in veterinary services. A notable example is the state of Uttar Pradesh is the driving factor this market.
                  • India is the driving factor this market.
                  • which announced a substantial investment of nearly $480 million in April 2024 for the protection is the driving factor this market.
                  • treatment is the driving factor this market.
                  • and service of animals. This initiative underscores the increasing recognition of animal welfare and the critical role of veterinary services in ensuring it.The Department of Animal Husbandry is the driving factor this market.
                  • Dairy is the driving factor this market.
                  • and Fisheries in Uttar Pradesh has outlined an annual plan with a proposed budget of $420 million. This comprehensive plan includes detailed allocations for various aspects of veterinary services is the driving factor this market.
                  • such as education is the driving factor this market.
                  • hospitals is the driving factor this market.
                  • polyclinics is the driving factor this market.
                  • and service centers. Specifically is the driving factor this market.
                  • $56 million is earmarked for veterinary hospitals is the driving factor this market.
                  • polyclinics is the driving factor this market.
                  • and service centers is the driving factor this market.
                  • dedicated to establishing new veterinary hospitals is the driving factor this market.
                  • $0.71 million for veterinary polyclinics is the driving factor this market.
                  • and $40 million for veterinary service centers. Additionally is the driving factor this market.
                  • $70 million is allocated to cover various expenses related to veterinary hospitals is the driving factor this market.
                  • service centers is the driving factor this market.
                  • research is the driving factor this market.
                  • and diagnostic services.These government initiatives are expected to drive the demand for advanced preclinical animal imaging technologies. Enhanced funding and infrastructure development in veterinary services will likely lead to increased adoption of sophisticated imaging tools is the driving factor this market.
                  • facilitating better diagnosis is the driving factor this market.
                  • treatment is the driving factor this market.
                  • and research outcomes. As governments worldwide recognize the importance of animal health and welfare is the driving factor this market.
                  • similar investments are anticipated is the driving factor this market.
                  • further propelling the growth of the global preclinical animal imaging market. Thus is the driving factor this market.
                  • the increasing government initiatives in veterinary services will continue to drive the growth of the market in focus during the forecast period. is the driving factor this market.

                  The Preclinical Animal Imaging market vendors should focus on grabbing business opportunities from the Instrument segment as it accounted for the largest market share in the base year.