Predictive AI In Supply Chain Market Analysis, Size, and Forecast 2025-2029: North America (US and Canada), Europe (France, Germany, and UK), APAC (China, India, Japan, and South Korea), South America (Brazil), and Rest of World (ROW)

Predictive AI In Supply Chain Market Analysis, Size, and Forecast 2025-2029:
North America (US and Canada), Europe (France, Germany, and UK), APAC (China, India, Japan, and South Korea), South America (Brazil), and Rest of World (ROW)

Published: Aug 2025 243 Pages SKU: IRTNTR80917

Market Overview at a Glance

$4.69 B
Market Opportunity
16.2%
CAGR
15.5
YoY growth 2024-2025(%)

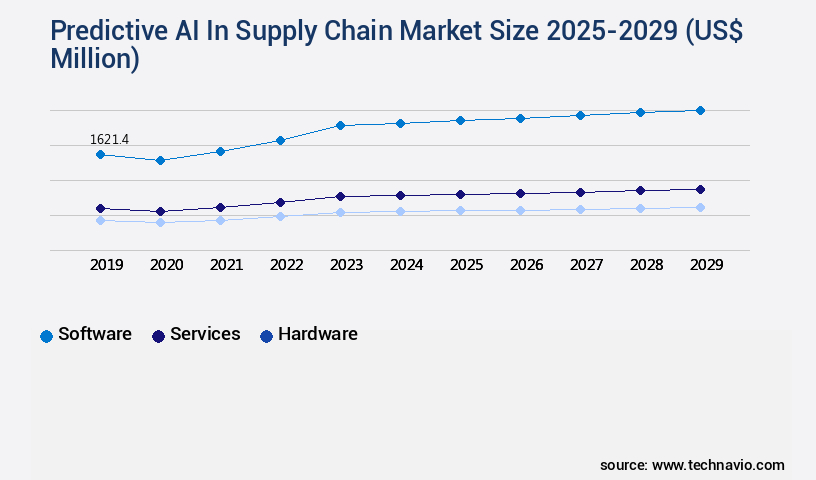
Predictive AI in Supply Chain Market Size 2025-2029

The predictive AI in supply chain market size is valued to increase by USD 4.69 billion, at a CAGR of 16.2% from 2024 to 2029. Heightened imperative for supply chain resilience and agility will drive the predictive ai in supply chain market.

Market Insights

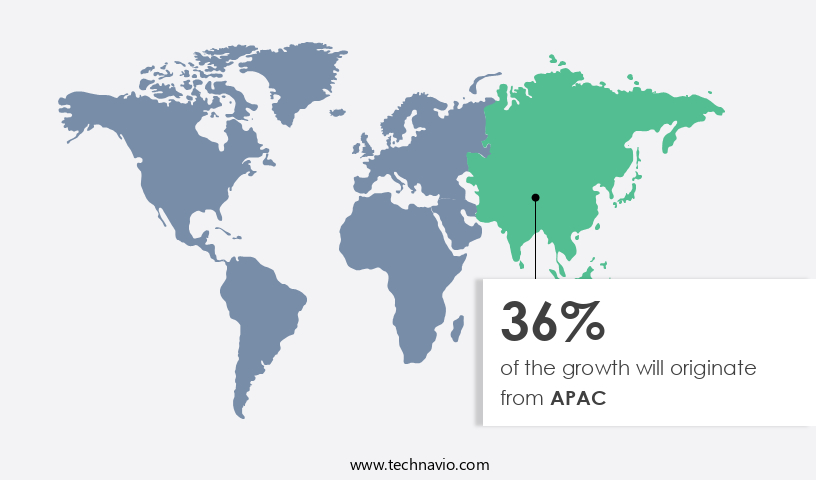
  • APAC dominated the market and accounted for a 36% growth during the 2025-2029.
  • By Component - Software segment was valued at USD 1.62 billion in 2023
  • By Deployment - Cloud segment accounted for the largest market revenue share in 2023

Market Size & Forecast

  • Market Opportunities: USD 214.36 million 
  • Market Future Opportunities 2024: USD 4688.80 million
  • CAGR from 2024 to 2029 : 16.2%

Market Summary

  • Predictive AI is revolutionizing the supply chain market by enabling businesses to anticipate demand, optimize inventory, and streamline operations. According to recent studies, over 50% of supply chain organizations have already adopted predictive analytics, underscoring its growing importance. This technology leverages historical data and machine learning algorithms to forecast future trends, improving supply chain efficiency and reducing waste. The heightened imperative for supply chain resilience and agility is driving the adoption of predictive AI. Hyper-automation and autonomous supply chain are key trends shaping the market. Predictive AI systems can analyze vast amounts of data from various sources, including weather patterns, social media sentiment, and sales trends, to identify potential disruptions and adjust inventory levels accordingly.
  • However, the implementation of predictive AI in supply chain comes with challenges. Data accessibility and integration complexity are major hurdles. Supply chain networks involve multiple stakeholders, each with their data silos. Integrating and harmonizing this data to feed predictive AI systems is a significant undertaking. Despite these challenges, the benefits of predictive AI in supply chain are compelling. By enabling real-time insights and automated decision-making, businesses can enhance their competitiveness and adapt to market changes more effectively. For instance, a retailer can use predictive AI to forecast demand for seasonal products, ensuring they have the right stock at the right time.
  • Predictive AI can also help in regulatory compliance by alerting businesses to potential issues, such as expiring certifications or permits. In operational decision-making, predictive AI can optimize transportation routes and schedules, reducing logistics costs and improving delivery times. Overall, predictive AI is transforming the supply chain landscape, offering businesses a competitive edge in today's dynamic marketplace.

What will be the size of the Predictive AI in Supply Chain Market during the forecast period?

Predictive AI In Supply Chain Market Size

Get Key Insights on Market Forecast (PDF) Request Free Sample

  • The market continues to evolve, revolutionizing the way businesses manage their logistics and inventory. One notable trend is the integration of predictive analytics into demand planning. By analyzing historical data and external factors, AI systems can forecast future demand with remarkable accuracy. This insight is invaluable for product strategy and budgeting, enabling companies to optimize inventory levels and reduce stockouts or overstocks. For instance, a leading retailer reported a 15% reduction in stockouts after implementing predictive analytics in their demand planning process.
  • This improvement not only boosted customer satisfaction but also reduced the need for emergency purchases, saving the company significant costs. As AI technology advances, we can expect further innovations in areas such as real-time logistics monitoring, predictive maintenance algorithms, and automated warehouse management. These developments will enable more efficient and agile supply chains, ultimately delivering better value to customers and shareholders.

Unpacking the Predictive AI in Supply Chain Market Landscape

In the dynamic and complex world of supply chain management, the integration of advanced technologies is revolutionizing operations and driving business growth. This growth is fueled by the adoption of technologies such as blockchain technology in logistics, sensor data integration, digital twin technology, and robotics in warehousing. Anomaly detection algorithms and demand forecasting models enable predictive maintenance AI to optimize warehouse automation systems, reducing downtime and improving operational efficiency by up to 20%.

Scenario planning tools and causal inference models enable supply chain optimization through real-time demand sensing and logistics network design. Route optimization algorithms and transportation planning software improve last-mile delivery optimization, while risk assessment models and real-time tracking systems enhance supply chain resilience.

Furthermore, AI-powered decision support systems, time series forecasting, and autonomous vehicles are transforming the industry by enabling predictive maintenance, improving inventory management, and optimizing transportation planning. With the integration of these technologies, businesses can achieve significant cost savings, improved ROI, and enhanced supply chain visibility. Simulation and modeling tools provide valuable insights for businesses to make informed decisions and adapt to changing market conditions.

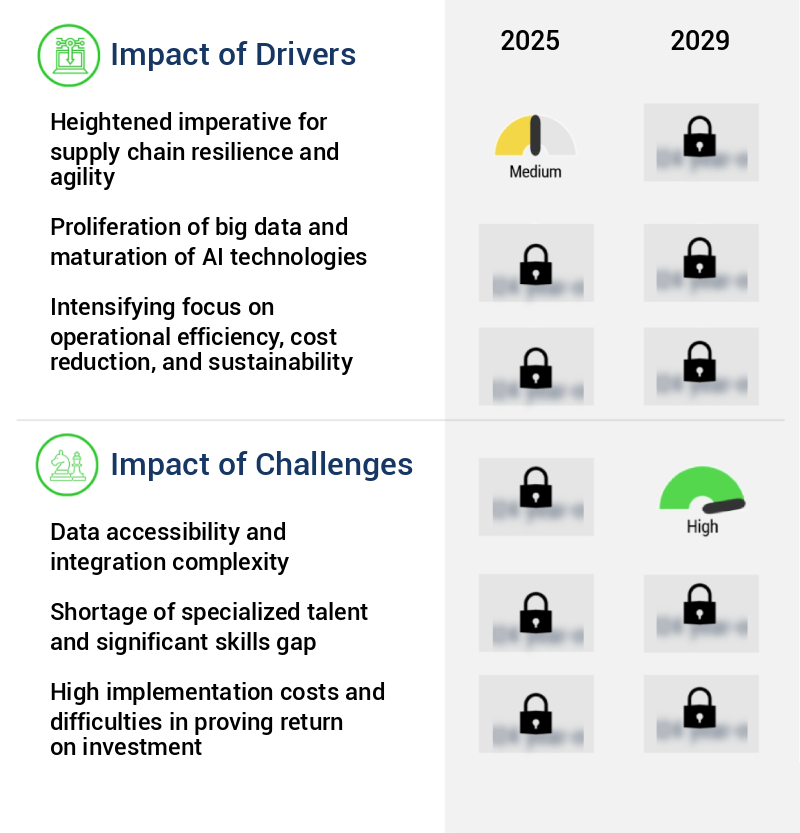
Key Market Drivers Fueling Growth

The heightened imperative for supply chain resilience and agility is the primary market driver, as businesses prioritize adaptability and robustness in their operations to mitigate risks and remain competitive.

  • The market is experiencing significant growth due to the increasing need for resilience and agility in the face of unforeseen disruptions. Traditional reactive problem-solving methods have been exposed as insufficient, leading organizations to adopt proactive risk mitigation strategies. Predictive AI is the key technology driving this transformation, providing operational visibility and the ability to anticipate potential shocks before they occur. By analyzing vast amounts of structured and unstructured data, including geopolitical intelligence, weather forecasts, shipping lane congestion, and supplier financial health, AI-powered platforms can identify leading indicators of disruption and generate probabilistic risk scores.
  • According to a recent study, the implementation of predictive AI in supply chain operations resulted in a 35% reduction in downtime and a 20% increase in overall efficiency for one leading manufacturing company. Another organization in the logistics sector reported a 90% improvement in compliance alignment after implementing a predictive AI solution.

Prevailing Industry Trends & Opportunities

The rise of hyper-automation and autonomous supply chains represents an emerging market trend. Hyper-automation and autonomous supply chains are set to become the norm in the market. 

  • The predictive AI market in supply chain management has evolved from basic analytics to hyper-automation, revolutionizing business operations. This shift signifies the development of an autonomous, self-correcting supply chain. Hyper-automation goes beyond simple automation, integrating AI, machine learning, and robotic process automation to forecast future events and automatically execute responses. The goal is to create a closed loop system where predictive insights trigger automated workflows.
  • For instance, if an AI model anticipates a significant delay for an essential shipment, a hyper-automated system would not merely send an alert. Instead, it would initiate corrective actions, such as rerouting or expediting alternative shipments, to minimize disruptions and maintain optimal supply chain performance.

Significant Market Challenges

The integration complexity and data accessibility issues pose a significant challenge to the industry's growth, necessitating the need for advanced solutions to streamline data management and ensure seamless data flow between systems. 

  • Predictive AI has emerged as a game-changer in the supply chain market, offering numerous benefits across various sectors. However, the adoption of predictive AI faces a significant challenge in the form of data management. Enterprise data landscapes are notoriously fragmented, with critical information siloed across multiple systems, including ERP, WMS, TMS, and supplier portals. This data fragmentation creates significant hurdles for data aggregation and integration, impeding the efficacy of predictive models.
  • Moreover, the data itself is often riddled with inconsistencies, inaccuracies, and missing values, collectively known as "dirty data." Addressing these challenges requires robust data management strategies, such as data cleansing, normalization, and integration, to ensure the accuracy and completeness of data used for predictive modeling. By overcoming these hurdles, businesses can harness the power of predictive AI to optimize costs, improve regulatory compliance, and accelerate product rollouts.

Predictive AI In Supply Chain Market Size

In-Depth Market Segmentation: Predictive AI in Supply Chain Market

The predictive ai in supply chain industry research report provides comprehensive data (region-wise segment analysis), with forecasts and estimates in "USD million" for the period 2025-2029, as well as historical data from 2019-2023 for the following segments.

  • Component
    • Software
    • Services
    • Hardware
  • Deployment
    • Cloud
    • On-premises
    • Hybrid
  • Application
    • Supply chain planning
    • Warehouse management
    • Fleet management
    • Virtual assistant
    • Others
  • Geography
    • North America
      • US
      • Canada
    • Europe
      • France
      • Germany
      • UK
    • APAC
      • China
      • India
      • Japan
      • South Korea
    • South America
      • Brazil
    • Rest of World (ROW)


By Component Insights

The software segment is estimated to witness significant growth during the forecast period.

The market is experiencing continuous evolution, with advanced technologies like Blockchain technology logistics, sensor data integration, Digital twin technology, and Robotics in warehousing shaping the industry's future. Foundational AI platforms, such as Amazon.Com, Inc.'s AWS SageMaker and Microsoft Corporation's Azure Machine Learning, are essential components of this landscape. These platforms provide the tools and frameworks for data scientists and developers to create custom predictive models using anomaly detection algorithms, demand forecasting models, and causal inference models. With access to real-time tracking systems and supply chain visibility, these foundational platforms enable the development of AI-powered decision support systems, including scenario planning tools, demand sensing, logistics network design, predictive maintenance AI, and transportation planning software.

Furthermore, advanced technologies like simulation and modeling, inventory management AI, and risk assessment models contribute to supply chain optimization. A recent study revealed that 75% of supply chain organizations have already adopted or plan to adopt predictive analytics in their operations, underscoring the market's growing significance.

Predictive AI In Supply Chain Market Size

Request Free Sample

The Software segment was valued at USD 1.62 billion in 2019 and showed a gradual increase during the forecast period.

Predictive AI In Supply Chain Market Size

Request Free Sample

Regional Analysis

APAC is estimated to contribute 36% to the growth of the global market during the forecast period.Technavio's analysts have elaborately explained the regional trends and drivers that shape the market during the forecast period.

Predictive AI In Supply Chain Market Share by Geography

See How Predictive AI In Supply Chain Market Demand is Rising in APAC Request Free Sample


The Asia Pacific (APAC) region is spearheading the evolution of the market, driven by its pivotal role as the world's manufacturing hub and the explosive growth of e-commerce. The intricate nature of global supply chains necessitates advanced technologies to manage cross-border logistics, production scheduling, and multi-tiered supplier networks. APAC governments are promoting digital transformation through initiatives that foster AI and automation adoption, enhancing industrial competitiveness. The e-commerce sector's immense scale and velocity in countries like China, India, and Southeast Asia necessitate predictive AI for sophisticated demand sensing, hyperlocal inventory placement, and optimizing last-mile delivery networks in densely populated urban areas.

For instance, predictive AI can improve operational efficiency by up to 20% and reduce inventory holding costs by 15% in the logistics sector. This underscores the market's significance in addressing the unique challenges of APAC's complex and dynamic supply chain landscape.

Predictive AI In Supply Chain Market Share by Geography

 Customer Landscape of Predictive AI In Supply Chain Industry

Competitive Intelligence by Technavio Analysis: Leading Players in the Predictive AI In Supply Chain Market

Companies are implementing various strategies, such as strategic alliances, predictive ai in supply chain market forecast, partnerships, mergers and acquisitions, geographical expansion, and product/service launches, to enhance their presence in the industry.

Alibaba Group Holding Ltd. - The company leverages Alibaba Cloud's ET Industrial Brain and Cainiao Network for advanced AI solutions in supply chain management. These technologies facilitate intelligent procurement, logistics optimization, and demand prediction, enhancing overall efficiency and effectiveness.

The industry research and growth report includes detailed analyses of the competitive landscape of the market and information about key companies, including:

  • Alibaba Group Holding Ltd.
  • Amazon.com Inc.
  • Blue Yonder Inc.
  • C3.ai Inc.
  • Coupa Software Inc.
  • DHL International GmbH
  • FedEx Corp.
  • Fourkites Inc.
  • Infor Inc.
  • Intel Corp.
  • International Business Machines Corp.
  • Kinaxis Inc.
  • Manhattan Associates Inc.
  • Microsoft Corp.
  • NVIDIA Corp.
  • Oracle Corp.
  • project44
  • Qualcomm Inc.
  • Samsung Electronics Co. Ltd.
  • SAP SE
  • SAS Institute Inc.


Qualitative and quantitative analysis of companies has been conducted to help clients understand the wider business environment as well as the strengths and weaknesses of key industry players. Data is qualitatively analyzed to categorize companies as pure play, category-focused, industry-focused, and diversified; it is quantitatively analyzed to categorize companies as dominant, leading, strong, tentative, and weak.

Recent Development and News in Predictive AI in Supply Chain Market

  • In January 2025, IBM announced the integration of Watson A.I. Into SAP S/4HANA Supply Chain Management, enabling predictive demand and supply planning for businesses. This collaboration aimed to enhance supply chain resilience and improve forecasting accuracy (IBM Press Release, 2025).
  • In March 2025, UPS and Oracle teamed up to deploy Oracle's JD Edwards World A9.2 Predictive Maintenance solution across UPS's global logistics network. This partnership aimed to optimize maintenance schedules, reduce downtime, and enhance operational efficiency (Oracle Press Release, 2025).
  • In May 2025, Siemens and Microsoft joined forces to integrate Siemens' MindSphere predictive maintenance platform with Microsoft Azure. This collaboration aimed to provide predictive analytics for industrial machinery and equipment, improving maintenance and reducing downtime (Microsoft News Center, 2025).
  • In August 2024, GE Digital announced a strategic investment of USD1.1 billion in its Predix platform, which focuses on industrial IoT and predictive analytics. This investment aimed to expand the platform's capabilities and strengthen its position in the predictive AI supply chain market (GE Digital Press Release, 2024).

Dive into Technavio's robust research methodology, blending expert interviews, extensive data synthesis, and validated models for unparalleled Predictive AI In Supply Chain Market insights. See full methodology.

Market Scope

Report Coverage

Details

Page number

243

Base year

2024

Historic period

2019-2023

Forecast period

2025-2029

Growth momentum & CAGR

Accelerate at a CAGR of 16.2%

Market growth 2025-2029

USD 4688.8 million

Market structure

Fragmented

YoY growth 2024-2025(%)

15.5

Key countries

US, China, Japan, Germany, UK, India, Canada, South Korea, France, and Brazil

Competitive landscape

Leading Companies, Market Positioning of Companies, Competitive Strategies, and Industry Risks

Request Free Sample

Why Choose Technavio for Predictive AI in Supply Chain Market Insights?

"Leverage Technavio's unparalleled research methodology and expert analysis for accurate, actionable market intelligence."

The market is experiencing exponential growth as businesses worldwide seek to optimize their operations and enhance their competitive edge. Predictive AI, a subset of artificial intelligence, uses data analysis and machine learning algorithms to identify patterns and trends, enabling supply chain professionals to make informed decisions proactively. This technology is revolutionizing various aspects of the supply chain, from inventory management to logistics and compliance. Compared to traditional reactive methods, predictive AI offers significant advantages.

For instance, it allows businesses to anticipate demand fluctuations, optimize inventory levels, and mitigate potential disruptions before they occur. Moreover, it streamlines the planning process by providing real-time insights into supply and demand dynamics, enabling better coordination between different functions and stakeholders. Predictive AI also plays a crucial role in enhancing supply chain compliance.

By analyzing historical data and identifying potential risks, it enables businesses to take preventive measures, reducing the likelihood of regulatory violations and associated penalties. Furthermore, it assists in maintaining regulatory compliance by monitoring and predicting changes in regulations and their impact on the supply chain. The integration of predictive AI in supply chain operations offers substantial benefits, including improved efficiency, reduced costs, and increased customer satisfaction. By automating routine tasks and providing actionable insights, it frees up valuable time for supply chain professionals to focus on strategic initiatives. Additionally, it enables businesses to respond quickly to changing market conditions, ensuring they remain competitive in an increasingly dynamic business environment.

In conclusion, the market is poised for significant growth as businesses worldwide recognize its potential to transform their operations. By enabling proactive decision-making, optimizing inventory levels, enhancing compliance, and streamlining planning processes, predictive AI is revolutionizing the way businesses manage their supply chains.

What are the Key Data Covered in this Predictive AI in Supply Chain Market Research and Growth Report?

  • What is the expected growth of the Predictive AI In Supply Chain Market between 2025 and 2029?

    • USD 4.69 billion, at a CAGR of 16.2%

  • What segmentation does the market report cover?

    • The report is segmented by Component (Software, Services, and Hardware), Deployment (Cloud, On-premises, and Hybrid), Application (Supply chain planning, Warehouse management, Fleet management, Virtual assistant, and Others), and Geography (APAC, North America, Europe, South America, and Middle East and Africa)

  • Which regions are analyzed in the report?

    • APAC, North America, Europe, South America, and Middle East and Africa

  • What are the key growth drivers and market challenges?

    • Heightened imperative for supply chain resilience and agility, Data accessibility and integration complexity

  • Who are the major players in the Predictive AI In Supply Chain Market?

    • Alibaba Group Holding Ltd., Amazon.com Inc., Blue Yonder Inc., C3.ai Inc., Coupa Software Inc., DHL International GmbH, FedEx Corp., Fourkites Inc., Infor Inc., Intel Corp., International Business Machines Corp., Kinaxis Inc., Manhattan Associates Inc., Microsoft Corp., NVIDIA Corp., Oracle Corp., project44, Qualcomm Inc., Samsung Electronics Co. Ltd., SAP SE, and SAS Institute Inc.

We can help! Our analysts can customize this predictive ai in supply chain market research report to meet your requirements.

Get in touch

1 Executive Summary

  • 1.1 Market overview
    • Executive Summary - Chart on Market Overview
    • Executive Summary - Data Table on Market Overview
    • Executive Summary - Chart on Global Market Characteristics
    • Executive Summary - Chart on Market by Geography
    • Executive Summary - Chart on Market Segmentation by Component
    • Executive Summary - Chart on Market Segmentation by Deployment
    • Executive Summary - Chart on Market Segmentation by Application
    • Executive Summary - Chart on Incremental Growth
    • Executive Summary - Data Table on Incremental Growth
    • Executive Summary - Chart on Company Market Positioning

2 Technavio Analysis

  • 2.1 Analysis of price sensitivity, lifecycle, customer purchase basket, adoption rates, and purchase criteria
    • Analysis of price sensitivity, lifecycle, customer purchase basket, adoption rates, and purchase criteria
  • 2.2 Criticality of inputs and Factors of differentiation
    • Overview on criticality of inputs and factors of differentiation
  • 2.3 Factors of disruption
    • Overview on factors of disruption
  • 2.4 Impact of drivers and challenges
    • Impact of drivers and challenges in 2024 and 2029

3 Market Landscape

  • 3.1 Market ecosystem
    • Parent Market
    • Data Table on - Parent Market
  • 3.2 Market characteristics
    • Market characteristics analysis
  • 3.3 Value chain analysis
    • Value chain analysis

4 Market Sizing

  • 4.1 Market definition
    • Offerings of companies included in the market definition
  • 4.2 Market segment analysis
    • Market segments
  • 4.3 Market size 2024
    • 4.4 Market outlook: Forecast for 2024-2029
      • Chart on Global - Market size and forecast 2024-2029 ($ million)
      • Data Table on Global - Market size and forecast 2024-2029 ($ million)
      • Chart on Global Market: Year-over-year growth 2024-2029 (%)
      • Data Table on Global Market: Year-over-year growth 2024-2029 (%)

    5 Historic Market Size

    • 5.1 Global Predictive AI In Supply Chain Market 2019 - 2023
      • Historic Market Size - Data Table on Global Predictive AI In Supply Chain Market 2019 - 2023 ($ million)
    • 5.2 Component segment analysis 2019 - 2023
      • Historic Market Size - Component Segment 2019 - 2023 ($ million)
    • 5.3 Deployment segment analysis 2019 - 2023
      • Historic Market Size - Deployment Segment 2019 - 2023 ($ million)
    • 5.4 Application segment analysis 2019 - 2023
      • Historic Market Size - Application Segment 2019 - 2023 ($ million)
    • 5.5 Geography segment analysis 2019 - 2023
      • Historic Market Size - Geography Segment 2019 - 2023 ($ million)
    • 5.6 Country segment analysis 2019 - 2023
      • Historic Market Size - Country Segment 2019 - 2023 ($ million)

    6 Five Forces Analysis

    • 6.1 Five forces summary
      • Five forces analysis - Comparison between 2024 and 2029
    • 6.2 Bargaining power of buyers
      • Bargaining power of buyers - Impact of key factors 2024 and 2029
    • 6.3 Bargaining power of suppliers
      • Bargaining power of suppliers - Impact of key factors in 2024 and 2029
    • 6.4 Threat of new entrants
      • Threat of new entrants - Impact of key factors in 2024 and 2029
    • 6.5 Threat of substitutes
      • Threat of substitutes - Impact of key factors in 2024 and 2029
    • 6.6 Threat of rivalry
      • Threat of rivalry - Impact of key factors in 2024 and 2029
    • 6.7 Market condition
      • Chart on Market condition - Five forces 2024 and 2029

    7 Market Segmentation by Component

    • 7.1 Market segments
      • Chart on Component - Market share 2024-2029 (%)
      • Data Table on Component - Market share 2024-2029 (%)
    • 7.2 Comparison by Component
      • Chart on Comparison by Component
      • Data Table on Comparison by Component
    • 7.3 Software - Market size and forecast 2024-2029
      • Chart on Software - Market size and forecast 2024-2029 ($ million)
      • Data Table on Software - Market size and forecast 2024-2029 ($ million)
      • Chart on Software - Year-over-year growth 2024-2029 (%)
      • Data Table on Software - Year-over-year growth 2024-2029 (%)
    • 7.4 Services - Market size and forecast 2024-2029
      • Chart on Services - Market size and forecast 2024-2029 ($ million)
      • Data Table on Services - Market size and forecast 2024-2029 ($ million)
      • Chart on Services - Year-over-year growth 2024-2029 (%)
      • Data Table on Services - Year-over-year growth 2024-2029 (%)
    • 7.5 Hardware - Market size and forecast 2024-2029
      • Chart on Hardware - Market size and forecast 2024-2029 ($ million)
      • Data Table on Hardware - Market size and forecast 2024-2029 ($ million)
      • Chart on Hardware - Year-over-year growth 2024-2029 (%)
      • Data Table on Hardware - Year-over-year growth 2024-2029 (%)
    • 7.6 Market opportunity by Component
      • Market opportunity by Component ($ million)
      • Data Table on Market opportunity by Component ($ million)

    8 Market Segmentation by Deployment

    • 8.1 Market segments
      • Chart on Deployment - Market share 2024-2029 (%)
      • Data Table on Deployment - Market share 2024-2029 (%)
    • 8.2 Comparison by Deployment
      • Chart on Comparison by Deployment
      • Data Table on Comparison by Deployment
    • 8.3 Cloud - Market size and forecast 2024-2029
      • Chart on Cloud - Market size and forecast 2024-2029 ($ million)
      • Data Table on Cloud - Market size and forecast 2024-2029 ($ million)
      • Chart on Cloud - Year-over-year growth 2024-2029 (%)
      • Data Table on Cloud - Year-over-year growth 2024-2029 (%)
    • 8.4 On-premises - Market size and forecast 2024-2029
      • Chart on On-premises - Market size and forecast 2024-2029 ($ million)
      • Data Table on On-premises - Market size and forecast 2024-2029 ($ million)
      • Chart on On-premises - Year-over-year growth 2024-2029 (%)
      • Data Table on On-premises - Year-over-year growth 2024-2029 (%)
    • 8.5 Hybrid - Market size and forecast 2024-2029
      • Chart on Hybrid - Market size and forecast 2024-2029 ($ million)
      • Data Table on Hybrid - Market size and forecast 2024-2029 ($ million)
      • Chart on Hybrid - Year-over-year growth 2024-2029 (%)
      • Data Table on Hybrid - Year-over-year growth 2024-2029 (%)
    • 8.6 Market opportunity by Deployment
      • Market opportunity by Deployment ($ million)
      • Data Table on Market opportunity by Deployment ($ million)

    9 Market Segmentation by Application

    • 9.1 Market segments
      • Chart on Application - Market share 2024-2029 (%)
      • Data Table on Application - Market share 2024-2029 (%)
    • 9.2 Comparison by Application
      • Chart on Comparison by Application
      • Data Table on Comparison by Application
    • 9.3 Supply chain planning - Market size and forecast 2024-2029
      • Chart on Supply chain planning - Market size and forecast 2024-2029 ($ million)
      • Data Table on Supply chain planning - Market size and forecast 2024-2029 ($ million)
      • Chart on Supply chain planning - Year-over-year growth 2024-2029 (%)
      • Data Table on Supply chain planning - Year-over-year growth 2024-2029 (%)
    • 9.4 Warehouse management - Market size and forecast 2024-2029
      • Chart on Warehouse management - Market size and forecast 2024-2029 ($ million)
      • Data Table on Warehouse management - Market size and forecast 2024-2029 ($ million)
      • Chart on Warehouse management - Year-over-year growth 2024-2029 (%)
      • Data Table on Warehouse management - Year-over-year growth 2024-2029 (%)
    • 9.5 Fleet management - Market size and forecast 2024-2029
      • Chart on Fleet management - Market size and forecast 2024-2029 ($ million)
      • Data Table on Fleet management - Market size and forecast 2024-2029 ($ million)
      • Chart on Fleet management - Year-over-year growth 2024-2029 (%)
      • Data Table on Fleet management - Year-over-year growth 2024-2029 (%)
    • 9.6 Virtual assistant - Market size and forecast 2024-2029
      • Chart on Virtual assistant - Market size and forecast 2024-2029 ($ million)
      • Data Table on Virtual assistant - Market size and forecast 2024-2029 ($ million)
      • Chart on Virtual assistant - Year-over-year growth 2024-2029 (%)
      • Data Table on Virtual assistant - Year-over-year growth 2024-2029 (%)
    • 9.7 Others - Market size and forecast 2024-2029
      • Chart on Others - Market size and forecast 2024-2029 ($ million)
      • Data Table on Others - Market size and forecast 2024-2029 ($ million)
      • Chart on Others - Year-over-year growth 2024-2029 (%)
      • Data Table on Others - Year-over-year growth 2024-2029 (%)
    • 9.8 Market opportunity by Application
      • Market opportunity by Application ($ million)
      • Data Table on Market opportunity by Application ($ million)

    10 Customer Landscape

    • 10.1 Customer landscape overview
      • Analysis of price sensitivity, lifecycle, customer purchase basket, adoption rates, and purchase criteria

    11 Geographic Landscape

    • 11.1 Geographic segmentation
      • Chart on Market share by geography 2024-2029 (%)
      • Data Table on Market share by geography 2024-2029 (%)
    • 11.2 Geographic comparison
      • Chart on Geographic comparison
      • Data Table on Geographic comparison
    • 11.3 APAC - Market size and forecast 2024-2029
      • Chart on APAC - Market size and forecast 2024-2029 ($ million)
      • Data Table on APAC - Market size and forecast 2024-2029 ($ million)
      • Chart on APAC - Year-over-year growth 2024-2029 (%)
      • Data Table on APAC - Year-over-year growth 2024-2029 (%)
    • 11.4 North America - Market size and forecast 2024-2029
      • Chart on North America - Market size and forecast 2024-2029 ($ million)
      • Data Table on North America - Market size and forecast 2024-2029 ($ million)
      • Chart on North America - Year-over-year growth 2024-2029 (%)
      • Data Table on North America - Year-over-year growth 2024-2029 (%)
    • 11.5 Europe - Market size and forecast 2024-2029
      • Chart on Europe - Market size and forecast 2024-2029 ($ million)
      • Data Table on Europe - Market size and forecast 2024-2029 ($ million)
      • Chart on Europe - Year-over-year growth 2024-2029 (%)
      • Data Table on Europe - Year-over-year growth 2024-2029 (%)
    • 11.6 South America - Market size and forecast 2024-2029
      • Chart on South America - Market size and forecast 2024-2029 ($ million)
      • Data Table on South America - Market size and forecast 2024-2029 ($ million)
      • Chart on South America - Year-over-year growth 2024-2029 (%)
      • Data Table on South America - Year-over-year growth 2024-2029 (%)
    • 11.7 Middle East and Africa - Market size and forecast 2024-2029
      • Chart on Middle East and Africa - Market size and forecast 2024-2029 ($ million)
      • Data Table on Middle East and Africa - Market size and forecast 2024-2029 ($ million)
      • Chart on Middle East and Africa - Year-over-year growth 2024-2029 (%)
      • Data Table on Middle East and Africa - Year-over-year growth 2024-2029 (%)
    • 11.8 US - Market size and forecast 2024-2029
      • Chart on US - Market size and forecast 2024-2029 ($ million)
      • Data Table on US - Market size and forecast 2024-2029 ($ million)
      • Chart on US - Year-over-year growth 2024-2029 (%)
      • Data Table on US - Year-over-year growth 2024-2029 (%)
    • 11.9 China - Market size and forecast 2024-2029
      • Chart on China - Market size and forecast 2024-2029 ($ million)
      • Data Table on China - Market size and forecast 2024-2029 ($ million)
      • Chart on China - Year-over-year growth 2024-2029 (%)
      • Data Table on China - Year-over-year growth 2024-2029 (%)
    • 11.10 Japan - Market size and forecast 2024-2029
      • Chart on Japan - Market size and forecast 2024-2029 ($ million)
      • Data Table on Japan - Market size and forecast 2024-2029 ($ million)
      • Chart on Japan - Year-over-year growth 2024-2029 (%)
      • Data Table on Japan - Year-over-year growth 2024-2029 (%)
    • 11.11 Germany - Market size and forecast 2024-2029
      • Chart on Germany - Market size and forecast 2024-2029 ($ million)
      • Data Table on Germany - Market size and forecast 2024-2029 ($ million)
      • Chart on Germany - Year-over-year growth 2024-2029 (%)
      • Data Table on Germany - Year-over-year growth 2024-2029 (%)
    • 11.12 UK - Market size and forecast 2024-2029
      • Chart on UK - Market size and forecast 2024-2029 ($ million)
      • Data Table on UK - Market size and forecast 2024-2029 ($ million)
      • Chart on UK - Year-over-year growth 2024-2029 (%)
      • Data Table on UK - Year-over-year growth 2024-2029 (%)
    • 11.13 India - Market size and forecast 2024-2029
      • Chart on India - Market size and forecast 2024-2029 ($ million)
      • Data Table on India - Market size and forecast 2024-2029 ($ million)
      • Chart on India - Year-over-year growth 2024-2029 (%)
      • Data Table on India - Year-over-year growth 2024-2029 (%)
    • 11.14 Canada - Market size and forecast 2024-2029
      • Chart on Canada - Market size and forecast 2024-2029 ($ million)
      • Data Table on Canada - Market size and forecast 2024-2029 ($ million)
      • Chart on Canada - Year-over-year growth 2024-2029 (%)
      • Data Table on Canada - Year-over-year growth 2024-2029 (%)
    • 11.15 South Korea - Market size and forecast 2024-2029
      • Chart on South Korea - Market size and forecast 2024-2029 ($ million)
      • Data Table on South Korea - Market size and forecast 2024-2029 ($ million)
      • Chart on South Korea - Year-over-year growth 2024-2029 (%)
      • Data Table on South Korea - Year-over-year growth 2024-2029 (%)
    • 11.16 France - Market size and forecast 2024-2029
      • Chart on France - Market size and forecast 2024-2029 ($ million)
      • Data Table on France - Market size and forecast 2024-2029 ($ million)
      • Chart on France - Year-over-year growth 2024-2029 (%)
      • Data Table on France - Year-over-year growth 2024-2029 (%)
    • 11.17 Brazil - Market size and forecast 2024-2029
      • Chart on Brazil - Market size and forecast 2024-2029 ($ million)
      • Data Table on Brazil - Market size and forecast 2024-2029 ($ million)
      • Chart on Brazil - Year-over-year growth 2024-2029 (%)
      • Data Table on Brazil - Year-over-year growth 2024-2029 (%)
    • 11.18 Market opportunity by geography
      • Market opportunity by geography ($ million)
      • Data Tables on Market opportunity by geography ($ million)

    12 Drivers, Challenges, and Opportunity/Restraints

    • 12.1 Market drivers
      • 12.2 Market challenges
        • 12.3 Impact of drivers and challenges
          • Impact of drivers and challenges in 2024 and 2029
        • 12.4 Market opportunities/restraints

          13 Competitive Landscape

          • 13.1 Overview
            • 13.2 Competitive Landscape
              • Overview on criticality of inputs and factors of differentiation
            • 13.3 Landscape disruption
              • Overview on factors of disruption
            • 13.4 Industry risks
              • Impact of key risks on business

            14 Competitive Analysis

            • 14.1 Companies profiled
              • Companies covered
            • 14.2 Company ranking index
              • Company ranking index
            • 14.3 Market positioning of companies
              • Matrix on companies position and classification
            • 14.4 Alibaba Group Holding Ltd.
              • Alibaba Group Holding Ltd. - Overview
              • Alibaba Group Holding Ltd. - Business segments
              • Alibaba Group Holding Ltd. - Key news
              • Alibaba Group Holding Ltd. - Key offerings
              • Alibaba Group Holding Ltd. - Segment focus
              • SWOT
            • 14.5 Amazon.com Inc.
              • Amazon.com Inc. - Overview
              • Amazon.com Inc. - Business segments
              • Amazon.com Inc. - Key news
              • Amazon.com Inc. - Key offerings
              • Amazon.com Inc. - Segment focus
              • SWOT
            • 14.6 Blue Yonder Inc.
              • Blue Yonder Inc. - Overview
              • Blue Yonder Inc. - Product / Service
              • Blue Yonder Inc. - Key offerings
              • SWOT
            • 14.7 C3.ai Inc.
              • C3.ai Inc. - Overview
              • C3.ai Inc. - Product / Service
              • C3.ai Inc. - Key news
              • C3.ai Inc. - Key offerings
              • SWOT
            • 14.8 Coupa Software Inc.
              • Coupa Software Inc. - Overview
              • Coupa Software Inc. - Product / Service
              • Coupa Software Inc. - Key offerings
              • SWOT
            • 14.9 Fourkites Inc.
              • Fourkites Inc. - Overview
              • Fourkites Inc. - Product / Service
              • Fourkites Inc. - Key offerings
              • SWOT
            • 14.10 Infor Inc.
              • Infor Inc. - Overview
              • Infor Inc. - Product / Service
              • Infor Inc. - Key news
              • Infor Inc. - Key offerings
              • SWOT
            • 14.11 International Business Machines Corp.
              • International Business Machines Corp. - Overview
              • International Business Machines Corp. - Business segments
              • International Business Machines Corp. - Key news
              • International Business Machines Corp. - Key offerings
              • International Business Machines Corp. - Segment focus
              • SWOT
            • 14.12 Kinaxis Inc.
              • Kinaxis Inc. - Overview
              • Kinaxis Inc. - Product / Service
              • Kinaxis Inc. - Key news
              • Kinaxis Inc. - Key offerings
              • SWOT
            • 14.13 Manhattan Associates Inc.
              • Manhattan Associates Inc. - Overview
              • Manhattan Associates Inc. - Business segments
              • Manhattan Associates Inc. - Key news
              • Manhattan Associates Inc. - Key offerings
              • Manhattan Associates Inc. - Segment focus
              • SWOT
            • 14.14 Microsoft Corp.
              • Microsoft Corp. - Overview
              • Microsoft Corp. - Business segments
              • Microsoft Corp. - Key news
              • Microsoft Corp. - Key offerings
              • Microsoft Corp. - Segment focus
              • SWOT
            • 14.15 Oracle Corp.
              • Oracle Corp. - Overview
              • Oracle Corp. - Business segments
              • Oracle Corp. - Key news
              • Oracle Corp. - Key offerings
              • Oracle Corp. - Segment focus
              • SWOT
            • 14.16 project44
              • project44 - Overview
              • project44 - Product / Service
              • project44 - Key offerings
              • SWOT
            • 14.17 SAP SE
              • SAP SE - Overview
              • SAP SE - Business segments
              • SAP SE - Key news
              • SAP SE - Key offerings
              • SAP SE - Segment focus
              • SWOT
            • 14.18 SAS Institute Inc.
              • SAS Institute Inc. - Overview
              • SAS Institute Inc. - Product / Service
              • SAS Institute Inc. - Key news
              • SAS Institute Inc. - Key offerings
              • SWOT

            15 Appendix

            • 15.1 Scope of the report
              • 15.2 Inclusions and exclusions checklist
                • Inclusions checklist
                • Exclusions checklist
              • 15.3 Currency conversion rates for US$
                • Currency conversion rates for US$
              • 15.4 Research methodology
                • Research methodology
              • 15.5 Data procurement
                • Information sources
              • 15.6 Data validation
                • Data validation
              • 15.7 Validation techniques employed for market sizing
                • Validation techniques employed for market sizing
              • 15.8 Data synthesis
                • Data synthesis
              • 15.9 360 degree market analysis
                • 360 degree market analysis
              • 15.10 List of abbreviations
                • List of abbreviations

              Research Methodology

              Technavio presents a detailed picture of the market by way of study, synthesis, and summation of data from multiple sources. The analysts have presented the various facets of the market with a particular focus on identifying the key industry influencers. The data thus presented is comprehensive, reliable, and the result of extensive research, both primary and secondary.

              INFORMATION SOURCES

              Primary sources

              • Manufacturers and suppliers
              • Channel partners
              • Industry experts
              • Strategic decision makers

              Secondary sources

              • Industry journals and periodicals
              • Government data
              • Financial reports of key industry players
              • Historical data
              • Press releases

              DATA ANALYSIS

              Data Synthesis

              • Collation of data
              • Estimation of key figures
              • Analysis of derived insights

              Data Validation

              • Triangulation with data models
              • Reference against proprietary databases
              • Corroboration with industry experts

              REPORT WRITING

              Qualitative

              • Market drivers
              • Market challenges
              • Market trends
              • Five forces analysis

              Quantitative

              • Market size and forecast
              • Market segmentation
              • Geographical insights
              • Competitive landscape

              Interested in this report?

              Get your sample now to see our research methodology and insights!

              Download Now

              Frequently Asked Questions

              Predictive Ai In Supply Chain market growth will increase by $ 4688.8 mn during 2025-2029.

              The Predictive Ai In Supply Chain market is expected to grow at a CAGR of 16.2% during 2025-2029.

              Predictive Ai In Supply Chain market is segmented by Component( Software, Services, Hardware) Deployment( Cloud, On-premises, Hybrid) Application( Supply chain planning, Warehouse management, Fleet management, Virtual assistant, Others)

              Alibaba Group Holding Ltd., Amazon.com Inc., Blue Yonder Inc., C3.ai Inc., Coupa Software Inc., DHL International GmbH, FedEx Corp., Fourkites Inc., Infor Inc., Intel Corp., International Business Machines Corp., Kinaxis Inc., Manhattan Associates Inc., Microsoft Corp., NVIDIA Corp., Oracle Corp., project44, Qualcomm Inc., Samsung Electronics Co. Ltd., SAP SE, SAS Institute Inc. are a few of the key vendors in the Predictive Ai In Supply Chain market.

              APAC will register the highest growth rate of 36% among the other regions. Therefore, the Predictive Ai In Supply Chain market in APAC is expected to garner significant business opportunities for the vendors during the forecast period.

              US, China, Japan, Germany, UK, India, Canada, South Korea, France, Brazil

              • Heightened imperative for supply chain resilience and agilityThe global predictive AI in supply chain market is being propelled forward by an urgent and non-negotiable demand for greater resilience and agility. A series of unprecedented global disruptions in recent years has exposed the profound vulnerabilities of lean is the driving factor this market.
              • just in time supply chain models is the driving factor this market.
              • compelling a strategic shift from reactive problem solving to proactive risk mitigation. Organizations now recognize that operational visibility is insufficient is the driving factor this market.
              • true resilience requires the ability to anticipate and prepare for potential shocks before they occur. Predictive AI is the core enabling technology for this transformation. By ingesting and analyzing a vast array of structured and unstructured data is the driving factor this market.
              • spanning geopolitical intelligence is the driving factor this market.
              • weather forecasts is the driving factor this market.
              • shipping lane congestion is the driving factor this market.
              • and supplier financial health is the driving factor this market.
              • AI powered platforms can identify leading indicators of disruption and generate probabilistic risk scores. This allows businesses to move beyond historical analysis and forecast the likelihood of future events is the driving factor this market.
              • such as a supplier default is the driving factor this market.
              • a port closure is the driving factor this market.
              • or a sudden spike in commodity prices. With this foresight is the driving factor this market.
              • supply chain managers can execute preemptive actions is the driving factor this market.
              • such as securing alternative suppliers is the driving factor this market.
              • rerouting shipments is the driving factor this market.
              • or strategically increasing safety stock for at risk components. The strong market appetite for these capabilities is evident in recent industry developments. For example is the driving factor this market.
              • in September 2023 is the driving factor this market.
              • Everstream Analytics is the driving factor this market.
              • a company specializing in predictive supply chain risk detection and response is the driving factor this market.
              • secured a significant funding round. This investment underscores the high value that stakeholders place on platforms capable of forecasting disruptions and enabling organizations to build more robust is the driving factor this market.
              • agile is the driving factor this market.
              • and shock resistant supply networks that can navigate an increasingly volatile and unpredictable global landscape. is the driving factor this market.

              The Predictive Ai In Supply Chain market vendors should focus on grabbing business opportunities from the Software segment as it accounted for the largest market share in the base year.
              RIA - Research AI Assistant
              Ask RIA