Private 5g Market Analysis, Size, and Forecast 2025-2029: APAC (China, Japan, and South Korea), North America (US, Canada, and Mexico), Europe (Germany, UK, and France), Middle East and Africa (Saudi Arabia, UAE, and South Africa), South America (Brazil, Argentina, and Colombia), and Rest of World (ROW)

Private 5g Market Analysis, Size, and Forecast 2025-2029:
APAC (China, Japan, and South Korea), North America (US, Canada, and Mexico), Europe (Germany, UK, and France), Middle East and Africa (Saudi Arabia, UAE, and South Africa), South America (Brazil, Argentina, and Colombia), and Rest of World (ROW)

Published: Dec 2025 302 Pages SKU: IRTNTR81116

Market Overview at a Glance

$10.41 B
Market Opportunity
38.7%
CAGR 2024 - 2029
38.7%
APAC Growth
$1.04 B
Hardware segment 2023

Private 5g Market Size 2025-2029

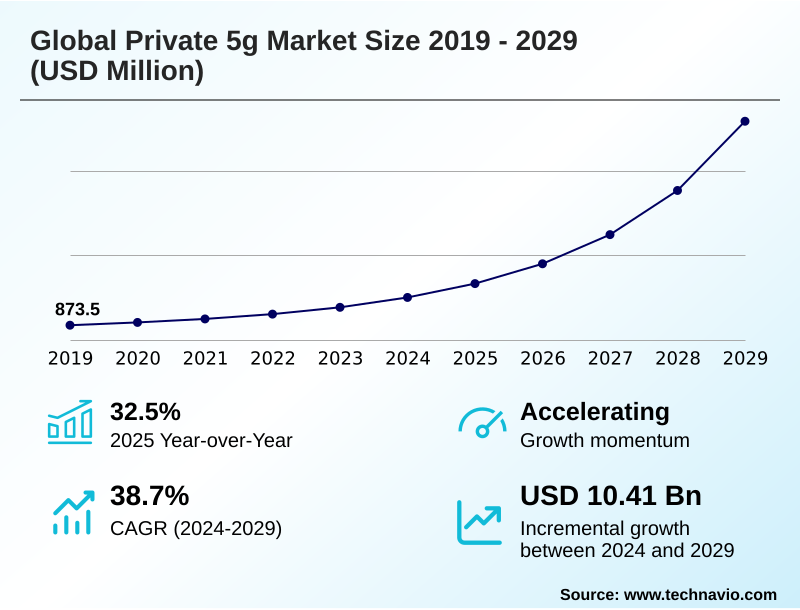
The private 5g market size is valued to increase by USD 10.41 billion, at a CAGR of 38.7% from 2024 to 2029. Growing demand for enhanced connectivity for industry 4.0 and mission-critical applications will drive the private 5g market.

Major Market Trends & Insights

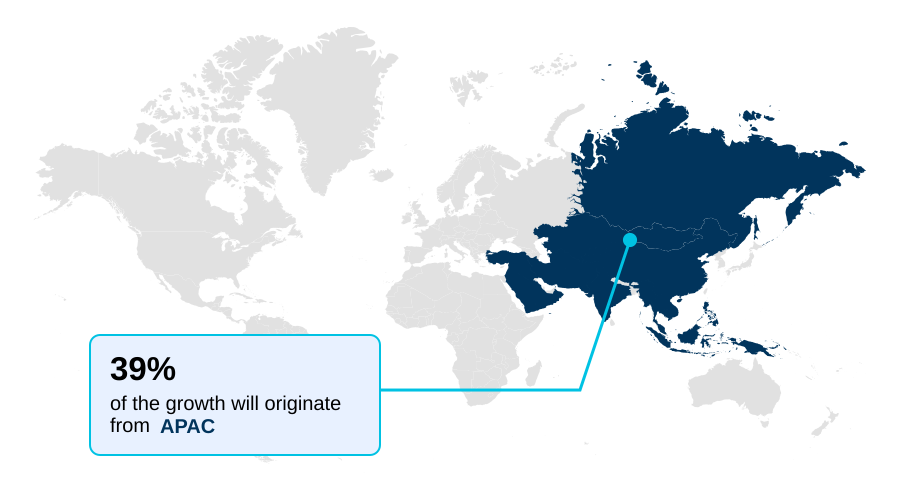
  • APAC dominated the market and accounted for a 38.7% growth during the forecast period.
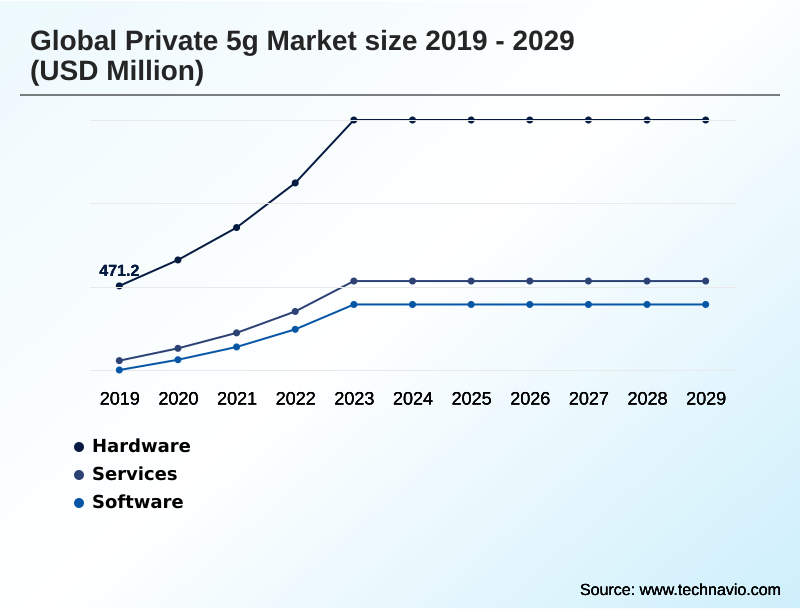
  • By Component - Hardware segment was valued at USD 1.04 billion in 2023
  • By Type - Licensed segment accounted for the largest market revenue share in 2023

Market Size & Forecast

  • Market Opportunities: USD 12.05 billion
  • Market Future Opportunities: USD 10.41 billion
  • CAGR from 2024 to 2029 : 38.7%

Market Summary

  • The private 5G market is transitioning from a niche concept to a cornerstone of enterprise digital transformation, driven by the stringent demands of Industry 4.0. Conventional wireless solutions often fail to provide the deterministic performance required for advanced operational technology (ot) integration. This technology offers a dedicated, enterprise-owned infrastructure that ensures ultra-reliable low-latency communication (urllc) and massive machine-type communication (mmtc).
  • For instance, a smart factory can deploy a private network to guarantee sub-millisecond latency for industrial automation control loops and autonomous mobile robots, while simultaneously connecting thousands of sensors for predictive maintenance analytics. This level of control, inherent in a service-based architecture (sba), allows for customized private 5g network slicing to isolate critical traffic.
  • However, adoption is tempered by the complexity of radio frequency (rf) planning and the need for specialized skills. The trend toward network-as-a-service (naas) models and open ran standards is mitigating these challenges, making deployments more financially and operationally viable for a wider range of industries seeking to secure a competitive edge through enhanced connectivity and on-premise data processing.

What will be the Size of the Private 5g Market during the forecast period?

Get Key Insights on Market Forecast (PDF) Request Free Sample

How is the Private 5g Market Segmented?

The private 5g industry research report provides comprehensive data (region-wise segment analysis), with forecasts and estimates in "USD million" for the period 2025-2029, as well as historical data from 2019-2023 for the following segments.

  • Component
    • Hardware
    • Services
    • Software
  • Type
    • Licensed
    • Shared
  • Frequency range
    • Mid
    • mmWave
    • Low
  • Geography
    • APAC
      • China
      • Japan
      • South Korea
    • North America
      • US
      • Canada
      • Mexico
    • Europe
      • Germany
      • UK
      • France
    • Middle East and Africa
      • Saudi Arabia
      • UAE
      • South Africa
    • South America
      • Brazil
      • Argentina
      • Colombia
    • Rest of World (ROW)

By Component Insights

The hardware segment is estimated to witness significant growth during the forecast period.

The hardware segment is evolving beyond monolithic systems, driven by a strategic shift toward radio access network (ran) disaggregation.

This trend, underpinned by open ran standards, allows enterprises to build best-of-breed networks, improving system performance for high-resolution machine vision by up to 15%. The core network leverages a service-based architecture (sba), while new ran compute processors enhance edge capabilities.

Companies are moving toward a complete end-to-end network solution, utilizing software-defined networking (sdn) to manage quality of service (qos) parameters dynamically.

This supports demanding applications from augmented reality for remote assistance and automated port terminal operations to real-time asset tracking, ensuring secure campus-wide connectivity for use cases like live event production broadcasting.

Request Free Sample

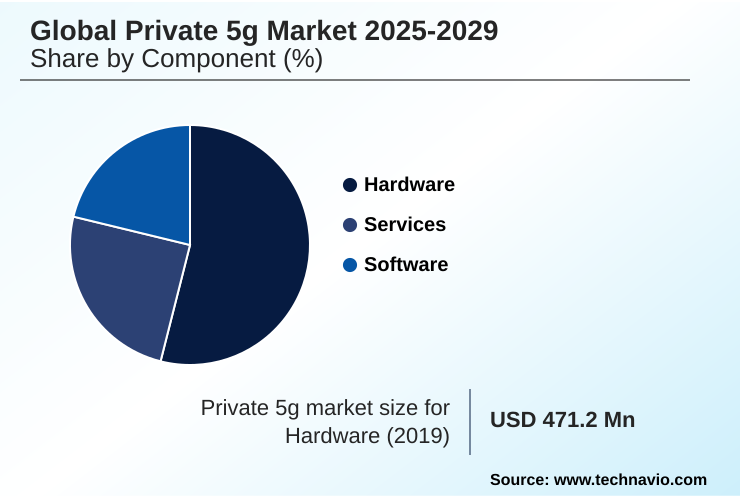
The Hardware segment was valued at USD 1.04 billion in 2023 and showed a gradual increase during the forecast period.

Request Free Sample

Regional Analysis

APAC is estimated to contribute 38.7% to the growth of the global market during the forecast period.Technavio’s analysts have elaborately explained the regional trends and drivers that shape the market during the forecast period.

See How Private 5g Market Demand is Rising in APAC Request Free Sample

The global landscape is characterized by varied regional adoption strategies and regulatory environments. In North America, the citizens broadband radio service (cbrs) framework, governed by a spectrum access system (sas), has democratized access to spectrum, fueling a diverse ecosystem.

This has spurred deployments of non-public mobile networks built on a cloud-native 5g core with a distributed user plane function (upf) to support the industrial internet of things (iiot).

In contrast, APAC's market growth, which is expanding at a rate approximately 1% higher than North America's, is driven by manufacturing-led economies. These regions leverage enterprise-owned infrastructure to gain competitive advantages.

Deployments increasingly feature a mobile edge computing (mec) platform to enable real-time video analytics for predictive maintenance analytics, reducing equipment failures by up to 20%. This supports smart city infrastructure and high-density venue connectivity, ensuring a resilient communications network.

Market Dynamics

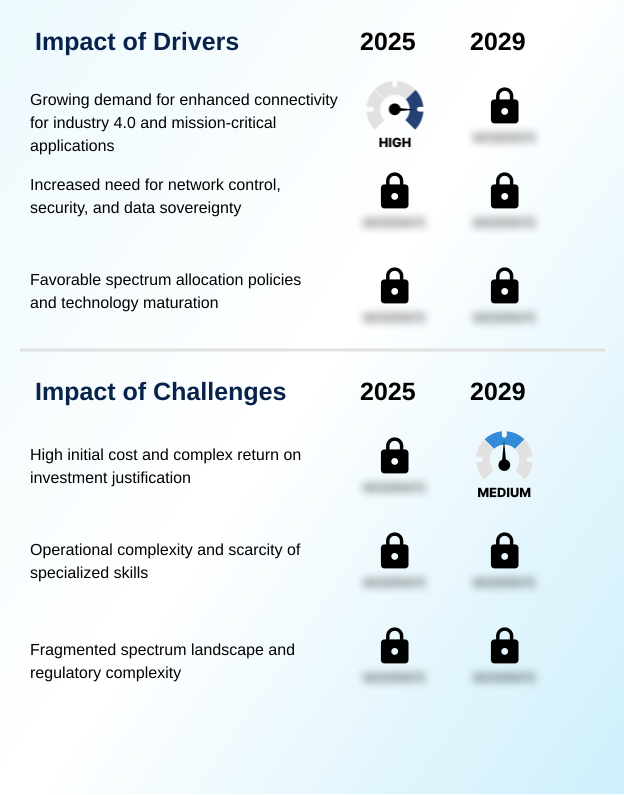
Our researchers analyzed the data with 2024 as the base year, along with the key drivers, trends, and challenges. A holistic analysis of drivers will help companies refine their marketing strategies to gain a competitive advantage.

  • Strategic implementation is increasingly focused on specialized use cases and architectures that deliver measurable business outcomes. The debate over private 5g vs wi-fi 6e performance comparison is settling, with enterprises recognizing the need for urllc for industrial robotics control, a domain where cellular technology excels.
  • The roi calculation for private 5g in manufacturing is becoming clearer as deployments demonstrate tangible gains from reduced downtime and enhanced automation. Architecturally, a private 5g edge computing deployment architecture is standard for enabling mec integration for low-latency applications. Operationally, managing esim in private 5g networks is a key focus, simplified by naas models for private cellular networks.
  • Security is paramount, with private 5g security for zero-trust models becoming a baseline requirement, governed by strict private 5g network security policy control. The cbrs shared spectrum for enterprise 5g in the US has created a blueprint for accessible deployments. Globally, firms are developing a private lte to 5g migration strategy to leverage existing investments.
  • Key trends include network slicing for ot and it convergence, the rise of open ran benefits in private networks, and using private 5g for autonomous vehicle fleets. This is underpinned by a focus on data sovereignty with on-premise 5g core and creating a hybrid network for campus and public roaming.
  • Firms leveraging these strategies report operational efficiencies that are often double those of legacy systems, particularly when automating private network operations with aiops for deployments like mmwave deployments for high-density venues and iiot connectivity with private 5g.

What are the key market drivers leading to the rise in the adoption of Private 5g Industry?

  • The growing demand for enhanced connectivity to support Industry 4.0 and mission-critical applications serves as a primary driver for market adoption.

  • The primary market drivers are the stringent performance requirements of modern industrial applications that legacy systems cannot meet.
  • The need for ultra-reliable low-latency communication (urllc) is paramount for industrial automation control loops, with deployments achieving response times under 5 milliseconds for precise autonomous guided vehicle (agv) control.
  • Concurrently, massive machine-type communication (mmtc) supports the connection of thousands of devices for critical infrastructure security, while enhanced mobile broadband (embb) facilitates data-intensive applications.
  • Private 5g network slicing is crucial for operational technology (ot) integration, ensuring guaranteed performance for distinct processes. This is vital for autonomous mobile robots (amr), remote-controlled heavy equipment, and smart oilfield projects.
  • The integration of time-sensitive networking (tsn) further enhances determinism, with implementations improving safety incident rates by up to 20% through reliable connected worker safety solutions.

What are the market trends shaping the Private 5g Industry?

  • A pronounced shift toward network-as-a-service and managed service models is reshaping procurement, making private 5G more accessible to a broader range of enterprises.

  • Market trends are centered on lowering adoption barriers and simplifying operational complexity. The shift to network-as-a-service (naas) models is significant, with some providers reporting this can reduce initial capital expenditures for enterprises by over 60% compared to traditional procurement. This trend is complemented by the rise of hybrid private-public network architectures, which offer seamless connectivity.
  • On the operational front, ai for operations (aiops) is being integrated to automate management, decreasing network fault resolution times by an average of 30%. The technological underpinning involves a move to virtualized network functions (vnf) and containerized network functions (cnf), enabling agile deployments.
  • Furthermore, dynamic spectrum sharing is gaining traction, providing more flexible and efficient spectrum use, while many organizations are initiating their journey with a private lte network as a stepping stone to full 5G, supporting smart factory initiatives and mission-critical communications.

What challenges does the Private 5g Industry face during its growth?

  • The high initial cost of deployment, coupled with the complexity of justifying return on investment, presents a key challenge to widespread industry growth.

  • Enterprises face significant challenges related to operational complexity and regulatory fragmentation. Managing a 3gpp-standardized 5g core requires specialized skills, and the complexity of radio frequency (rf) planning can extend project timelines by an average of 25%. Furthermore, esim lifecycle management introduces new operational workflows. The pursuit of data sovereignty compliance often mandates on-premise data processing, adding to infrastructure costs.
  • The fragmented global landscape for local spectrum licensing means navigating different rules for mid-band and millimeter wave (mmwave) spectrum in each country, with the process of securing a license taking over six months in some regions. Implementing a robust zero-trust security architecture across this new network domain is non-trivial.
  • These hurdles temper adoption, particularly for applications like remote surgical procedures, precision farming applications, industrial metaverse platforms, intelligent transportation systems, and large-scale unmanned aerial vehicle (uav) operation.

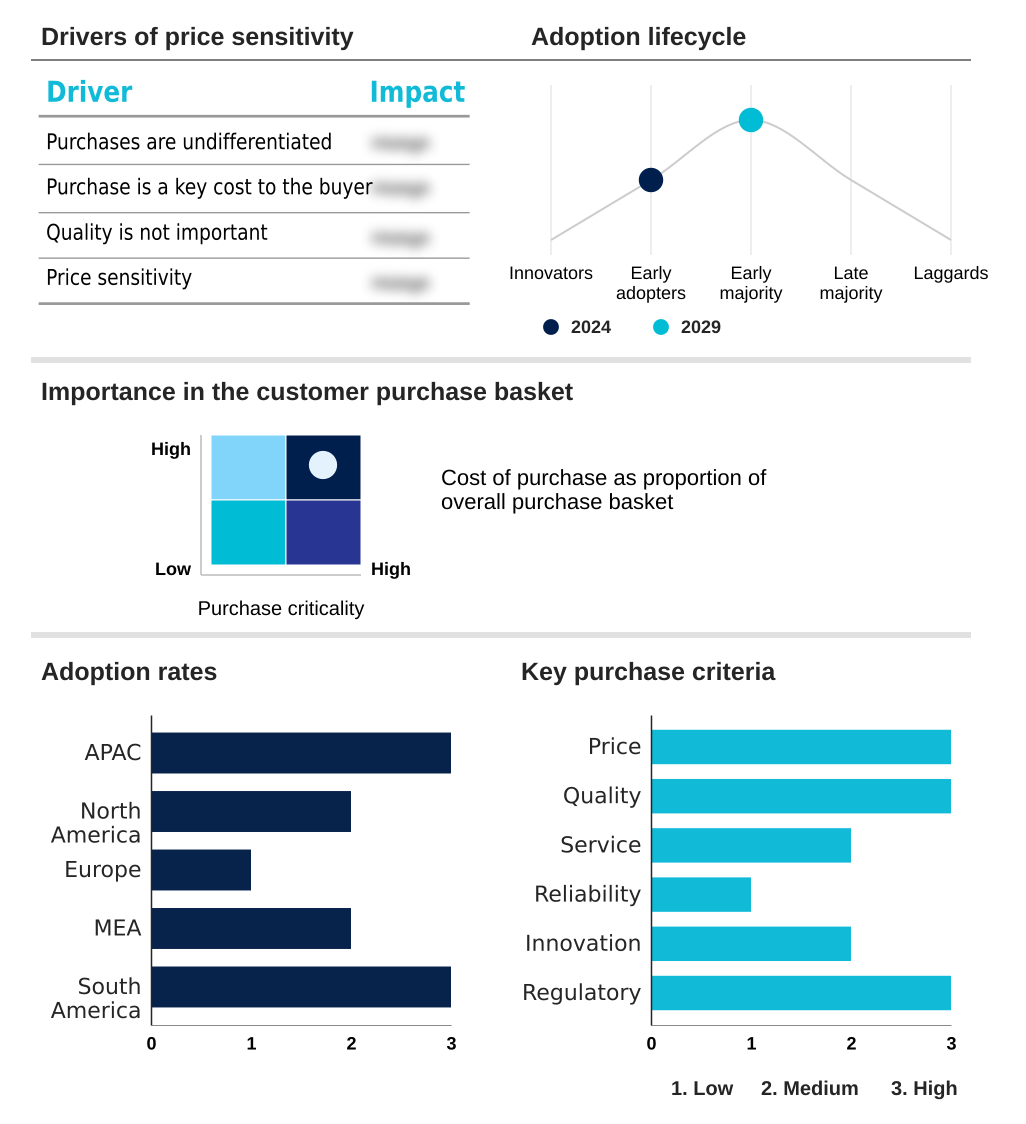
Exclusive Technavio Analysis on Customer Landscape

The private 5g market forecasting report includes the adoption lifecycle of the market, covering from the innovator’s stage to the laggard’s stage. It focuses on adoption rates in different regions based on penetration. Furthermore, the private 5g market report also includes key purchase criteria and drivers of price sensitivity to help companies evaluate and develop their market growth analysis strategies.

Customer Landscape of Private 5g Industry

Competitive Landscape

Companies are implementing various strategies, such as strategic alliances, private 5g market forecast, partnerships, mergers and acquisitions, geographical expansion, and product/service launches, to enhance their presence in the industry.

Airspan Networks Inc. - Offerings include private 5G with multi-access edge computing, designed to deliver ultra-low latency and support localized data processing for mission-critical enterprise applications.

The industry research and growth report includes detailed analyses of the competitive landscape of the market and information about key companies, including:

  • Airspan Networks Inc.
  • AT and T Inc.
  • Celona Inc.
  • Ciena Corp.
  • Cisco Systems Inc.
  • CommScope Holding
  • Hewlett Packard
  • Huawei Technologies Co. Ltd.
  • Juniper Networks Inc.
  • Mavenir Systems Inc.
  • Microsoft Corp.
  • NEC Corp.
  • Nokia Corp.
  • Qualcomm Inc.
  • Samsung Electronics Co. Ltd.
  • Telefonaktiebolaget Ericsson
  • Verizon Communications Inc.
  • ZTE Corp.

Qualitative and quantitative analysis of companies has been conducted to help clients understand the wider business environment as well as the strengths and weaknesses of key industry players. Data is qualitatively analyzed to categorize companies as pure play, category-focused, industry-focused, and diversified; it is quantitatively analyzed to categorize companies as dominant, leading, strong, tentative, and weak.

Recent Development and News in Private 5g market

  • In September, 2024, Samsung Electronics Co. Ltd. and NEC Corp. announced a partnership to deliver joint private 5G network solutions to enterprise customers, combining Samsung's 5G portfolio with NEC's system integration expertise.
  • In November, 2024, Hewlett Packard Enterprise Co. enhanced its private networking offerings by integrating its Athonet core network software with its Aruba wireless technologies, creating a unified management interface for both Wi-Fi and private 5G.
  • In January, 2025, Verizon Communications Inc. secured a contract to deploy a private 5G network for the U.S. Department of Energy Pacific Northwest National Laboratory, providing a secure communications platform for advanced research programs.
  • In April, 2025, Nokia Corp. announced an expansion of its private 5G network for the City of Las Vegas, utilizing CBRS shared spectrum to support a wide range of smart city initiatives, including public safety and remote asset monitoring.

Dive into Technavio’s robust research methodology, blending expert interviews, extensive data synthesis, and validated models for unparalleled Private 5g Market insights. See full methodology.

Market Scope
Page number 302
Base year 2024
Historic period 2019-2023
Forecast period 2025-2029
Growth momentum & CAGR Accelerate at a CAGR of 38.7%
Market growth 2025-2029 USD 10411.5 million
Market structure Fragmented
YoY growth 2024-2025(%) 32.5%
Key countries China, Japan, South Korea, India, Australia, Indonesia, US, Canada, Mexico, Germany, UK, France, Italy, Spain, The Netherlands, Saudi Arabia, UAE, South Africa, Israel, Turkey, Brazil, Argentina and Colombia
Competitive landscape Leading Companies, Market Positioning of Companies, Competitive Strategies, and Industry Risks

Request Free Sample

Research Analyst Overview

  • The market is defined by a technological convergence aimed at delivering enterprise-owned infrastructure with carrier-grade performance. Deployments are increasingly leveraging a service-based architecture (sba) and a cloud-native 5g core, often managed via network-as-a-service (naas) models.
  • Key enablers include radio access network (ran) disaggregation through open ran standards and dynamic spectrum sharing frameworks like citizens broadband radio service (cbrs), which is managed by a spectrum access system (sas).
  • The technology delivers on three core principles: ultra-reliable low-latency communication (urllc) for applications like autonomous guided vehicle (agv) control, massive machine-type communication (mmtc) for industrial internet of things (iiot), and enhanced mobile broadband (embb). Functionality is enhanced by private 5g network slicing, mobile edge computing (mec) platforms, and time-sensitive networking (tsn).
  • For enterprises, this translates to tangible benefits from operational technology (ot) integration and on-premise data processing, secured by a zero-trust security architecture. A focus on simplified operations is driving adoption of ai for operations (aiops), which has been shown to reduce network downtime by up to 40%.
  • The ecosystem is delivering end-to-end network solutions featuring advanced ran compute processors and sophisticated software-defined networking (sdn) to manage quality of service (qos) parameters, moving beyond private lte networks.
  • Managing a 3gpp-standardized 5g core, including esim lifecycle management and radio frequency (rf) planning, remains complex but essential for harnessing technologies like millimeter wave (mmwave) spectrum and containerized network functions (cnf) within a non-public mobile network.

What are the Key Data Covered in this Private 5g Market Research and Growth Report?

  • What is the expected growth of the Private 5g Market between 2025 and 2029?

    • USD 10.41 billion, at a CAGR of 38.7%

  • What segmentation does the market report cover?

    • The report is segmented by Component (Hardware, Services, and Software), Type (Licensed, and Shared), Frequency Range (Mid, mmWave, and Low) and Geography (APAC, North America, Europe, Middle East and Africa, South America)

  • Which regions are analyzed in the report?

    • APAC, North America, Europe, Middle East and Africa and South America

  • What are the key growth drivers and market challenges?

    • Growing demand for enhanced connectivity for industry 4.0 and mission-critical applications, High initial cost and complex return on investment justification

  • Who are the major players in the Private 5g Market?

    • Airspan Networks Inc., AT and T Inc., Celona Inc., Ciena Corp., Cisco Systems Inc., CommScope Holding, Hewlett Packard, Huawei Technologies Co. Ltd., Juniper Networks Inc., Mavenir Systems Inc., Microsoft Corp., NEC Corp., Nokia Corp., Qualcomm Inc., Samsung Electronics Co. Ltd., Telefonaktiebolaget Ericsson, Verizon Communications Inc. and ZTE Corp.

Market Research Insights

  • Enterprise adoption is accelerating, driven by the need for secure campus-wide connectivity and data sovereignty compliance. Smart factory initiatives are leveraging private networks to enable a 25% improvement in automated warehouse logistics, while smart city infrastructure projects utilize them for intelligent transportation systems.
  • Use cases range from high-density venue connectivity and live event production broadcasting to critical infrastructure security for a smart grid management system. The technology supports remote-controlled heavy equipment in smart oilfield projects and provides the resilient communications network needed for tactical communications network deployments.
  • This enables transformative applications like digital twin applications, remote surgical procedures, industrial metaverse platforms, and precision farming applications, with deployments showing real-time asset tracking accuracy improving by over 99.5%.
  • It also underpins mission-critical communications for connected worker safety solutions, autonomous mobile robots (amr), high-resolution machine vision, augmented reality for remote assistance, industrial automation control loops, real-time video analytics, predictive maintenance analytics, and automated port terminal operations with unmanned aerial vehicle (uav) operation.

We can help! Our analysts can customize this private 5g market research report to meet your requirements.

Get in touch

1. Executive Summary

1.1 Market overview

Executive Summary - Chart on Market Overview
Executive Summary - Data Table on Market Overview
Executive Summary - Chart on Global Market Characteristics
Executive Summary - Chart on Market by Geography
Executive Summary - Chart on Market Segmentation by Component
Executive Summary - Chart on Market Segmentation by Type
Executive Summary - Chart on Market Segmentation by Frequency Range
Executive Summary - Chart on Incremental Growth
Executive Summary - Data Table on Incremental Growth
Executive Summary - Chart on Company Market Positioning

2. Technavio Analysis

2.1 Analysis of price sensitivity, lifecycle, customer purchase basket, adoption rates, and purchase criteria

2.2 Criticality of inputs and Factors of differentiation

Chart on Overview on criticality of inputs and factors of differentiation

2.3 Factors of disruption

Chart on Overview on factors of disruption

2.4 Impact of drivers and challenges

Chart on Impact of drivers and challenges in 2024 and 2029

3. Market Landscape

3.1 Market ecosystem

Chart on Parent Market
Data Table on - Parent Market

3.2 Market characteristics

Chart on Market characteristics analysis

3.3 Value chain analysis

Chart on Value chain analysis

4. Market Sizing

4.1 Market definition

Data Table on Offerings of companies included in the market definition

4.2 Market segment analysis

Market segments

4.3 Market size 2024

4.4 Market outlook: Forecast for 2024-2029

Chart on Global - Market size and forecast 2024-2029 ($ million)
Data Table on Global - Market size and forecast 2024-2029 ($ million)
Chart on Global Market: Year-over-year growth 2024-2029 (%)
Data Table on Global Market: Year-over-year growth 2024-2029 (%)

5. Historic Market Size

5.1 Global Private 5g Market 2019 - 2023

Historic Market Size - Data Table on Global Private 5g Market 2019 - 2023 ($ million)

5.2 Component segment analysis 2019 - 2023

Historic Market Size - Component Segment 2019 - 2023 ($ million)

5.3 Type segment analysis 2019 - 2023

Historic Market Size - Type Segment 2019 - 2023 ($ million)

5.4 Frequency Range segment analysis 2019 - 2023

Historic Market Size - Frequency Range Segment 2019 - 2023 ($ million)

5.5 Geography segment analysis 2019 - 2023

Historic Market Size - Geography Segment 2019 - 2023 ($ million)

5.6 Country segment analysis 2019 - 2023

Historic Market Size - Country Segment 2019 - 2023 ($ million)

6. Five Forces Analysis

6.1 Five forces summary

Five forces analysis - Comparison between 2024 and 2029

6.2 Bargaining power of buyers

Bargaining power of buyers - Impact of key factors 2024 and 2029

6.3 Bargaining power of suppliers

Bargaining power of suppliers - Impact of key factors in 2024 and 2029

6.4 Threat of new entrants

Threat of new entrants - Impact of key factors in 2024 and 2029

6.5 Threat of substitutes

Threat of substitutes - Impact of key factors in 2024 and 2029

6.6 Threat of rivalry

Threat of rivalry - Impact of key factors in 2024 and 2029

6.7 Market condition

Chart on Market condition - Five forces 2024 and 2029

7. Market Segmentation by Component

7.1 Market segments

Chart on Component - Market share 2024-2029 (%)
Data Table on Component - Market share 2024-2029 (%)

7.2 Comparison by Component

Chart on Comparison by Component
Data Table on Comparison by Component

7.3 Hardware - Market size and forecast 2024-2029

Chart on Hardware - Market size and forecast 2024-2029 ($ million)
Data Table on Hardware - Market size and forecast 2024-2029 ($ million)
Chart on Hardware - Year-over-year growth 2024-2029 (%)
Data Table on Hardware - Year-over-year growth 2024-2029 (%)

7.4 Services - Market size and forecast 2024-2029

Chart on Services - Market size and forecast 2024-2029 ($ million)
Data Table on Services - Market size and forecast 2024-2029 ($ million)
Chart on Services - Year-over-year growth 2024-2029 (%)
Data Table on Services - Year-over-year growth 2024-2029 (%)

7.5 Software - Market size and forecast 2024-2029

Chart on Software - Market size and forecast 2024-2029 ($ million)
Data Table on Software - Market size and forecast 2024-2029 ($ million)
Chart on Software - Year-over-year growth 2024-2029 (%)
Data Table on Software - Year-over-year growth 2024-2029 (%)

7.6 Market opportunity by Component

Market opportunity by Component ($ million)
Data Table on Market opportunity by Component ($ million)

8. Market Segmentation by Type

8.1 Market segments

Chart on Type - Market share 2024-2029 (%)
Data Table on Type - Market share 2024-2029 (%)

8.2 Comparison by Type

Chart on Comparison by Type
Data Table on Comparison by Type

8.3 Licensed - Market size and forecast 2024-2029

Chart on Licensed - Market size and forecast 2024-2029 ($ million)
Data Table on Licensed - Market size and forecast 2024-2029 ($ million)
Chart on Licensed - Year-over-year growth 2024-2029 (%)
Data Table on Licensed - Year-over-year growth 2024-2029 (%)

8.4 Shared - Market size and forecast 2024-2029

Chart on Shared - Market size and forecast 2024-2029 ($ million)
Data Table on Shared - Market size and forecast 2024-2029 ($ million)
Chart on Shared - Year-over-year growth 2024-2029 (%)
Data Table on Shared - Year-over-year growth 2024-2029 (%)

8.5 Market opportunity by Type

Market opportunity by Type ($ million)
Data Table on Market opportunity by Type ($ million)

9. Market Segmentation by Frequency Range

9.1 Market segments

Chart on Frequency Range - Market share 2024-2029 (%)
Data Table on Frequency Range - Market share 2024-2029 (%)

9.2 Comparison by Frequency Range

Chart on Comparison by Frequency Range
Data Table on Comparison by Frequency Range

9.3 Mid - Market size and forecast 2024-2029

Chart on Mid - Market size and forecast 2024-2029 ($ million)
Data Table on Mid - Market size and forecast 2024-2029 ($ million)
Chart on Mid - Year-over-year growth 2024-2029 (%)
Data Table on Mid - Year-over-year growth 2024-2029 (%)

9.4 mmWave - Market size and forecast 2024-2029

Chart on mmWave - Market size and forecast 2024-2029 ($ million)
Data Table on mmWave - Market size and forecast 2024-2029 ($ million)
Chart on mmWave - Year-over-year growth 2024-2029 (%)
Data Table on mmWave - Year-over-year growth 2024-2029 (%)

9.5 Low - Market size and forecast 2024-2029

Chart on Low - Market size and forecast 2024-2029 ($ million)
Data Table on Low - Market size and forecast 2024-2029 ($ million)
Chart on Low - Year-over-year growth 2024-2029 (%)
Data Table on Low - Year-over-year growth 2024-2029 (%)

9.6 Market opportunity by Frequency Range

Market opportunity by Frequency Range ($ million)
Data Table on Market opportunity by Frequency Range ($ million)

10. Customer Landscape

10.1 Customer landscape overview

Analysis of price sensitivity, lifecycle, customer purchase basket, adoption rates, and purchase criteria

11. Geographic Landscape

11.1 Geographic segmentation

Chart on Market share by geography 2024-2029 (%)
Data Table on Market share by geography 2024-2029 (%)

11.2 Geographic comparison

Chart on Geographic comparison
Data Table on Geographic comparison

11.3 APAC - Market size and forecast 2024-2029

Chart on APAC - Market size and forecast 2024-2029 ($ million)
Data Table on APAC - Market size and forecast 2024-2029 ($ million)
Chart on APAC - Year-over-year growth 2024-2029 (%)
Data Table on APAC - Year-over-year growth 2024-2029 (%)
Chart on Regional Comparison - APAC
Data Table on Regional Comparison - APAC

11.3.1 China - Market size and forecast 2024-2029

Chart on China - Market size and forecast 2024-2029 ($ million)
Data Table on China - Market size and forecast 2024-2029 ($ million)
Chart on China - Year-over-year growth 2024-2029 (%)
Data Table on China - Year-over-year growth 2024-2029 (%)

11.3.2 Japan - Market size and forecast 2024-2029

Chart on Japan - Market size and forecast 2024-2029 ($ million)
Data Table on Japan - Market size and forecast 2024-2029 ($ million)
Chart on Japan - Year-over-year growth 2024-2029 (%)
Data Table on Japan - Year-over-year growth 2024-2029 (%)

11.3.3 South Korea - Market size and forecast 2024-2029

Chart on South Korea - Market size and forecast 2024-2029 ($ million)
Data Table on South Korea - Market size and forecast 2024-2029 ($ million)
Chart on South Korea - Year-over-year growth 2024-2029 (%)
Data Table on South Korea - Year-over-year growth 2024-2029 (%)

11.3.4 India - Market size and forecast 2024-2029

Chart on India - Market size and forecast 2024-2029 ($ million)
Data Table on India - Market size and forecast 2024-2029 ($ million)
Chart on India - Year-over-year growth 2024-2029 (%)
Data Table on India - Year-over-year growth 2024-2029 (%)

11.3.5 Australia - Market size and forecast 2024-2029

Chart on Australia - Market size and forecast 2024-2029 ($ million)
Data Table on Australia - Market size and forecast 2024-2029 ($ million)
Chart on Australia - Year-over-year growth 2024-2029 (%)
Data Table on Australia - Year-over-year growth 2024-2029 (%)

11.3.6 Indonesia - Market size and forecast 2024-2029

Chart on Indonesia - Market size and forecast 2024-2029 ($ million)
Data Table on Indonesia - Market size and forecast 2024-2029 ($ million)
Chart on Indonesia - Year-over-year growth 2024-2029 (%)
Data Table on Indonesia - Year-over-year growth 2024-2029 (%)

11.4 North America - Market size and forecast 2024-2029

Chart on North America - Market size and forecast 2024-2029 ($ million)
Data Table on North America - Market size and forecast 2024-2029 ($ million)
Chart on North America - Year-over-year growth 2024-2029 (%)
Data Table on North America - Year-over-year growth 2024-2029 (%)
Chart on Regional Comparison - North America
Data Table on Regional Comparison - North America

11.4.1 US - Market size and forecast 2024-2029

Chart on US - Market size and forecast 2024-2029 ($ million)
Data Table on US - Market size and forecast 2024-2029 ($ million)
Chart on US - Year-over-year growth 2024-2029 (%)
Data Table on US - Year-over-year growth 2024-2029 (%)

11.4.2 Canada - Market size and forecast 2024-2029

Chart on Canada - Market size and forecast 2024-2029 ($ million)
Data Table on Canada - Market size and forecast 2024-2029 ($ million)
Chart on Canada - Year-over-year growth 2024-2029 (%)
Data Table on Canada - Year-over-year growth 2024-2029 (%)

11.4.3 Mexico - Market size and forecast 2024-2029

Chart on Mexico - Market size and forecast 2024-2029 ($ million)
Data Table on Mexico - Market size and forecast 2024-2029 ($ million)
Chart on Mexico - Year-over-year growth 2024-2029 (%)
Data Table on Mexico - Year-over-year growth 2024-2029 (%)

11.5 Europe - Market size and forecast 2024-2029

Chart on Europe - Market size and forecast 2024-2029 ($ million)
Data Table on Europe - Market size and forecast 2024-2029 ($ million)
Chart on Europe - Year-over-year growth 2024-2029 (%)
Data Table on Europe - Year-over-year growth 2024-2029 (%)
Chart on Regional Comparison - Europe
Data Table on Regional Comparison - Europe

11.5.1 Germany - Market size and forecast 2024-2029

Chart on Germany - Market size and forecast 2024-2029 ($ million)
Data Table on Germany - Market size and forecast 2024-2029 ($ million)
Chart on Germany - Year-over-year growth 2024-2029 (%)
Data Table on Germany - Year-over-year growth 2024-2029 (%)

11.5.2 UK - Market size and forecast 2024-2029

Chart on UK - Market size and forecast 2024-2029 ($ million)
Data Table on UK - Market size and forecast 2024-2029 ($ million)
Chart on UK - Year-over-year growth 2024-2029 (%)
Data Table on UK - Year-over-year growth 2024-2029 (%)

11.5.3 France - Market size and forecast 2024-2029

Chart on France - Market size and forecast 2024-2029 ($ million)
Data Table on France - Market size and forecast 2024-2029 ($ million)
Chart on France - Year-over-year growth 2024-2029 (%)
Data Table on France - Year-over-year growth 2024-2029 (%)

11.5.4 Italy - Market size and forecast 2024-2029

Chart on Italy - Market size and forecast 2024-2029 ($ million)
Data Table on Italy - Market size and forecast 2024-2029 ($ million)
Chart on Italy - Year-over-year growth 2024-2029 (%)
Data Table on Italy - Year-over-year growth 2024-2029 (%)

11.5.5 Spain - Market size and forecast 2024-2029

Chart on Spain - Market size and forecast 2024-2029 ($ million)
Data Table on Spain - Market size and forecast 2024-2029 ($ million)
Chart on Spain - Year-over-year growth 2024-2029 (%)
Data Table on Spain - Year-over-year growth 2024-2029 (%)

11.5.6 The Netherlands - Market size and forecast 2024-2029

Chart on The Netherlands - Market size and forecast 2024-2029 ($ million)
Data Table on The Netherlands - Market size and forecast 2024-2029 ($ million)
Chart on The Netherlands - Year-over-year growth 2024-2029 (%)
Data Table on The Netherlands - Year-over-year growth 2024-2029 (%)

11.6 Middle East and Africa - Market size and forecast 2024-2029

Chart on Middle East and Africa - Market size and forecast 2024-2029 ($ million)
Data Table on Middle East and Africa - Market size and forecast 2024-2029 ($ million)
Chart on Middle East and Africa - Year-over-year growth 2024-2029 (%)
Data Table on Middle East and Africa - Year-over-year growth 2024-2029 (%)
Chart on Regional Comparison - Middle East and Africa
Data Table on Regional Comparison - Middle East and Africa

11.6.1 Saudi Arabia - Market size and forecast 2024-2029

Chart on Saudi Arabia - Market size and forecast 2024-2029 ($ million)
Data Table on Saudi Arabia - Market size and forecast 2024-2029 ($ million)
Chart on Saudi Arabia - Year-over-year growth 2024-2029 (%)
Data Table on Saudi Arabia - Year-over-year growth 2024-2029 (%)

11.6.2 UAE - Market size and forecast 2024-2029

Chart on UAE - Market size and forecast 2024-2029 ($ million)
Data Table on UAE - Market size and forecast 2024-2029 ($ million)
Chart on UAE - Year-over-year growth 2024-2029 (%)
Data Table on UAE - Year-over-year growth 2024-2029 (%)

11.6.3 South Africa - Market size and forecast 2024-2029

Chart on South Africa - Market size and forecast 2024-2029 ($ million)
Data Table on South Africa - Market size and forecast 2024-2029 ($ million)
Chart on South Africa - Year-over-year growth 2024-2029 (%)
Data Table on South Africa - Year-over-year growth 2024-2029 (%)

11.6.4 Israel - Market size and forecast 2024-2029

Chart on Israel - Market size and forecast 2024-2029 ($ million)
Data Table on Israel - Market size and forecast 2024-2029 ($ million)
Chart on Israel - Year-over-year growth 2024-2029 (%)
Data Table on Israel - Year-over-year growth 2024-2029 (%)

11.6.5 Turkey - Market size and forecast 2024-2029

Chart on Turkey - Market size and forecast 2024-2029 ($ million)
Data Table on Turkey - Market size and forecast 2024-2029 ($ million)
Chart on Turkey - Year-over-year growth 2024-2029 (%)
Data Table on Turkey - Year-over-year growth 2024-2029 (%)

11.7 South America - Market size and forecast 2024-2029

Chart on South America - Market size and forecast 2024-2029 ($ million)
Data Table on South America - Market size and forecast 2024-2029 ($ million)
Chart on South America - Year-over-year growth 2024-2029 (%)
Data Table on South America - Year-over-year growth 2024-2029 (%)
Chart on Regional Comparison - South America
Data Table on Regional Comparison - South America

11.7.1 Brazil - Market size and forecast 2024-2029

Chart on Brazil - Market size and forecast 2024-2029 ($ million)
Data Table on Brazil - Market size and forecast 2024-2029 ($ million)
Chart on Brazil - Year-over-year growth 2024-2029 (%)
Data Table on Brazil - Year-over-year growth 2024-2029 (%)

11.7.2 Argentina - Market size and forecast 2024-2029

Chart on Argentina - Market size and forecast 2024-2029 ($ million)
Data Table on Argentina - Market size and forecast 2024-2029 ($ million)
Chart on Argentina - Year-over-year growth 2024-2029 (%)
Data Table on Argentina - Year-over-year growth 2024-2029 (%)

11.7.3 Colombia - Market size and forecast 2024-2029

Chart on Colombia - Market size and forecast 2024-2029 ($ million)
Data Table on Colombia - Market size and forecast 2024-2029 ($ million)
Chart on Colombia - Year-over-year growth 2024-2029 (%)
Data Table on Colombia - Year-over-year growth 2024-2029 (%)

11.8 Market opportunity by geography

Market opportunity by geography ($ million)
Data Tables on Market opportunity by geography ($ million)

12. Drivers, Challenges, and Opportunity

12.1 Market drivers

Growing demand for enhanced connectivity for industry 4.0 and mission-critical applications
Increased need for network control, security, and data sovereignty
Favorable spectrum allocation policies and technology maturation

12.2 Market challenges

High initial cost and complex return on investment justification
Operational complexity and scarcity of specialized skills
Fragmented spectrum landscape and regulatory complexity

12.3 Impact of drivers and challenges

Impact of drivers and challenges in 2024 and 2029

12.4 Market opportunities

Rise of network-as-a-service and managed service models
Convergence of information technology, operational technology, and telecommunications ecosystems
Integration of private 5g with Wi-Fi and proliferation of edge computing

13. Competitive Landscape

13.1 Overview

13.2

Overview on criticality of inputs and factors of differentiation

13.3 Landscape disruption

Overview on factors of disruption

13.4 Industry risks

Impact of key risks on business

14. Competitive Analysis

14.1 Companies profiled

Companies covered

14.2 Company ranking index

14.3 Market positioning of companies

Matrix on companies position and classification

14.4 AT and T Inc.

AT and T Inc. - Overview
AT and T Inc. - Business segments
AT and T Inc. - Key news
AT and T Inc. - Key offerings
AT and T Inc. - Segment focus
SWOT

14.5 Cisco Systems Inc.

Cisco Systems Inc. - Overview
Cisco Systems Inc. - Business segments
Cisco Systems Inc. - Key news
Cisco Systems Inc. - Key offerings
Cisco Systems Inc. - Segment focus
SWOT

14.6 CommScope Holding

CommScope Holding - Overview
CommScope Holding - Business segments
CommScope Holding - Key news
CommScope Holding - Key offerings
CommScope Holding - Segment focus
SWOT

14.7 Hewlett Packard

Hewlett Packard - Overview
Hewlett Packard - Business segments
Hewlett Packard - Key news
Hewlett Packard - Key offerings
Hewlett Packard - Segment focus
SWOT

14.8 Huawei Technologies Co. Ltd.

Huawei Technologies Co. Ltd. - Overview
Huawei Technologies Co. Ltd. - Product / Service
Huawei Technologies Co. Ltd. - Key news
Huawei Technologies Co. Ltd. - Key offerings
SWOT

14.9 Juniper Networks Inc.

Juniper Networks Inc. - Overview
Juniper Networks Inc. - Product / Service
Juniper Networks Inc. - Key news
Juniper Networks Inc. - Key offerings
SWOT

14.10 Mavenir Systems Inc.

Mavenir Systems Inc. - Overview
Mavenir Systems Inc. - Product / Service
Mavenir Systems Inc. - Key offerings
SWOT

14.11 Microsoft Corp.

Microsoft Corp. - Overview
Microsoft Corp. - Business segments
Microsoft Corp. - Key news
Microsoft Corp. - Key offerings
Microsoft Corp. - Segment focus
SWOT

14.12 NEC Corp.

NEC Corp. - Overview
NEC Corp. - Business segments
NEC Corp. - Key news
NEC Corp. - Key offerings
NEC Corp. - Segment focus
SWOT

14.13 Nokia Corp.

Nokia Corp. - Overview
Nokia Corp. - Business segments
Nokia Corp. - Key news
Nokia Corp. - Key offerings
Nokia Corp. - Segment focus
SWOT

14.14 Qualcomm Inc.

Qualcomm Inc. - Overview
Qualcomm Inc. - Business segments
Qualcomm Inc. - Key news
Qualcomm Inc. - Key offerings
Qualcomm Inc. - Segment focus
SWOT

14.15 Samsung Electronics Co. Ltd.

Samsung Electronics Co. Ltd. - Overview
Samsung Electronics Co. Ltd. - Business segments
Samsung Electronics Co. Ltd. - Key news
Samsung Electronics Co. Ltd. - Key offerings
Samsung Electronics Co. Ltd. - Segment focus
SWOT

14.16 Telefonaktiebolaget Ericsson

Telefonaktiebolaget Ericsson - Overview
Telefonaktiebolaget Ericsson - Business segments
Telefonaktiebolaget Ericsson - Key news
Telefonaktiebolaget Ericsson - Key offerings
Telefonaktiebolaget Ericsson - Segment focus
SWOT

14.17 Verizon Communications Inc.

Verizon Communications Inc. - Overview
Verizon Communications Inc. - Business segments
Verizon Communications Inc. - Key news
Verizon Communications Inc. - Key offerings
Verizon Communications Inc. - Segment focus
SWOT

14.18 ZTE Corp.

ZTE Corp. - Overview
ZTE Corp. - Business segments
ZTE Corp. - Key offerings
ZTE Corp. - Segment focus
SWOT

15. Appendix

15.1 Scope of the report

Market definition
Objectives
Notes and caveats

15.2 Inclusions and exclusions checklist

Inclusions checklist
Exclusions checklist

15.3 Currency conversion rates for US$

15.4 Research methodology

15.5 Data procurement

Information sources

15.6 Data validation

15.7 Validation techniques employed for market sizing

15.8 Data synthesis

15.9 360 degree market analysis

15.10 List of abbreviations

Research Methodology

Technavio presents a detailed picture of the market by way of study, synthesis, and summation of data from multiple sources. The analysts have presented the various facets of the market with a particular focus on identifying the key industry influencers. The data thus presented is comprehensive, reliable, and the result of extensive research, both primary and secondary.

INFORMATION SOURCES

Primary sources

  • Manufacturers and suppliers
  • Channel partners
  • Industry experts
  • Strategic decision makers

Secondary sources

  • Industry journals and periodicals
  • Government data
  • Financial reports of key industry players
  • Historical data
  • Press releases

DATA ANALYSIS

Data Synthesis

  • Collation of data
  • Estimation of key figures
  • Analysis of derived insights

Data Validation

  • Triangulation with data models
  • Reference against proprietary databases
  • Corroboration with industry experts

REPORT WRITING

Qualitative

  • Market drivers
  • Market challenges
  • Market trends
  • Five forces analysis

Quantitative

  • Market size and forecast
  • Market segmentation
  • Geographical insights
  • Competitive landscape

Interested in this report?

Get your sample now to see our research methodology and insights!

Download Now

Frequently Asked Questions

Private 5g market growth will increase by USD 10411.5 million during 2025-2029 .

The Private 5g market is expected to grow at a CAGR of 38.7% during 2025-2029 .

Private 5g market is segmented by Component (Hardware, Services, Software) Type (Licensed, Shared) Frequency range (Mid, mmWave, Low)

Airspan Networks Inc., AT and T Inc., Celona Inc., Ciena Corp., Cisco Systems Inc., CommScope Holding, Hewlett Packard, Huawei Technologies Co. Ltd., Juniper Networks Inc., Mavenir Systems Inc., Microsoft Corp., NEC Corp., Nokia Corp., Qualcomm Inc., Samsung Electronics Co. Ltd., Telefonaktiebolaget Ericsson, Verizon Communications Inc., ZTE Corp. are a few of the key vendors in the Private 5g market.

APAC will register the highest growth rate of 38.7% among the other regions. Therefore, the Private 5g market in APAC is expected to garner significant business opportunities for the vendors during the forecast period.

China, Japan, South Korea, India, Australia, Indonesia, US, Canada, Mexico, Germany, UK, France, Italy, Spain, The Netherlands, Saudi Arabia, UAE, South Africa, Israel, Turkey, Brazil, Argentina, Colombia

  • Growing demand for enhanced connectivity for industry 4.0 and mission-critical applications is the driving factor this market.

The Private 5g market vendors should focus on grabbing business opportunities from the Component segment as it accounted for the largest market share in the base year.