
Private Ai Infrastructure Market Size and Growth Forecast 2026-2030
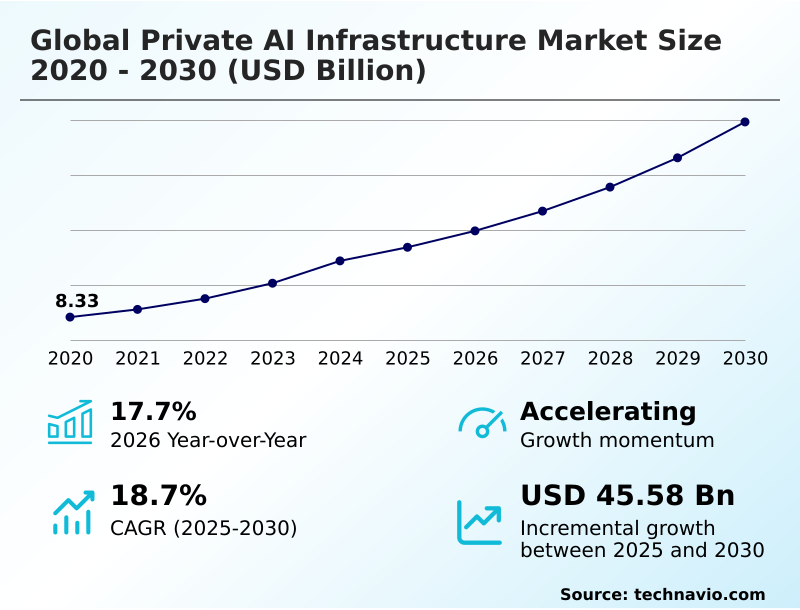
The Private Ai Infrastructure Market size was valued at USD 33.72 billion in 2025 growing at a CAGR of 18.7% during the forecast period 2026-2030.
North America accounts for 41.4% of incremental growth during the forecast period. The Hardware segment by Component was valued at USD 18.37 billion in 2024, while the On-premises segment holds the largest revenue share by Deployment.
The market is projected to grow by USD 70.97 billion from 2020 to 2030, with USD 45.58 billion of the growth expected during the forecast period of 2025 to 2030.
Get Key Insights on Market Forecast (PDF) Request Free Sample
Private Ai Infrastructure Market Overview
The private AI infrastructure market is fundamentally shaped by the enterprise mandate for data sovereignty and computational control. With North America accounting for over 41% of demand, the repatriation of AI workloads to on-premises data centers is a strategic response to stringent regulatory compliance and the need to protect intellectual property. Organizations are building bespoke environments with custom silicon accelerators and high-throughput networking to optimize proprietary deep learning models. For instance, a financial institution implementing private AI for high-frequency trading will construct a dedicated facility using air-gapped networks to achieve low-latency inference, ensuring its algorithmic trading strategies remain confidential and compliant with financial oversight bodies like the SEC. This shift away from shared public resources underscores a focus on long-term total cost of ownership, where predictable capital expenditure on AI hardware procurement is preferred over the variable costs and data egress fees of cloud services, especially for generative AI applications that demand continuous model training.
Drivers, Trends, and Challenges in the Private Ai Infrastructure Market
The strategic shift toward localized computational systems is driven by the need to balance performance with compliance, fundamentally altering procurement decisions in the private AI infrastructure market. Stricter data sovereignty in AI infrastructure, mandated by regulations like the EU's GDPR, compels organizations to explore on-premises AI in healthcare and secure AI for government defense, where data cannot leave jurisdictional boundaries.
This has created a competitive landscape where enterprises evaluate specific solutions like Dell AI Factory solutions against integrated services such as HPE GreenLake for LLMs. For high-density computing needs, the focus is on specialized hardware, including full-stack NVIDIA DGX for private AI and efficient liquid cooling for AI data centers.
The decision-making process for private AI for financial services now deeply considers AI hardware customization benefits, as bespoke silicon accelerators can provide a critical edge.
Across industries, from edge computing for manufacturing to managing complex hybrid cloud AI workload management, the primary goal is reducing AI total cost of ownership by eliminating the variable expenses and data egress fees common to public clouds.
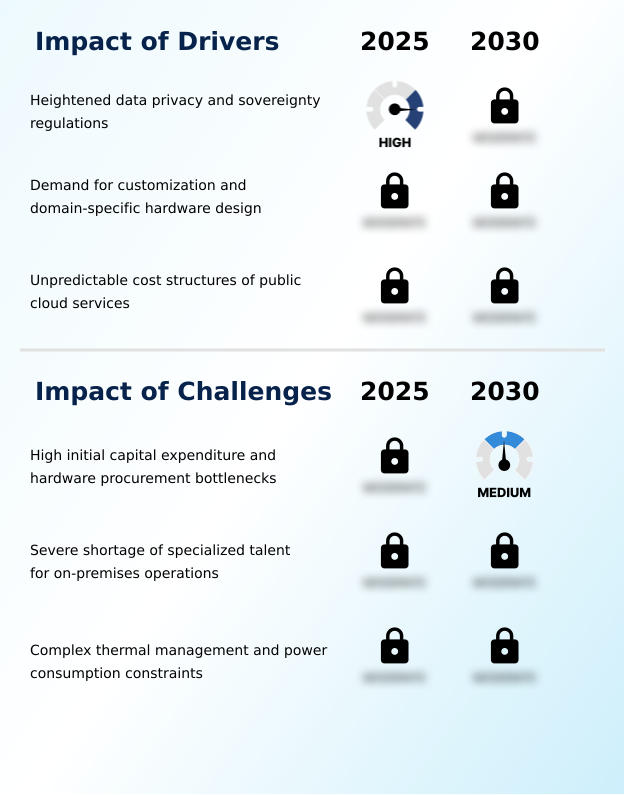
Primary Growth Driver: The market is primarily driven by heightened data privacy and sovereignty regulations, compelling enterprises to adopt secure, localized infrastructure.
Market growth is predominantly driven by the non-negotiable enterprise requirements for data security and cost predictability.
Heightened data sovereignty laws, such as the EU's GDPR, are compelling organizations to pursue AI workload repatriation to maintain regulatory compliance and ensure robust intellectual property protection.
This move to private infrastructure allows for extreme AI hardware customization, enabling companies to achieve bare-metal performance for specialized tasks like high-frequency trading, a level of optimization not possible with the generic instances and virtualization tax of public clouds.
Furthermore, enterprises are seeking to escape the unpredictable operational expenditures and punitive data egress fees associated with hyperscale services.
By transitioning to a capital expenditure model, companies achieve a more stable and often lower long-term total cost of ownership for sustained, high-intensity AI workloads.
Emerging Market Trend: The proliferation of edge AI processing is a defining market trend, involving the decentralization of computational resources to reduce latency for industrial applications.
Key market trends are centered on managing the increasing computational density of AI workloads. The decentralization of compute through edge AI processing is critical for industrial applications requiring low-latency inference. This architectural shift is essential for use cases like autonomous robotics and real-time quality inspection on manufacturing floors.
Concurrently, the immense heat generated by high-density silicon accelerators is making advanced liquid cooling technologies a standard requirement, moving beyond traditional air-based systems. To manage these distributed and complex environments, enterprises are adopting hybrid AI orchestration frameworks.
These platforms enable the dynamic allocation of resources across on-premises data centers and private cloud environments, ensuring that containerized models and other machine learning frameworks are deployed efficiently, maximizing both performance and hardware utilization.
Key Industry Challenge: Significant challenges affecting industry growth include high initial capital expenditure and persistent hardware procurement bottlenecks.
The market faces significant constraints, primarily the substantial capital expenditure required for AI hardware procurement and persistent semiconductor supply chain bottlenecks. The high upfront cost of graphics processing units and other specialized components is a major barrier for many organizations. Beyond financial hurdles, the physical realities of deployment present formidable challenges.
The high thermal design power of modern processors, with single racks drawing over 100 kilowatts, necessitates expensive data center retrofitting to handle power consumption constraints and implement advanced liquid cooling technologies. Furthermore, a severe shortage of specialized engineering talent capable of managing these complex, high-density environments slows down deployment and optimization, restraining overall market expansion.
Explore Full Market Dynamics Analysis Request Free Sample
Private Ai Infrastructure Market Segmentation
The private ai infrastructure industry research report provides comprehensive data including region-wise segment analysis, with forecasts and analysis for the period 2026-2030, as well as historical data from 2020-2024 for the following segments.
Component Segment Analysis
The hardware segment is estimated to witness significant growth during the forecast period.
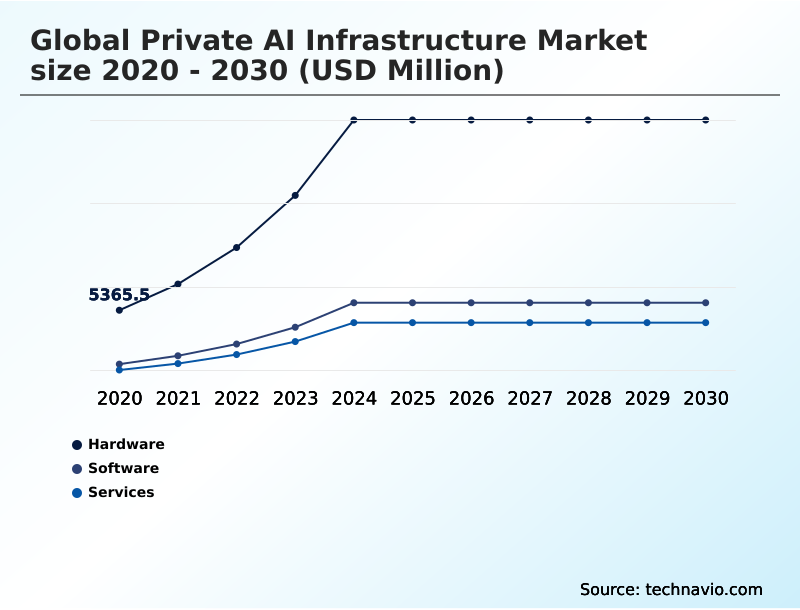
The hardware segment constitutes the physical foundation of the private AI infrastructure market, where organizations invest in specialized compute resources for deep learning. This includes graphics processing units, tensor processing units, and other silicon accelerators essential for parallel processing.
Beyond compute, this category includes high performance memory, advanced enterprise storage, and high-throughput networking to ensure data moves without bottlenecks.
As organizations build out on-premises data centers, procurement decisions are increasingly dictated by the thermal design power of processors, driving adoption of advanced liquid cooling technologies.
This hardware-centric approach, which accounted for over 60% of the market in 2024, grants enterprises absolute control over their proprietary data and algorithmic assets, which is essential for maintaining regulatory compliance.
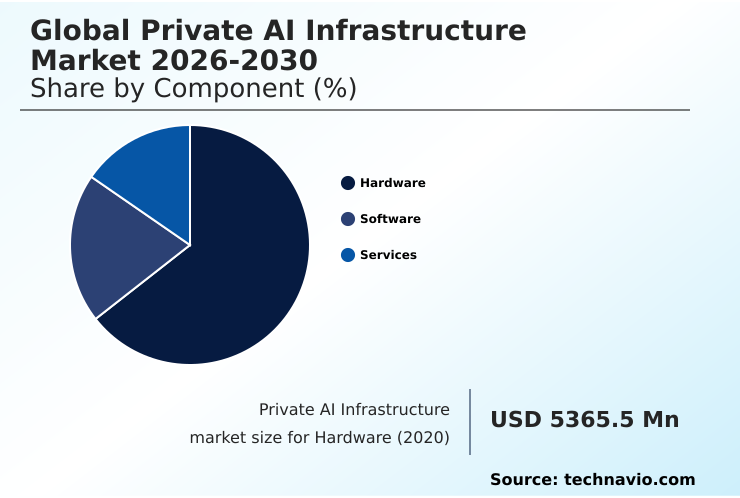
The Hardware segment was valued at USD 18.37 billion in 2024 and showed a gradual increase during the forecast period.
Private Ai Infrastructure Market by Region: North America Leads with 41.4% Growth Share
North America is estimated to contribute 41.4% to the growth of the global market during the forecast period.
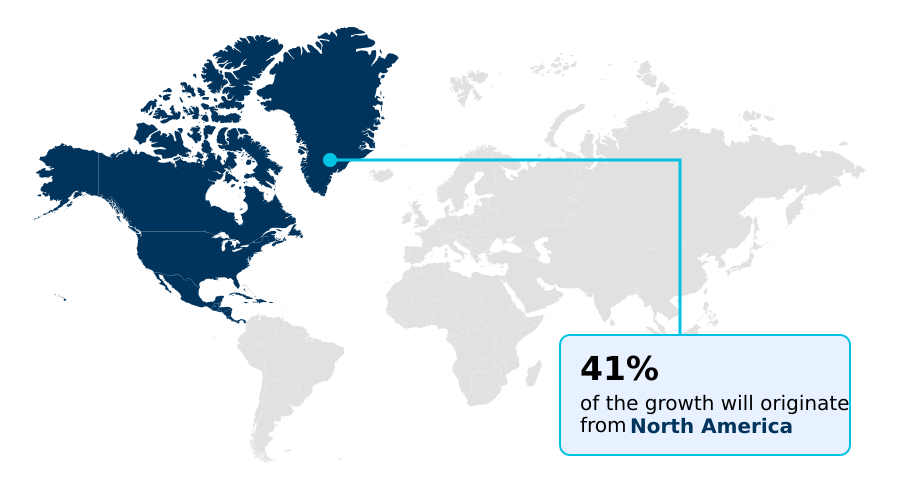
The geographic landscape of the private AI infrastructure market is led by North America, which accounts for over 41% of the market, driven by its advanced technology ecosystem and significant capital investment in on-premises data centers.
Europe, contributing around 25%, prioritizes data sovereignty laws and sustainability, which accelerates the adoption of efficient liquid cooling technologies in its data centers.
The APAC region, representing approximately 23.5% of the market, is experiencing rapid growth fueled by government-led industrialization and a focus on technological autonomy for applications like sovereign defense operations and smart city development.
Across all regions, the common thread is the increasing need for data governance and secure private cloud environments to handle sensitive workloads, from genomic sequencing in European healthcare to financial modeling in North American banks.
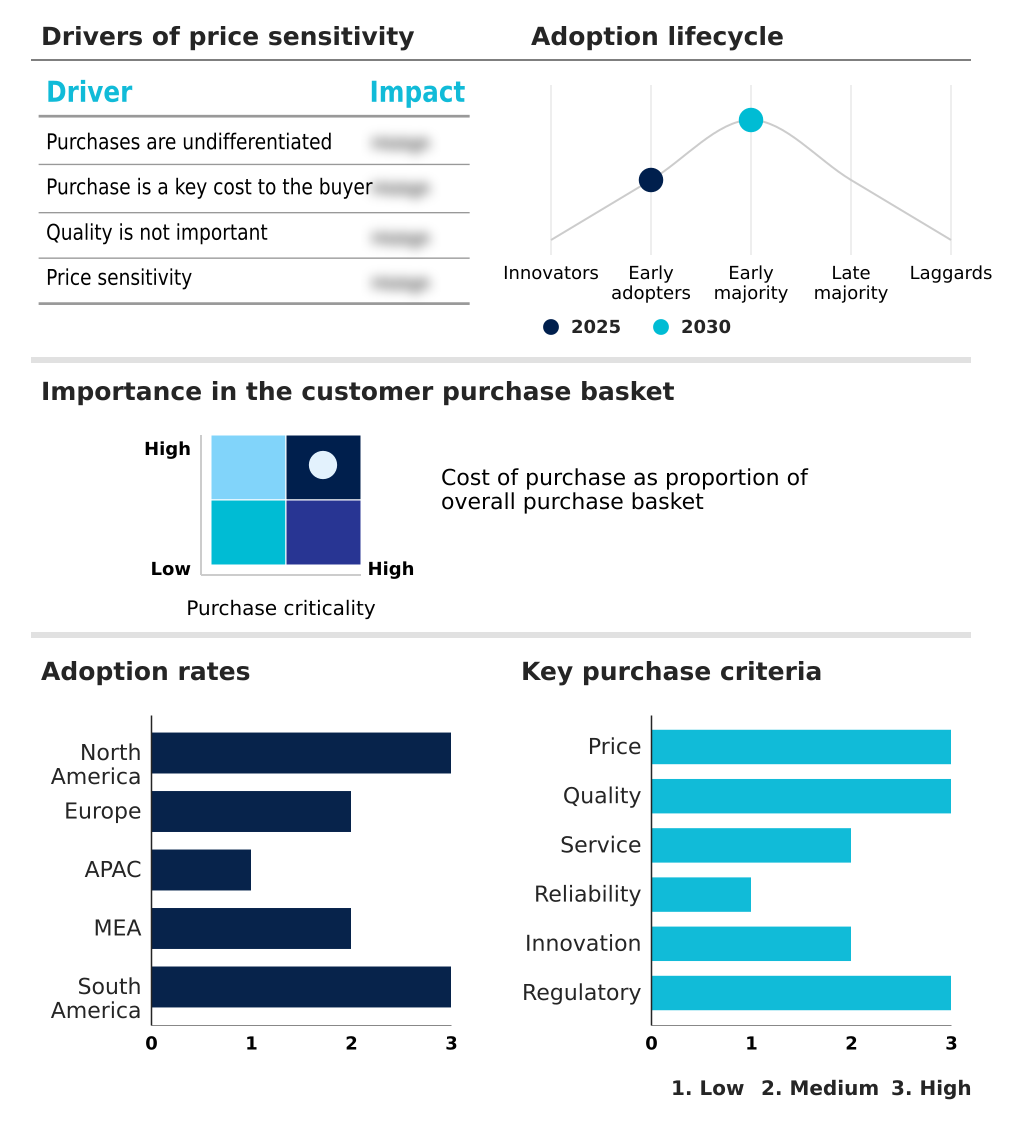
Customer Landscape Analysis for the Private Ai Infrastructure Market
The private ai infrastructure market forecasting report includes the adoption lifecycle of the market, covering from the innovator’s stage to the laggard’s stage. It focuses on adoption rates in different regions based on penetration. Furthermore, the private ai infrastructure market report also includes key purchase criteria and drivers of price sensitivity to help companies evaluate and develop their market growth analysis strategies.
Competitive Landscape of the Private Ai Infrastructure Market
Companies are implementing various strategies, such as strategic alliances, partnerships, mergers and acquisitions, geographical expansion, and product/service launches, to enhance their presence in the private ai infrastructure market industry.
Amazon.com Inc. - Key vendors deliver validated, full-stack AI infrastructure, enabling secure, on-premises machine learning deployments with enterprise-grade control and performance.
The industry research and growth report includes detailed analyses of the competitive landscape of the market and information about key companies, including:
- Amazon.com Inc.
- Broadcom Inc.
- C3.ai Inc.
- Cerebras
- Cisco Systems Inc.
- Cloudera Inc.
- Databricks Inc.
- Dell Technologies Inc.
- Google LLC
- Hewlett Packard Enterprise Co.
- IBM Corp.
- Microsoft Corp.
- NetApp Inc.
- Nutanix Inc.
- NVIDIA Corp.
- Oracle Corp.
- Palantir Technologies Inc.
- Pure Storage Inc.
- SambaNova Systems Inc.
- Vast Data
Qualitative and quantitative analysis of companies has been conducted to help clients understand the wider business environment as well as the strengths and weaknesses of key industry players. Data is qualitatively analyzed to categorize companies as pure play, category-focused, industry-focused, and diversified; it is quantitatively analyzed to categorize companies as dominant, leading, strong, tentative, and weak.
Recent Developments in the Private Ai Infrastructure Market
- In January 2025, Microsoft Corp. announced a USD 3 billion investment in cloud and AI infrastructure in India, aimed at accelerating AI adoption, advancing digital skills development, and fostering innovation across the country.
- In January 2025, Stargate LLC announced plans to invest USD 500 billion to build advanced AI infrastructure for OpenAI in the United States, representing a monumental push for large-scale computational power.
- In November 2024, Hewlett Packard Enterprise Co. announced a strategic partnership with a major European automotive consortium to deploy HPE GreenLake for LLMs across multiple production facilities in Germany, enabling real-time predictive maintenance and autonomous manufacturing.
- In April 2025, Dell Technologies Inc. launched its new AI Factory validated design, featuring next-generation PowerEdge servers and PowerScale storage, optimized for secure, on-premises generative AI workloads for the financial services sector in North America.
Research Analyst Overview: Private Ai Infrastructure Market
The decision to repatriate AI workloads to on-premises data centers has become a central element of corporate risk management, moving beyond a purely technical choice. Boardroom discussions now focus on the total cost of ownership, with CFOs weighing the significant capital expenditure of AI hardware procurement against the unpredictable operational costs and data egress fees of public cloud services.
Compliance with data sovereignty laws, such as the EU's GDPR, is a primary driver, making AI workload repatriation a non-negotiable for many multinationals. This is reflected in market composition, where the hardware segment, comprising assets like graphics processing units and enterprise-grade storage, accounts for over 60% of total investment.
Enterprises are now building out comprehensive MLOps platforms on private infrastructure, carefully managing factors like the thermal design power of new silicon accelerators to ensure long-term operational viability and security.
Dive into Technavio’s robust research methodology, blending expert interviews, extensive data synthesis, and validated models for unparalleled Private Ai Infrastructure Market insights. See full methodology.
| Market Scope | |
|---|---|
| Page number | 296 |
| Base year | 2025 |
| Historic period | 2020-2024 |
| Forecast period | 2026-2030 |
| Growth momentum & CAGR | Accelerate at a CAGR of 18.7% |
| Market growth 2026-2030 | USD 45577.8 million |
| Market structure | Fragmented |
| YoY growth 2025-2026(%) | 17.7% |
| Key countries | US, Canada, Mexico, Germany, UK, France, The Netherlands, Italy, Spain, China, Japan, India, South Korea, Australia, Indonesia, UAE, Saudi Arabia, Israel, South Africa, Qatar, Brazil, Argentina and Chile |
| Competitive landscape | Leading Companies, Market Positioning of Companies, Competitive Strategies, and Industry Risks |
Private Ai Infrastructure Market: Key Questions Answered in This Report
-
What is the expected growth of the Private Ai Infrastructure Market between 2026 and 2030?
-
The Private Ai Infrastructure Market is expected to grow by USD 45.58 billion during 2026-2030, registering a CAGR of 18.7%. Year-over-year growth in 2026 is estimated at 17.7%%. This acceleration is shaped by heightened data privacy and sovereignty regulations, which is intensifying demand across multiple end-use verticals covered in the report.
-
-
What segmentation does the market report cover?
-
The report is segmented by Component (Hardware, Software, and Services), Deployment (On-premises, Hybrid, and Private cloud), End-user (Large enterprises, and SMEs) and Geography (North America, Europe, APAC, Middle East and Africa, South America). Among these, the Hardware segment is estimated to witness significant growth during the forecast period, driven by rising adoption across key application areas. Each segment includes detailed qualitative and quantitative analysis, along with historical data from 2020-2024 and forecasts through 2030 with year-over-year growth rates.
-
-
Which regions are analyzed in the report?
-
The report covers North America, Europe, APAC, Middle East and Africa and South America. North America is estimated to contribute 41.4% to market growth during the forecast period. Country-level analysis includes US, Canada, Mexico, Germany, UK, France, The Netherlands, Italy, Spain, China, Japan, India, South Korea, Australia, Indonesia, UAE, Saudi Arabia, Israel, South Africa, Qatar, Brazil, Argentina and Chile, with dedicated market size tables and year-over-year growth for each.
-
-
What are the key growth drivers and market challenges?
-
The primary driver is heightened data privacy and sovereignty regulations, which is accelerating investment and industry demand. The main challenge is high initial capital expenditure and hardware procurement bottlenecks, creating operational barriers for key market participants. The report quantifies the impact of each driver and challenge across 2026 and 2030 with comparative analysis.
-
-
Who are the major players in the Private Ai Infrastructure Market?
-
Key vendors include Amazon.com Inc., Broadcom Inc., C3.ai Inc., Cerebras, Cisco Systems Inc., Cloudera Inc., Databricks Inc., Dell Technologies Inc., Google LLC, Hewlett Packard Enterprise Co., IBM Corp., Microsoft Corp., NetApp Inc., Nutanix Inc., NVIDIA Corp., Oracle Corp., Palantir Technologies Inc., Pure Storage Inc., SambaNova Systems Inc. and Vast Data. The report provides qualitative and quantitative analysis categorizing companies as dominant, leading, strong, tentative, and weak based on their market positioning. Company profiles include business segment analysis, SWOT assessment, key offerings, and recent strategic developments.
-
Private Ai Infrastructure Market Research Insights
Strict data governance frameworks, such as the EU's GDPR and India's Digital Personal Data Protection Act, are forcing enterprises to re-evaluate their infrastructure strategy, prioritizing intellectual property protection and regulatory compliance. This shift is driving investments in AI-ready infrastructure that supports specialized workloads like predictive maintenance in manufacturing and large language models in finance.
The market's composition reflects this, with the Hardware segment's contribution being more than double that of the Software and Services segments combined. In practice, an automotive manufacturer will deploy autonomous robotics on a private edge network to ensure operational continuity and data security, a strategy that is becoming standard for industries where real-time processing and data confidentiality are paramount.
This controlled approach is essential for scaling AI capabilities securely.
We can help! Our analysts can customize this private ai infrastructure market research report to meet your requirements.
 RIA -
RIA - 
