
Public Cloud Services Market Size 2026-2030
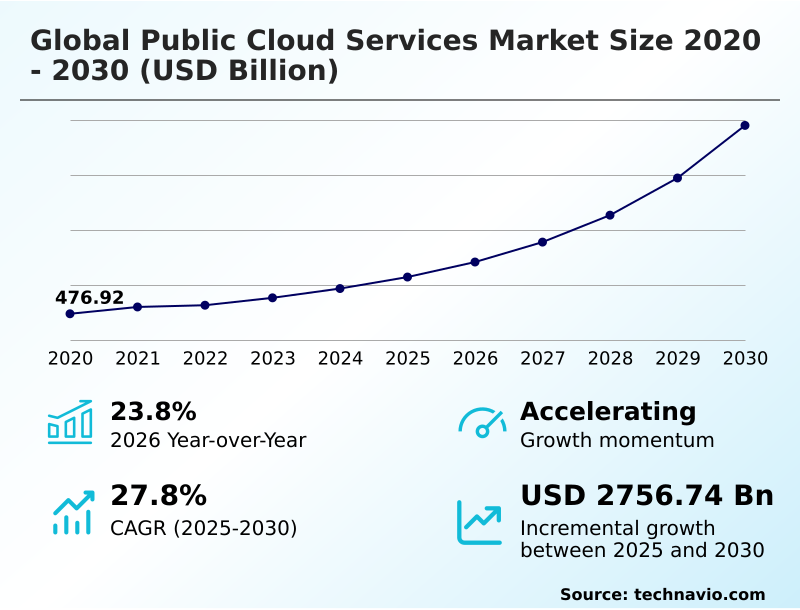
The public cloud services market size is valued to increase by USD 2,756.74 billion, at a CAGR of 27.8% from 2025 to 2030. Strategic mandate for sovereign cloud and regional data governance will drive the public cloud services market.
Major Market Trends & Insights
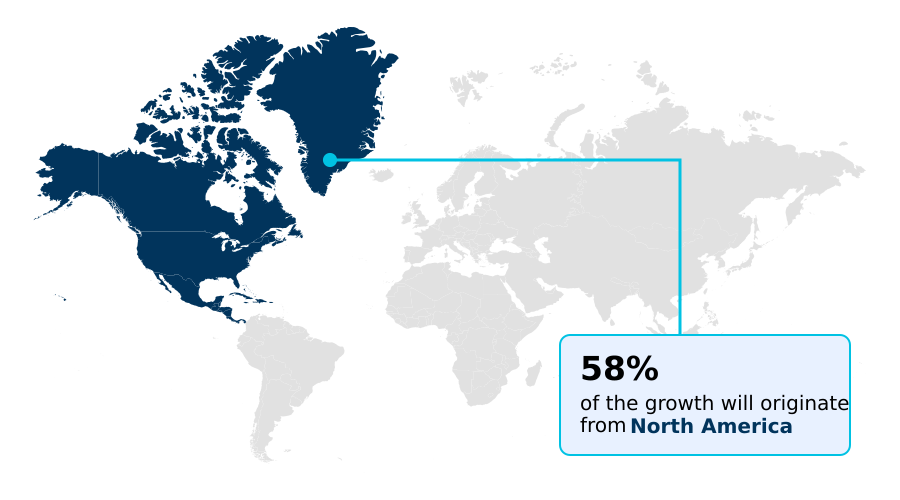
- North America dominated the market and accounted for a 58.2% growth during the forecast period.
- By Service - SaaS segment was valued at USD 577.97 billion in 2024
- By Type - SMEs segment accounted for the largest market revenue share in 2024
Market Size & Forecast
- Market Opportunities: USD 3,424.53 billion
- Market Future Opportunities: USD 2,756.74 billion
- CAGR from 2025 to 2030 : 27.8%
Market Summary
- The public cloud services market is undergoing a significant transformation, moving beyond foundational infrastructure to become the core of modern enterprise operations. This evolution is driven by the demand for high-performance computing (HPC) to power AI workload acceleration and advanced analytics.
- Key trends include the institutionalization of FinOps for cloud cost optimization and the pivot to sustainable-by-design operations, where carbon-aware scheduling is a key architectural consideration. However, this progress is met with challenges, notably the technical proficiency gap and the high operational costs associated with workload scaling for generative AI.
- Regulatory fragmentation further complicates multi-cloud architecture deployments, pushing for solutions like verticalized sovereign solutions. For instance, in manufacturing, firms leverage cloud-native architecture with digital twins for supply chain optimization, integrating real-time data from IoT devices to predict maintenance needs and improve operational efficiency. This shift requires a robust cloud migration strategy focused on IT infrastructure modernization, balancing innovation with governance.
- The reliance on managed Kubernetes service and serverless functions exemplifies the move toward abstracting complexity, allowing businesses to focus on application logic rather than underlying infrastructure management. This dynamic landscape necessitates a focus on cloud workload optimization and automated governance to maximize ROI.
What will be the Size of the Public Cloud Services Market during the forecast period?
Get Key Insights on Market Forecast (PDF) Get Free Sample
How is the Public Cloud Services Market Segmented?
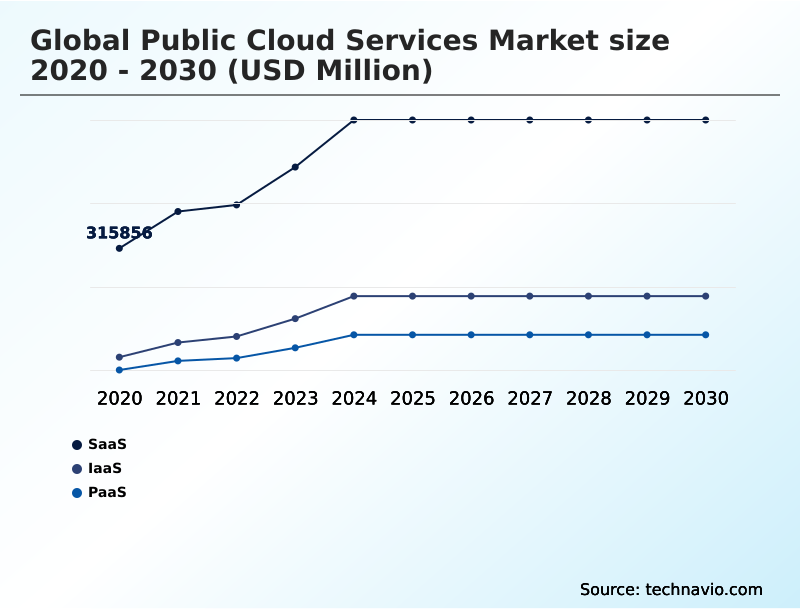
The public cloud services industry research report provides comprehensive data (region-wise segment analysis), with forecasts and estimates in "USD million" for the period 2026-2030, as well as historical data from 2020-2024 for the following segments.
- Service
- SaaS
- IaaS
- PaaS
- Type
- SMEs
- Large enterprise
- Application
- Collaboration and productivity suites
- Analytics and AI services
- CRM
- ERP
- Others
- Geography
- North America
- US
- Canada
- Mexico
- Europe
- UK
- Germany
- France
- APAC
- China
- Japan
- India
- South America
- Brazil
- Argentina
- Middle East and Africa
- UAE
- Saudi Arabia
- South Africa
- Rest of World (ROW)
- North America
By Service Insights
The saas segment is estimated to witness significant growth during the forecast period.
The Software as a Service (SaaS) segment leads enterprise cloud adoption, shifting focus from on-premise licensing to subscription-based models. This transition supports a broader digital transformation initiative, driven by the need for scalable and agile solutions.
The integration of AI-as-a-service (AIaaS) and low-code/no-code platforms within SaaS offerings enhances productivity, while organizations increasingly rely on cloud service brokerage for optimized cloud procurement. Evolving cloud billing models and sophisticated workload management tools are central to cloud cost optimization.
To address regional data governance, providers are developing sovereign cloud capabilities.
This focus on compliance is critical, as a mature SaaS strategy enables businesses to automate workflows using serverless functions, supporting an overall IT infrastructure modernization and achieving operational improvements where over 70% of large enterprises now favor specialized platforms.
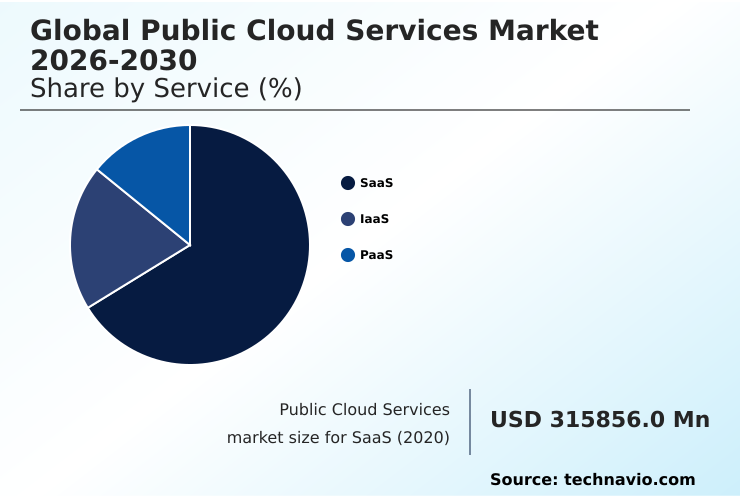
The SaaS segment was valued at USD 577.97 billion in 2024 and showed a gradual increase during the forecast period.
Regional Analysis
North America is estimated to contribute 58.2% to the growth of the global market during the forecast period.Technavio’s analysts have elaborately explained the regional trends and drivers that shape the market during the forecast period.
See How Public Cloud Services Market Demand is Rising in North America Get Free Sample
The geographic landscape of the public cloud services market is increasingly shaped by the digital sovereignty mandate, leading to the geopatriation of data.
North America commands the largest share, contributing over 58% of incremental growth, driven by demand for high-performance computing (HPC).
In Europe, regulatory fragmentation and strict data residency laws compel a hybrid cloud strategy, with an emphasis on data localization and zero-trust security.
The APAC region is the fastest-growing, with a regional CAGR of 28.1%, as enterprises accelerate adoption of containerization and agentic AI meshes.
Across all regions, FinOps and infrastructure-as-code (IaC) are becoming standard for managing cloud resource allocation, highlighting a global push toward operational efficiency and compliance with evolving data governance standards.
Market Dynamics
Our researchers analyzed the data with 2025 as the base year, along with the key drivers, trends, and challenges. A holistic analysis of drivers will help companies refine their marketing strategies to gain a competitive advantage.
- Enterprises are strategically leveraging the public cloud for generative AI, requiring specialized infrastructure that supports both AI model training on cloud platforms and high-throughput inference. The adoption of IaaS for high performance computing is foundational to these efforts. In parallel, there's a strong push for sovereign cloud for public sector applications to meet stringent compliance and data security needs.
- FinOps for multi-cloud environments has become essential for managing costs, with a particular focus on reducing cloud operational expenditure and optimizing data egress charges. Serverless computing cost optimization is another key area, as organizations adopt event-driven architectures.
- Businesses are also migrating core functions, with enterprise resource planning on cloud and customer relationship management cloud integration becoming standard practice to unify data and streamline operations. This approach reduces development cycles by more than a quarter compared to traditional on-premises setups.
- Public cloud services for SMEs are democratizing access to these advanced tools, while hybrid cloud workload portability allows larger firms to balance legacy systems with modern applications. However, organizations face significant cloud native security implementation challenges, making a zero-trust architecture in cloud environments a critical priority.
- Adopting automated cloud governance tools helps manage Kubernetes container orchestration benefits and ensures compliance with managing data residency compliance. The ecosystem is also evolving to support cloud infrastructure for IoT analytics and align with green data center design principles.
What are the key market drivers leading to the rise in the adoption of Public Cloud Services Industry?
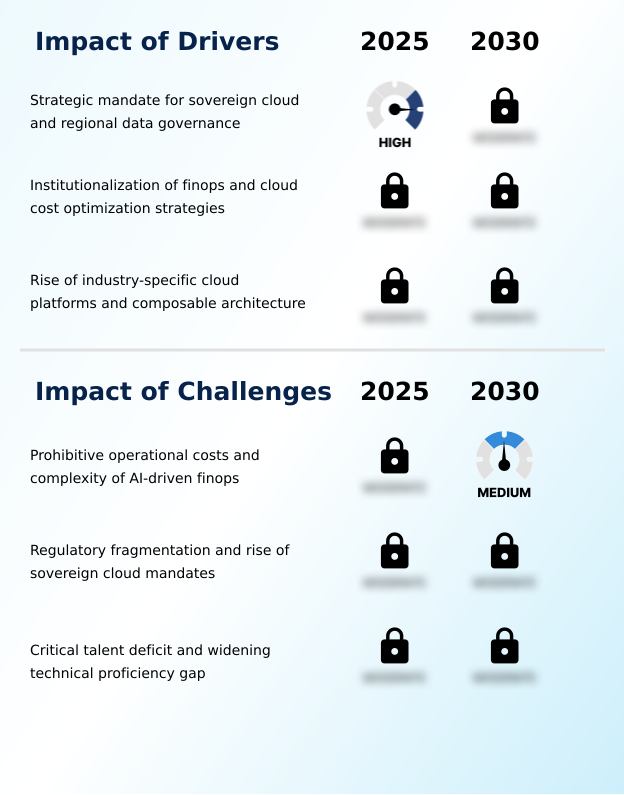
- A key market driver is the strategic mandate for sovereign cloud solutions, which is reinforced by the growing importance of regional data governance frameworks.
- Market growth is driven by the strategic adoption of industry-specific cloud platforms, which now support over 70% of large enterprises' digital transformation initiatives.
- These platforms utilize a composable architecture, enabling businesses to accelerate AI workload acceleration and streamline their DevOps pipeline.
- A key driver is the move from simple cost-cutting to value-based outcomes, where success is measured by metrics like cost per transaction rather than just raw compute hours.
- The use of multi-cloud architecture allows firms to leverage price arbitrage and enhance cloud workload optimization. This sophisticated cloud migration strategy increasingly involves model-as-a-service (MaaS) and managed Kubernetes service offerings.
- Effective workload scaling and adherence to cloud service level agreements (SLAs) are critical, ensuring that infrastructure investments translate directly into business value.
What are the market trends shaping the Public Cloud Services Industry?
- A primary market trend is the acceleration of AI-as-a-Service (AIaaS) adoption. This is coupled with the build-out of agentic computing infrastructure to support autonomous workflows.
- Key market trends reflect a shift toward specialized and responsible computing. The rise of verticalized sovereign solutions addresses regional compliance needs, while the adoption of sustainable-by-design principles is driving investments in green cloud computing. Providers are now offering carbon tracking dashboards, with some making carbon-accounting APIs mandatory for enterprise accounts to promote efficiency.
- This focus has led to a 12% reduction in energy use at some new facilities employing liquid cooling systems. Technologically, the acceleration of AI-PaaS and GPU-as-a-service supports complex workloads like digital twins. To manage these environments, firms are implementing CI/CD automation and compliance-as-code within their distributed cloud infrastructure, enhancing cloud-native security and enabling carbon-aware scheduling for optimized performance.
What challenges does the Public Cloud Services Industry face during its growth?
- A primary challenge affecting market growth is the prohibitive operational cost and inherent complexity associated with implementing and managing AI-driven FinOps.
- Significant challenges temper market expansion, led by escalating operational costs for high-performance computing (HPC) and complex cloud billing models. Inefficient governance results in substantial unallocated waste, which can consume nearly one-third of cloud budgets.
- The complexity of AI-driven FinOps and cloud financial management is compounded by a persistent technical proficiency gap, with the time required to fill specialized cloud security roles increasing by 15% year-on-year. This talent shortage hinders the effective use of serverless architecture patterns and containerization.
- Furthermore, system misconfiguration remains a primary cause of data breaches, while high data egress charges and a scarcity of edge computing nodes add another layer of financial pressure, particularly for organizations deploying globally distributed applications.
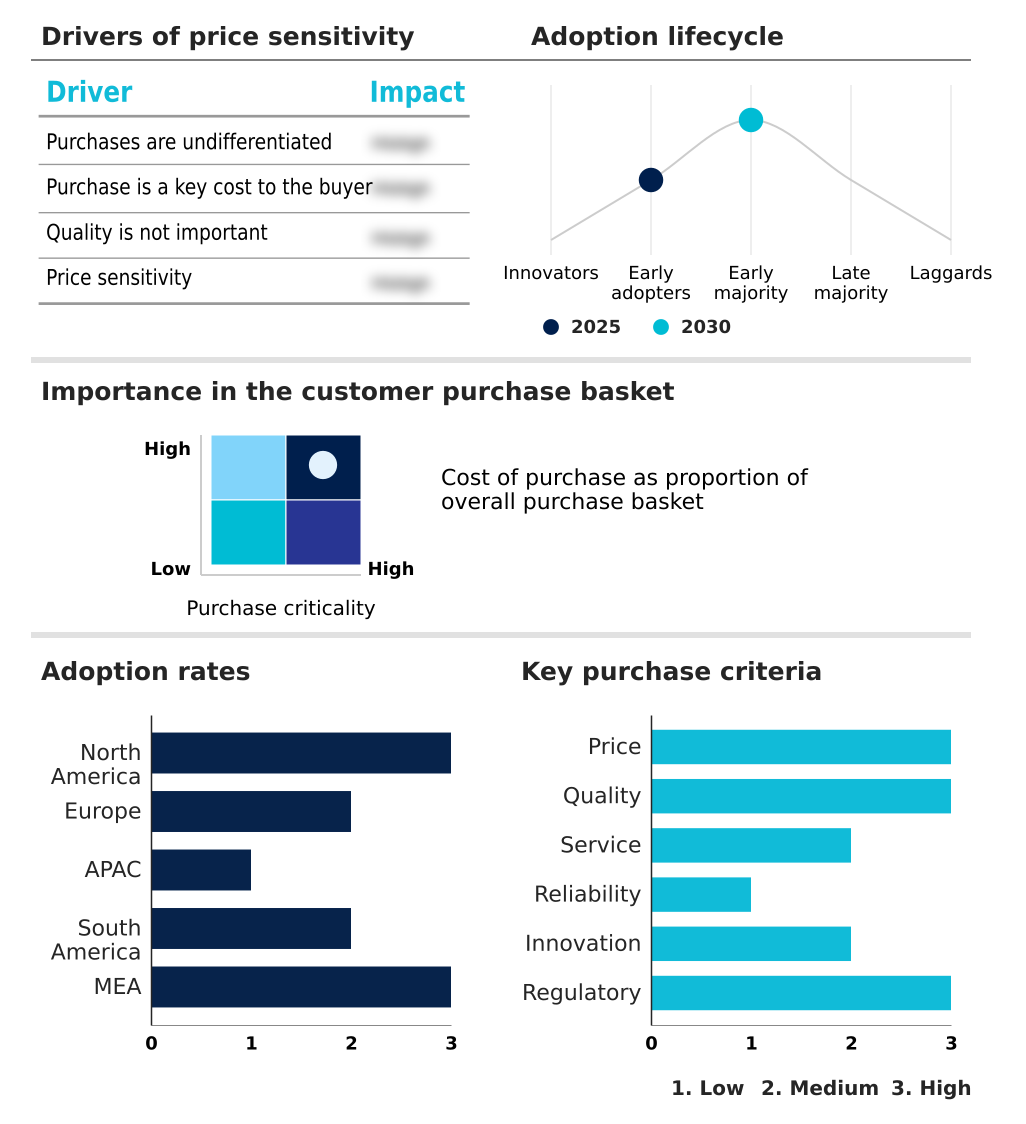
Exclusive Technavio Analysis on Customer Landscape
The public cloud services market forecasting report includes the adoption lifecycle of the market, covering from the innovator’s stage to the laggard’s stage. It focuses on adoption rates in different regions based on penetration. Furthermore, the public cloud services market report also includes key purchase criteria and drivers of price sensitivity to help companies evaluate and develop their market growth analysis strategies.
Customer Landscape of Public Cloud Services Industry
Competitive Landscape
Companies are implementing various strategies, such as strategic alliances, public cloud services market forecast, partnerships, mergers and acquisitions, geographical expansion, and product/service launches, to enhance their presence in the industry.
Akamai Technologies Inc. - Key market solutions integrate core compute capabilities with advanced edge cloud services and a global content delivery network to enhance distributed application performance and security.
The industry research and growth report includes detailed analyses of the competitive landscape of the market and information about key companies, including:
- Akamai Technologies Inc.
- Alibaba Cloud
- Amazon.com Inc.
- DigitalOcean Holdings Inc.
- Google LLC
- Hetzner Online GmbH
- Huawei Technologies Co. Ltd.
- IBM Corp.
- IONOS Inc.
- Linode LLC
- Microsoft Corp.
- Oracle Corp.
- OVH Groupe SA
- Scaleway SAS
- Tencent Holdings Ltd.
- VULTR
- Yandex NV
Qualitative and quantitative analysis of companies has been conducted to help clients understand the wider business environment as well as the strengths and weaknesses of key industry players. Data is qualitatively analyzed to categorize companies as pure play, category-focused, industry-focused, and diversified; it is quantitatively analyzed to categorize companies as dominant, leading, strong, tentative, and weak.
Recent Development and News in Public cloud services market
- In March 2025, Microsoft Corp. announced a strategic partnership with the Government of Kuwait to establish an AI-powered Azure Region, designed to accelerate digital transformation for public sector operations.
- In August 2024, Netgear Inc. completed its acquisition of cybersecurity startup Exium to deliver secure, simplified cloud connectivity solutions tailored for the small and medium-sized enterprise market.
- In November 2024, the United States Department of War awarded Amazon.com Inc. a $581 million contract for Amazon Web Services to supply specialized cloud infrastructure for the Air Force Cloud One Program.
- In January 2025, the National Science Foundation announced a funding opportunity of up to $100 million to create a national network of AI-programmable cloud laboratories to advance automated scientific discovery.
Dive into Technavio’s robust research methodology, blending expert interviews, extensive data synthesis, and validated models for unparalleled Public Cloud Services Market insights. See full methodology.
| Market Scope | |
|---|---|
| Page number | 308 |
| Base year | 2025 |
| Historic period | 2020-2024 |
| Forecast period | 2026-2030 |
| Growth momentum & CAGR | Accelerate at a CAGR of 27.8% |
| Market growth 2026-2030 | USD 2756736.5 million |
| Market structure | Fragmented |
| YoY growth 2025-2026(%) | 23.8% |
| Key countries | US, Canada, Mexico, UK, Germany, France, Italy, Spain, The Netherlands, China, Japan, India, South Korea, Australia, Indonesia, Brazil, Argentina, Chile, UAE, Saudi Arabia, South Africa, Turkey and Egypt |
| Competitive landscape | Leading Companies, Market Positioning of Companies, Competitive Strategies, and Industry Risks |
Research Analyst Overview
- From an analyst perspective, the market is defined by a pivot to specialized, high-value services. The adoption of a composable architecture allows enterprises to build tailored solutions, while a hybrid cloud strategy combined with multi-cloud architecture helps mitigate risk. The rise of the sovereign cloud is a direct response to data residency requirements, leading to the geopatriation of data.
- Technologies like serverless computing, serverless functions, and containerization, often managed through Kubernetes orchestration, are central to building a resilient cloud-native architecture. For AI-centric workloads, demand for GPU-as-a-service, high-performance computing (HPC), AI-PaaS, and model-as-a-service (MaaS) is surging, supporting everything from digital twins to agentic computing.
- To manage costs from this complexity, FinOps has become a boardroom priority, addressing challenges in cloud billing models, workload scaling, price arbitrage, and data egress. The development of a low-code/no-code platform democratizes innovation. Operationally, a zero-trust security model is critical to prevent system misconfiguration, while green cloud computing initiatives introduce carbon-aware scheduling and liquid cooling systems.
- A key boardroom decision involves balancing innovation with governance; implementing a CI/CD automation and DevOps pipeline has been shown to reduce deployment errors by over 40%, directly impacting time-to-market and enhancing workload management and cloud procurement strategies.
What are the Key Data Covered in this Public Cloud Services Market Research and Growth Report?
-
What is the expected growth of the Public Cloud Services Market between 2026 and 2030?
-
USD 2,756.74 billion, at a CAGR of 27.8%
-
-
What segmentation does the market report cover?
-
The report is segmented by Service (SaaS, IaaS, and PaaS), Type (SMEs, and Large enterprise), Application (Collaboration and productivity suites, Analytics and AI services, CRM, ERP, and Others) and Geography (North America, Europe, APAC, South America, Middle East and Africa)
-
-
Which regions are analyzed in the report?
-
North America, Europe, APAC, South America and Middle East and Africa
-
-
What are the key growth drivers and market challenges?
-
Strategic mandate for sovereign cloud and regional data governance, Prohibitive operational costs and complexity of AI-driven finops
-
-
Who are the major players in the Public Cloud Services Market?
-
Akamai Technologies Inc., Alibaba Cloud, Amazon.com Inc., DigitalOcean Holdings Inc., Google LLC, Hetzner Online GmbH, Huawei Technologies Co. Ltd., IBM Corp., IONOS Inc., Linode LLC, Microsoft Corp., Oracle Corp., OVH Groupe SA, Scaleway SAS, Tencent Holdings Ltd., VULTR and Yandex NV
-
Market Research Insights
- The public cloud services market is defined by a strategic shift toward value-based outcomes, moving beyond simple resource provisioning. The institutionalization of cloud financial management and AI-driven FinOps is central to this, as organizations seek to eliminate unallocated waste, which accounts for nearly one-third of cloud budgets.
- This focus on efficiency is driving enterprise cloud adoption, with over 70% of large firms now using industry-specific platforms to accelerate digital transformation initiatives. However, a significant talent deficit persists; the time required to fill critical cloud security roles has increased by 15% year-on-year, slowing IT infrastructure modernization.
- Addressing this technical proficiency gap is crucial for organizations to fully leverage the benefits of distributed cloud infrastructure and achieve their cloud migration strategy goals.
We can help! Our analysts can customize this public cloud services market research report to meet your requirements.
 RIA -
RIA - 
