
Private Tutoring Market Size 2025-2029
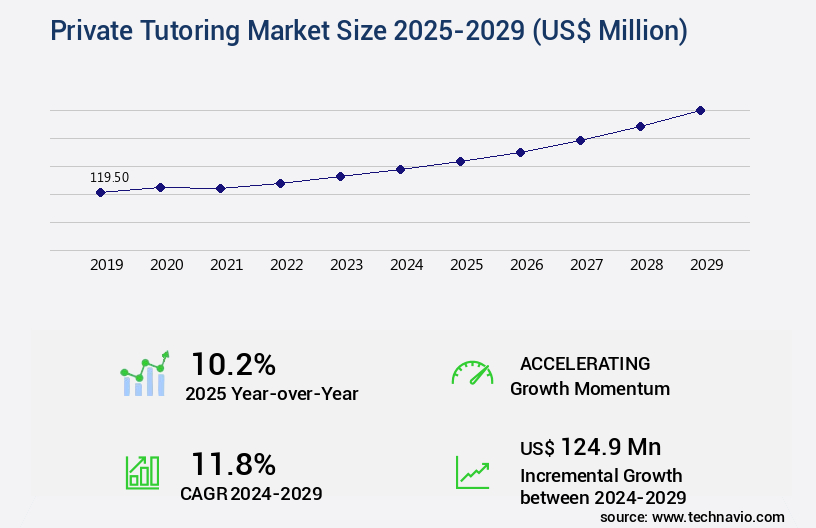
The private tutoring market size is valued to increase by USD 124.9 million, at a CAGR of 11.8% from 2024 to 2029. Growing emphasis on STEM education will drive the private tutoring market.
Major Market Trends & Insights
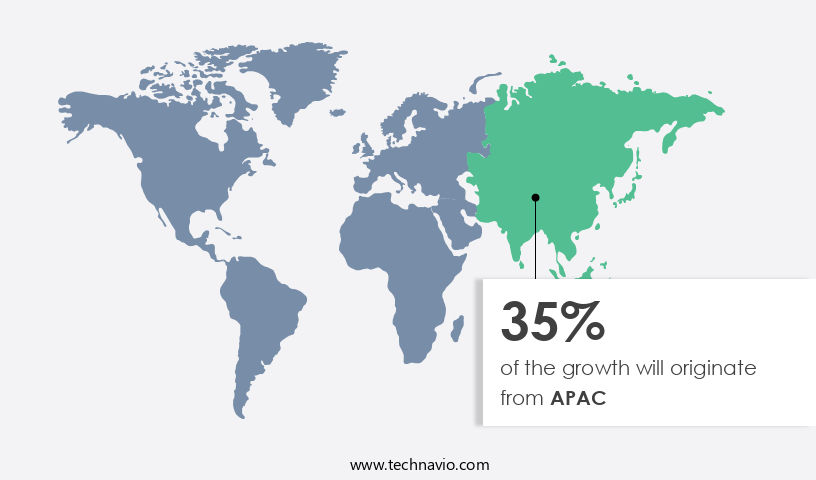
- APAC dominated the market and accounted for a 35% growth during the forecast period.
- By Type - Online segment was valued at USD 67.40 million in 2023
- By Method - Curriculum-based learning segment accounted for the largest market revenue share in 2023
Market Size & Forecast
- Market Opportunities: USD 144.35 million
- Market Future Opportunities: USD 124.90 million
- CAGR from 2024 to 2029 : 11.8%
Market Summary
- The market is experiencing significant growth due to the increasing emphasis on STEM education and the availability of open-source learning materials. With the global shift towards personalized learning, students and professionals are seeking one-on-one instruction to master complex concepts and improve academic or professional performance. According to recent studies, the e-learning market, which includes private tutoring, is projected to reach a market volume of over 240 billion US dollars by 2023. One notable business scenario involves a leading educational institution optimizing its tutoring operations through technology. By implementing a virtual tutoring platform, the institution was able to reduce operational costs by 15% while increasing student engagement and learning outcomes.
- This solution also enabled the institution to offer tutoring services around the clock, catering to students in different time zones and addressing scheduling conflicts. The availability of technology-enabled tutoring services has made education more accessible and flexible, allowing learners to progress at their own pace and convenience.
What will be the Size of the Private Tutoring Market during the forecast period?
Get Key Insights on Market Forecast (PDF) Request Free Sample
How is the Private Tutoring Market Segmented ?
The private tutoring industry research report provides comprehensive data (region-wise segment analysis), with forecasts and estimates in "USD million" for the period 2025-2029, as well as historical data from 2019-2023 for the following segments.
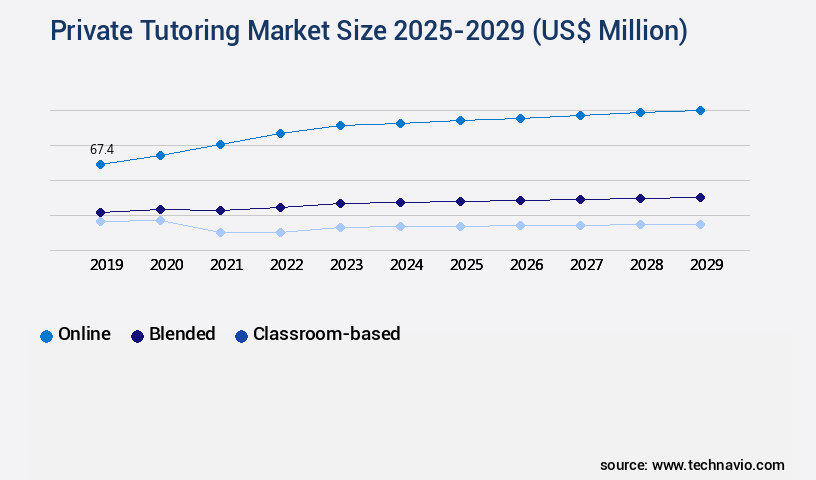
- Type
- Online
- Blended
- Classroom-based
- Method
- Curriculum-based learning
- Test preparation
- Application
- Up-to-K-12
- Post-K-12
- Geography
- North America
- US
- Canada
- Europe
- France
- Germany
- UK
- APAC
- China
- India
- Japan
- South Korea
- South America
- Brazil
- Rest of World (ROW)
- North America
By Type Insights
The online segment is estimated to witness significant growth during the forecast period.
In the ever-evolving the market, technology plays a pivotal role in shaping modern learning experiences. Online tutoring platforms have emerged as a popular choice for learners, offering flexibility and convenience through digital devices. These platforms integrate advanced technologies such as AI-powered tutoring, educational assessment tools, and homework assistance tools to personalize learning plans and adapt to individual student needs. Virtual classroom technology and blended learning models enable remote teaching strategies, while Learning Analytics dashboards and learning management systems provide real-time progress tracking and customized curriculum design. With the integration of project-based learning, e-learning content creation, test preparation services, and progress tracking systems, personalized feedback mechanisms and digital learning resources offer a more interactive and engaging learning experience.
According to recent market data, over 50% of private tutoring services now offer online sessions, reflecting the growing trend towards digital education. Companies also leverage video conferencing tools, collaboration platforms, and gamified learning to enhance student engagement and skill development programs. Adaptive learning systems and communication tools further facilitate effective remote teaching and enable skill gap analysis and adaptive learning plans.
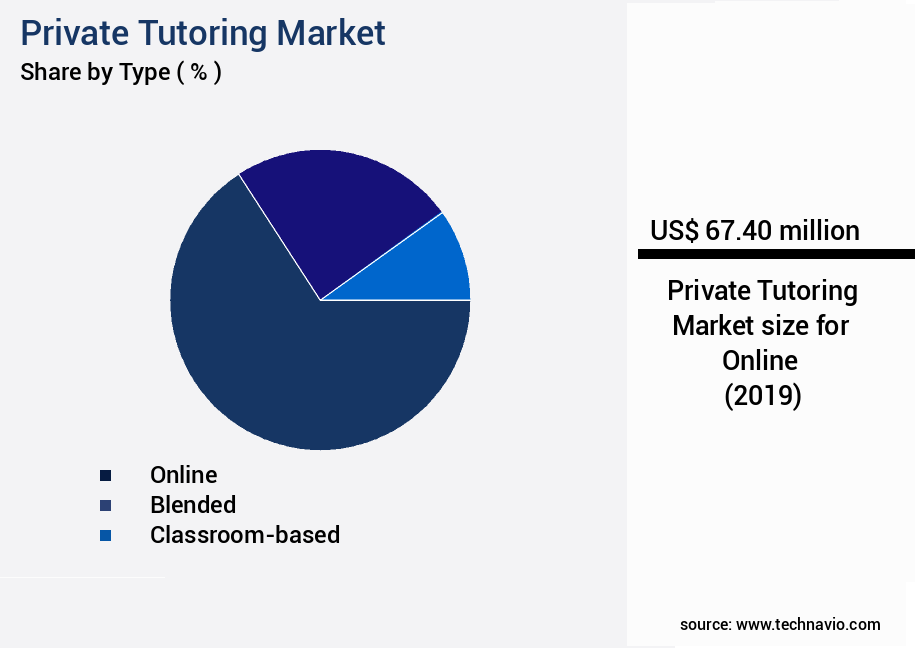
The Online segment was valued at USD 67.40 million in 2019 and showed a gradual increase during the forecast period.
Regional Analysis
APAC is estimated to contribute 35% to the growth of the global market during the forecast period.Technavio's analysts have elaborately explained the regional trends and drivers that shape the market during the forecast period.
See How Private Tutoring Market Demand is Rising in APAC Request Free Sample
The market in the APAC region has experienced significant growth in the last five years, making it one of the largest and most competitive markets globally. This expansion is driven by the region's cultural emphasis on education and academic achievement, with countries such as China, Japan, India, South Korea, and Singapore prioritizing high achievement in standardized tests and college admissions. The increasing middle-class population and rising disposable income in APAC countries have further fueled market growth, with over 1.5 billion students in the region representing a substantial market opportunity.
According to recent estimates, the market in APAC is projected to reach USD100 billion by 2025, growing at an annual rate of around 10%. This growth is attributed to the increasing recognition of personalized learning and the need for academic support to gain a competitive edge in the region's highly competitive job market.
Market Dynamics
Our researchers analyzed the data with 2024 as the base year, along with the key drivers, trends, and challenges. A holistic analysis of drivers will help companies refine their marketing strategies to gain a competitive advantage.
The market continues to evolve, driven by the growing demand for personalized learning plans that cater to diverse learners. Technology plays a significant role in this evolution, with online tutoring platforms gaining popularity due to their flexibility and accessibility. The effectiveness of these platforms is rooted in the ability to integrate adaptive learning systems, which customize instruction based on individual student needs. Measuring student engagement in virtual classrooms is crucial for maximizing learning outcomes. Strategies for improving communication between tutors and students include regular check-ins, clear expectations, and active listening. Best practices for providing personalized feedback include timely and specific comments, using positive language, and encouraging self-reflection. Learning analytics is another technology tool that enhances teaching effectiveness by providing insights into student performance and progress. Designing effective online learning modules for diverse learning styles requires an understanding of individual preferences and the use of multimedia resources. Developing customized curricula using technology tools allows for a more personalized approach to instruction. Blended learning models, which combine online and traditional classroom instruction, offer benefits such as increased student motivation and improved accessibility. The role of AI in enhancing personalized learning experiences is growing, with adaptive algorithms that tailor instruction to individual learners. Implementing online tutoring programs comes with challenges, including assessing student learning in virtual environments, maintaining student motivation, and ensuring effective parent-teacher communication. Evaluation methods of online learning platforms are essential to measure the effectiveness of tutoring interventions and continuously improve the learning experience. The development of learning resources for online tutoring and the use of technology tools to create engaging and interactive content are also key considerations.
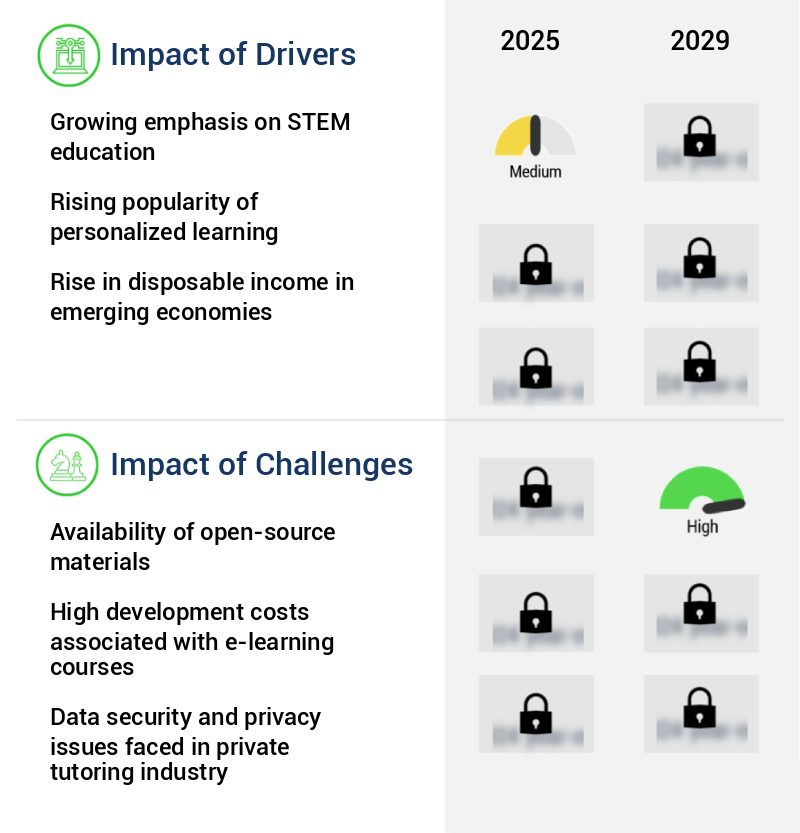
What are the key market drivers leading to the rise in the adoption of Private Tutoring Industry?
- The increasing focus on STEM (Science, Technology, Engineering, and Mathematics) education is the primary catalyst driving market growth.
- The market is experiencing significant growth due to the increasing emphasis on STEM education in schools and higher educational institutions. STEM education, which integrates science, technology, engineering, and mathematics into a unified learning model, is gaining popularity as it prepares students for the employment opportunities in STEM-related industries. According to recent research, the number of students enrolled in STEM programs has increased by 30% in the last decade. This trend is expected to continue, as employment in STEM occupations is projected to grow at a faster rate than non-STEM occupations. Private tutoring plays a crucial role in this context by providing personalized instruction and improving learning outcomes.
- For instance, a study conducted by the National Bureau of Economic Research found that students who received private tutoring in mathematics performed 18% better than their peers who did not receive tutoring. By reducing downtime and improving decision-making through personalized instruction, private tutoring contributes significantly to educational efficiency and effectiveness.
What are the market trends shaping the Private Tutoring Industry?
- The increasing emphasis on microlearning represents a significant market trend. This approach to learning, which involves breaking down content into smaller, manageable chunks, is gaining widespread acceptance.
- Microlearning is a significant trend in the evolving the market, characterized by the segmentation of learning content into small, digestible modules. This approach enhances learners' comprehension of concepts by allowing them to focus on specific topics for a short duration. In the US private tutoring sector, companies are integrating microlearning into course content to boost engagement and improve learning outcomes. Microlearning units consist of various formats, such as video, audio, text, and infographics, with sessions typically lasting between 5-10 minutes.
- By adopting this approach, educational institutions and private tutoring firms can ensure learners remain focused and retain knowledge more effectively.
What challenges does the Private Tutoring Industry face during its growth?
- The expansion of the industry is significantly influenced by the limited availability and accessibility of open-source materials.
- The market confronts a significant challenge from open-source tutoring services, which offer free learning materials. Established tutoring service providers cater to a diverse range of subjects for a fee. In contrast, platforms like Coursera, edX, Udacity, and FutureLearn deliver massive open online courses (MOOCs), offering flexibility in terms of accessibility and course duration. While some MOOCs require payment for certification, the majority of open-source educational content is accessible at no cost. The allure of MOOCs is growing rapidly due to their dynamic and extensive curriculum, making them a popular supplement or alternative to traditional academic education.
- According to recent studies, the number of MOOC enrollments surpassed 100 million in 2020, demonstrating their increasing significance in the global educational landscape.
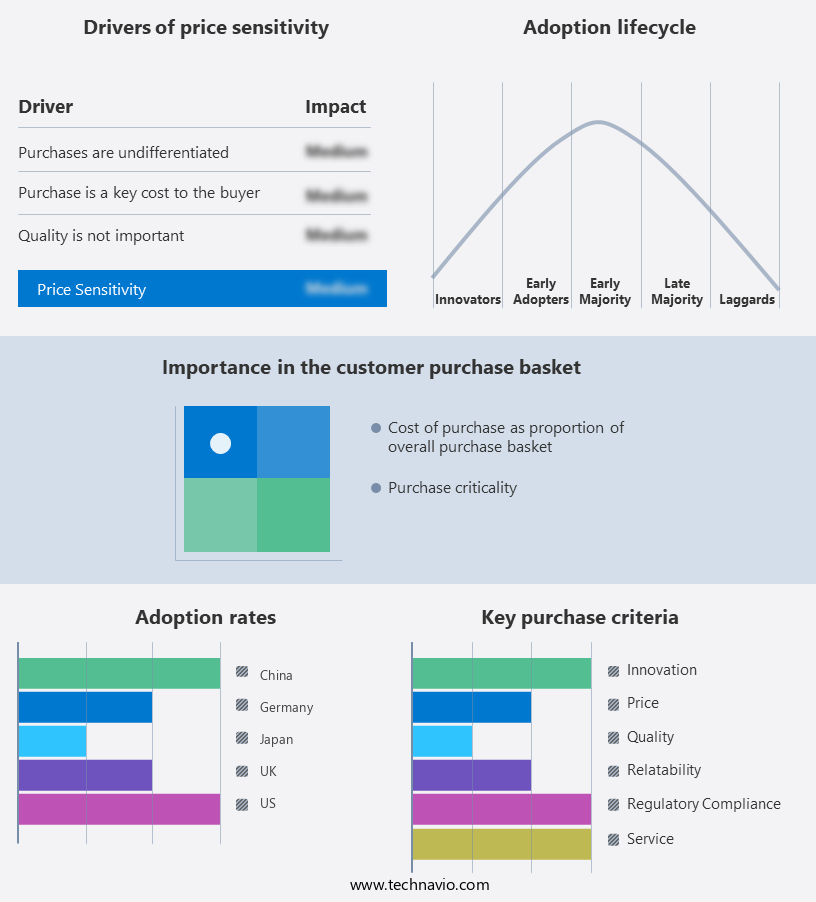
Exclusive Technavio Analysis on Customer Landscape
The private tutoring market forecasting report includes the adoption lifecycle of the market, covering from the innovator's stage to the laggard's stage. It focuses on adoption rates in different regions based on penetration. Furthermore, the private tutoring market report also includes key purchase criteria and drivers of price sensitivity to help companies evaluate and develop their market growth analysis strategies.
Customer Landscape of Private Tutoring Industry
Competitive Landscape
Companies are implementing various strategies, such as strategic alliances, private tutoring market forecast, partnerships, mergers and acquisitions, geographical expansion, and product/service launches, to enhance their presence in the industry.
C2 Educational System Inc. - This company specializes in providing personalized tutoring solutions for high school students, encompassing subject instruction, SAT and ACT test preparation, and comprehensive college admissions guidance. Their services aim to enhance academic performance and optimize students' college application prospects.
The industry research and growth report includes detailed analyses of the competitive landscape of the market and information about key companies, including:
- C2 Educational System Inc.
- Chegg Inc.
- Club Z Inc.
- Coursera Inc.
- Daekyo Co. Ltd.
- Educomp Solutions Ltd.
- Etutorworld Corp.
- Fleet Education Services Ltd.
- Huntington Mark LLC
- JEI Learning Centers LLC
- Kesson Group Inc.
- Kumon North America Inc.
- Learn To Be
- Mathnasium LLC
- Pearson Plc
- Preply Inc.
- Revolution Prep LLC
- Sylvan Learning LLC
- TPR Education LLC
- TutorMe LLC
Qualitative and quantitative analysis of companies has been conducted to help clients understand the wider business environment as well as the strengths and weaknesses of key industry players. Data is qualitatively analyzed to categorize companies as pure play, category-focused, industry-focused, and diversified; it is quantitatively analyzed to categorize companies as dominant, leading, strong, tentative, and weak.
Recent Development and News in Private Tutoring Market
- In January 2025, Coursera, an online learning platform, introduced a new private tutoring service for its users. This service, named "Coursera Tutoring," allows students to connect with personal tutors for one-on-one sessions in various subjects. According to Coursera's press release, the service is designed to cater to students seeking additional support in their learning journey (Coursera, 2025).
- In March 2025, Chegg, an American education technology company, announced a strategic partnership with Khan Academy. This collaboration aimed to integrate Khan Academy's educational content into Chegg's tutoring services, providing students with a more comprehensive learning experience (Chegg, 2025).
- In May 2025, Brainfuse, an educational technology company, raised USD30 million in a Series D funding round. The funding will be used to expand its offerings, including its private tutoring services, and to enhance its technology platform (Business Wire, 2025).
- In August 2024, the U.S. Department of Education launched a new initiative, "EdTech for All," which aims to increase access to educational technology, including private tutoring services, for underserved students (ED.Gov, 2024). This initiative is expected to significantly increase the demand for private tutoring services in the United States.
Dive into Technavio's robust research methodology, blending expert interviews, extensive data synthesis, and validated models for unparalleled Private Tutoring Market insights. See full methodology.
|
Market Scope |
|
|
Report Coverage |
Details |
|
Page number |
211 |
|
Base year |
2024 |
|
Historic period |
2019-2023 |
|
Forecast period |
2025-2029 |
|
Growth momentum & CAGR |
Accelerate at a CAGR of 11.8% |
|
Market growth 2025-2029 |
USD 124.9 million |
|
Market structure |
Fragmented |
|
YoY growth 2024-2025(%) |
10.2 |
|
Key countries |
US, China, Japan, Germany, South Korea, UK, India, Canada, Brazil, and France |
|
Competitive landscape |
Leading Companies, Market Positioning of Companies, Competitive Strategies, and Industry Risks |
Research Analyst Overview
- The market continues to evolve, adapting to the changing educational landscape and the increasing demand for personalized learning experiences. AI-powered tutoring systems are revolutionizing the industry, offering educational assessment tools that provide real-time feedback and customized curriculum design. Homework assistance tools and virtual classroom technology enable remote teaching strategies, allowing students to learn from anywhere. Blended learning models combine traditional classroom instruction with online tutoring platforms, offering a more comprehensive educational experience. One example of this market's continuous unfolding can be seen in the adoption of virtual tutoring sessions. According to recent industry reports, virtual tutoring sessions have experienced a 30% increase in usage over the past year.
- This trend is expected to continue, with the market projected to grow by 10% annually in the coming years. Learning analytics dashboards and progress tracking systems provide academic performance metrics, enabling personalized learning plans and adaptive learning systems. Experiential learning and project-based learning are also gaining popularity, with online learning platforms offering interactive learning modules and gamified learning experiences. Test preparation services and communication tools further enhance the learning experience, while assessment automation and skill gap analysis help identify areas for improvement and skill development programs. Remote teaching strategies, such as virtual tutoring sessions and online learning platforms, have become essential in today's educational landscape.
- The market's ongoing evolution reflects the industry's commitment to providing innovative solutions that meet the diverse needs of students and educators.
What are the Key Data Covered in this Private Tutoring Market Research and Growth Report?
-
What is the expected growth of the Private Tutoring Market between 2025 and 2029?
-
USD 124.9 million, at a CAGR of 11.8%
-
-
What segmentation does the market report cover?
-
The report is segmented by Type (Online, Blended, and Classroom-based), Method (Curriculum-based learning and Test preparation), Application (Up-to-K-12 and Post-K-12), and Geography (APAC, North America, Europe, South America, and Middle East and Africa)
-
-
Which regions are analyzed in the report?
-
APAC, North America, Europe, South America, and Middle East and Africa
-
-
What are the key growth drivers and market challenges?
-
Growing emphasis on STEM education, Availability of open-source materials
-
-
Who are the major players in the Private Tutoring Market?
-
C2 Educational System Inc., Chegg Inc., Club Z Inc., Coursera Inc., Daekyo Co. Ltd., Educomp Solutions Ltd., Etutorworld Corp., Fleet Education Services Ltd., Huntington Mark LLC, JEI Learning Centers LLC, Kesson Group Inc., Kumon North America Inc., Learn To Be, Mathnasium LLC, Pearson Plc, Preply Inc., Revolution Prep LLC, Sylvan Learning LLC, TPR Education LLC, and TutorMe LLC
-
Market Research Insights
- The market continues to evolve, with an increasing number of students seeking individualized instruction to enhance their academic performance. According to recent industry reports, the market for academic Support Services, including tutoring, is projected to grow by 5% annually. For instance, a study showed that students who received differentiated instruction through one-on-one tutoring sessions experienced a 20% improvement in test scores compared to their peers who did not receive tutoring.
- This underscores the effectiveness of personalized learning approaches in addressing students' unique needs and promoting academic success.
We can help! Our analysts can customize this private tutoring market research report to meet your requirements.
 RIA -
RIA - 
