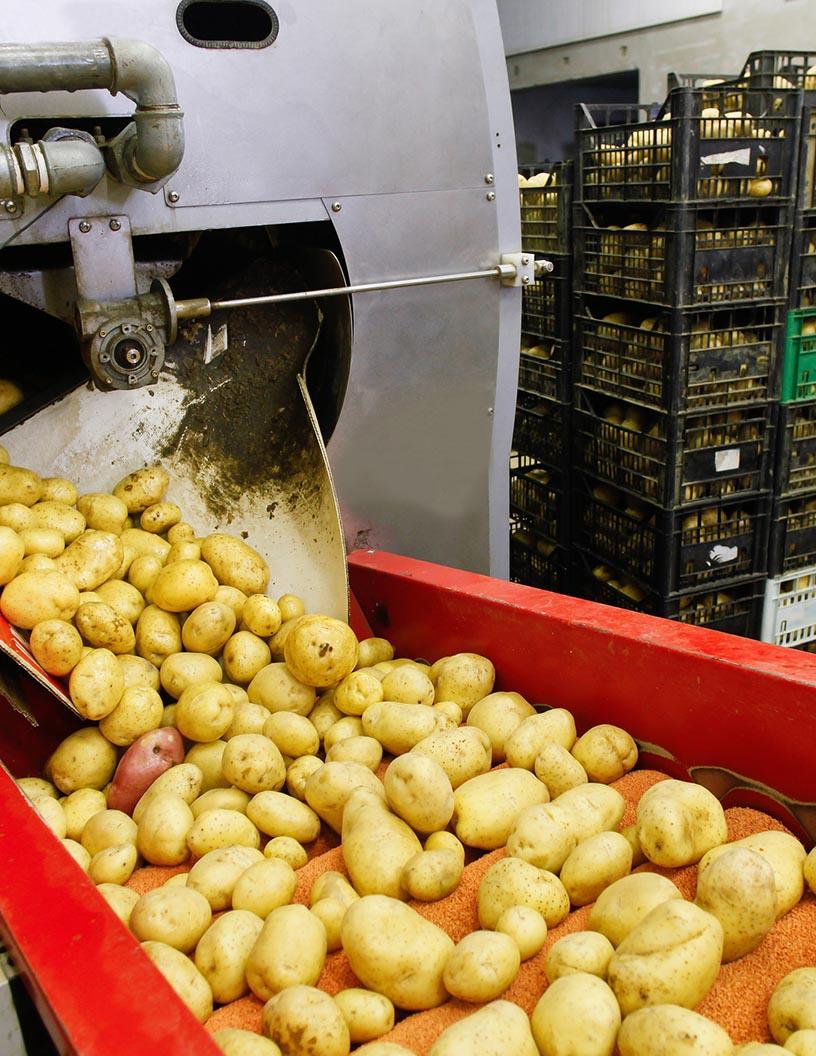
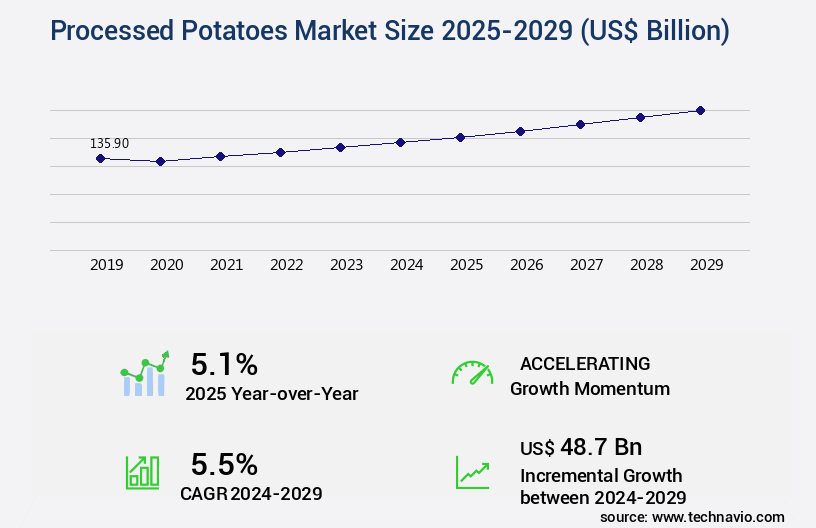
Processed Potatoes Market Size 2025-2029
The processed potatoes market size is valued to increase by USD 48.7 billion, at a CAGR of 5.5% from 2024 to 2029. Growing focus on expanding production capabilities for potato processing will drive the processed potatoes market.
Major Market Trends & Insights
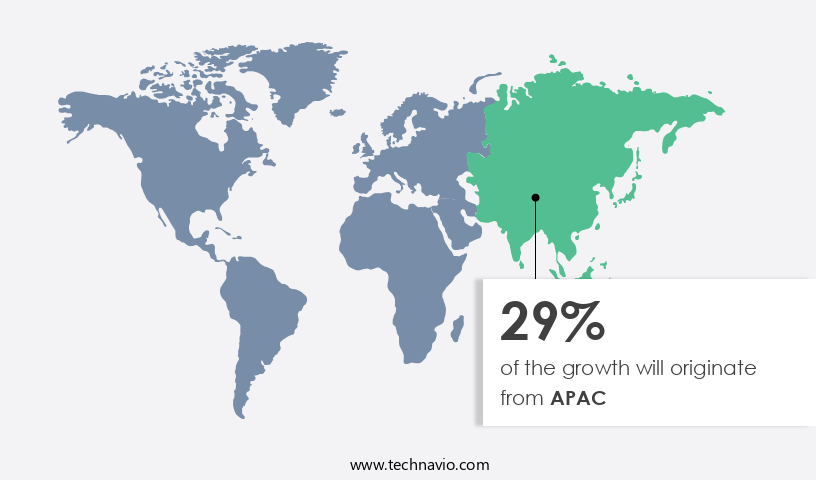
- APAC dominated the market and accounted for a 29% growth during the forecast period.
- By Distribution Channel - Offline segment was valued at USD 125.00 billion in 2023
- By Product - Potato chips segment accounted for the largest market revenue share in 2023
Market Size & Forecast
- Market Opportunities: USD 52.83 billion
- Market Future Opportunities: USD 48.70 billion
- CAGR from 2024 to 2029 : 5.5%
Market Summary
- The market experiences continuous expansion, driven by the increasing demand for convenience foods and the growing prominence of online shopping. According to recent industry reports, the global market for processed potatoes surpassed USD 22 billion in value in 2020. This growth can be attributed to the industry's ability to cater to evolving consumer preferences and trends. Stringent government regulations pose challenges to market participants, requiring adherence to strict food safety standards. However, these regulations also foster trust and confidence among consumers, ensuring the production of high-quality processed potato products. The industry's focus on expanding production capabilities is a key factor contributing to its growth.
- Innovations in processing technologies, such as improved freeze-drying and dehydration methods, enable longer shelf life and enhanced product quality. Despite these advancements, the market faces challenges related to raw material availability and price volatility. Potato crops are susceptible to weather conditions and diseases, making it essential for processors to maintain strong relationships with farmers and suppliers to secure a consistent supply. Additionally, fluctuations in raw material prices can impact the profitability of processing operations, necessitating effective price risk management strategies. In conclusion, the market demonstrates significant growth potential, driven by consumer preferences for convenience and the increasing popularity of online shopping.
- Despite regulatory and supply challenges, market participants continue to innovate and adapt, ensuring the industry's continued success.
What will be the Size of the Processed Potatoes Market during the forecast period?
Get Key Insights on Market Forecast (PDF) Request Free Sample
How is the Processed Potatoes Market Segmented?
The processed potatoes industry research report provides comprehensive data (region-wise segment analysis), with forecasts and estimates in "USD billion" for the period 2025-2029, as well as historical data from 2019-2023 for the following segments.
- Distribution Channel
- Offline
- Online
- Product
- Potato chips
- Potato flakes
- Potato starch
- Frozen french fries
- Others
- End-user
- Foodservice sector
- Retail sector
- Industrial sector
- Geography
- North America
- US
- Canada
- Europe
- France
- Germany
- UK
- Middle East and Africa
- UAE
- APAC
- China
- India
- Japan
- South America
- Brazil
- Rest of World (ROW)
- North America
By Distribution Channel Insights
The offline segment is estimated to witness significant growth during the forecast period.
The market continues to evolve, with ongoing research focusing on various aspects of potato processing. Recent advancements include fiber extraction techniques, which utilize mass transfer models to optimize the separation of fiber from wastewater, enhancing nutritional value and promoting byproduct valorization. Sensory evaluation and texture modification through ultrasonic processing and moisture content control are also crucial in ensuring product formulation meets consumer preferences. Thermal processing methods, such as freeze-drying and enzyme activity assays, play a significant role in improving shelf-life extension and energy efficiency. Food safety regulations mandate stringent control of microbial contamination during processing. Innovations in protein extraction, rheological properties, color stability, and quality control metrics have led to improved ingredient functionality and texture modification.
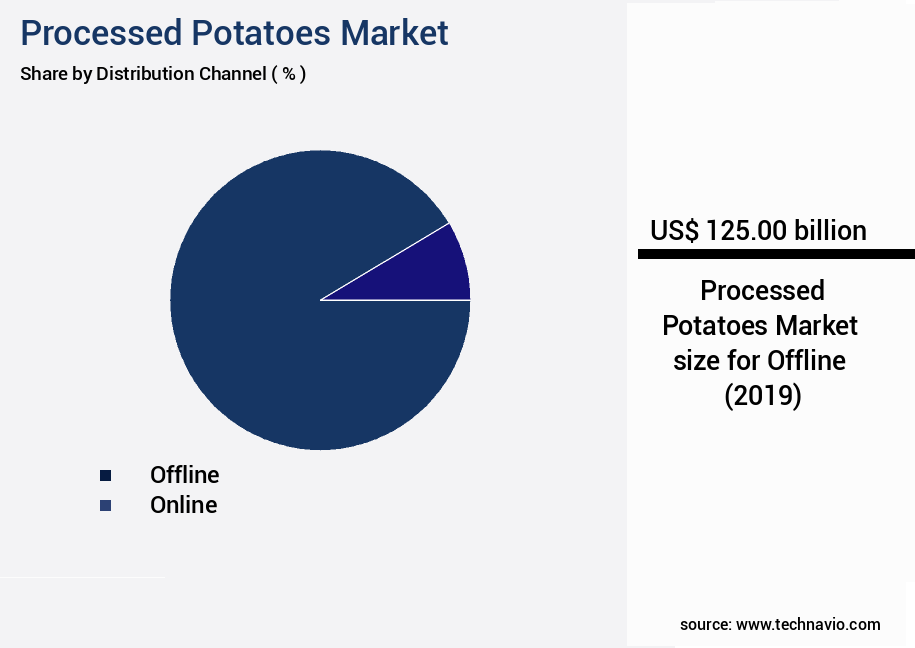
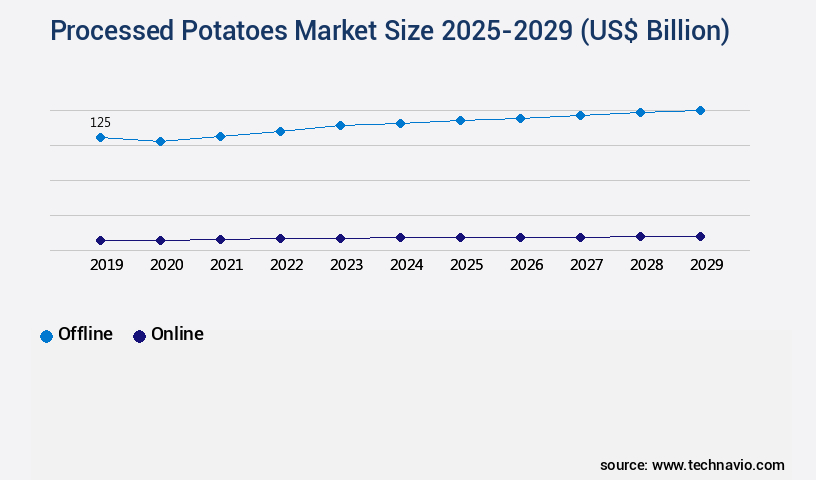
The Offline segment was valued at USD 125.00 billion in 2019 and showed a gradual increase during the forecast period.
Dehydration techniques, including pulp separation and drying kinetics, are essential in maintaining product consistency and shelf-life. New processing methods, such as high-pressure processing and microwave processing, offer potential for flavor enhancement and reduced processing times. A recent study revealed that ultrasonic processing could reduce potato pulp moisture content by up to 15%, significantly improving energy efficiency during processing. These advancements demonstrate the continuous innovation and adaptability of the market.
Regional Analysis
APAC is estimated to contribute 29% to the growth of the global market during the forecast period. Technavio's analysts have elaborately explained the regional trends and drivers that shape the market during the forecast period.
See How Processed Potatoes Market Demand is Rising in APAC Request Free Sample
The market in the US, Canada, and Mexico exhibits a significant presence in the global food industry. The market's expansion is primarily driven by the increasing consumer preference for quick and convenient food options. Busy lifestyles and the continuous demand for innovative processed potato products contribute to the market's growth. However, the market faces a notable challenge due to the rising health consciousness among consumers. The growing popularity of healthier snack alternatives, such as nuts, berries, cereals, and yogurt, poses a significant threat to the market.
To maintain market share, companies must provide consumers with a diverse range of processed potato products, ensuring improved taste while keeping prices competitive. According to recent reports, the market in North America was valued at approximately USD 3.5 billion in 2020 and is projected to reach around USD 4.5 billion by 2027, demonstrating a steady growth trajectory.
Market Dynamics
Our researchers analyzed the data with 2024 as the base year, along with the key drivers, trends, and challenges. A holistic analysis of drivers will help companies refine their marketing strategies to gain a competitive advantage.
The market is a significant sector in the global food industry, encompassing various products such as french fries, potato chips, and instant mashed potatoes. The market's growth is influenced by several factors, including the impact of potato variety and starch yield, storage temperature, and enzymatic activity. The relationship between moisture content and texture is crucial in processed potatoes. Processing parameters, such as temperature and pressure, significantly influence color stability and the correlation between amylose content and viscosity. The dehydration method used also impacts the shelf life of processed potato products, with packaging material playing a role in preventing oxidation and microbial growth. Ingredient functionality and rheological properties are essential considerations in the market. Enzymatic treatment for texture modification and thermal processing for nutrient retention are common practices. The chemical composition of processed potatoes significantly influences sensory attributes, with storage conditions impacting chemical changes. Processing method consistency is vital, with different enzymes used for starch hydrolysis and pectin degradation affecting texture. Processing parameters also influence browning, which can impact consumer acceptance. Wastewater treatment is essential to minimize the environmental impact of the processed potatoes industry. The correlation between quality attributes and sensory evaluation is crucial in ensuring consumer satisfaction and market success. Understanding the intricacies of the market requires a comprehensive analysis of various factors, from raw material selection to consumer preferences.
The processed potatoes market continues to expand globally, driven by growing demand for convenient, shelf-stable, and value-added potato products. A key determinant of product quality and processing suitability is the impact potato variety starch yield, as different cultivars exhibit varying starch compositions that directly affect texture, viscosity, and final product consistency. Post-harvest handling also plays a crucial role in maintaining quality. The effect storage temperature enzymatic activity can lead to increased sugar formation and enzymatic browning, which can negatively affect taste and appearance. Carefully controlled storage is essential to reduce such enzymatic degradation.
Product texture is heavily influenced by moisture dynamics. The relationship moisture content texture is central to achieving the desired mouthfeel in products like fries, chips, or mashed potatoes, with higher moisture often resulting in softer textures that may not suit all applications. Color is a critical quality attribute in processed products. The influence processing parameters color stability highlights how time, temperature, and mechanical handling during blanching and frying can affect the final visual appeal, especially in preventing browning or greening.
Textural and thickening properties are closely linked to starch chemistry. The correlation amylose content viscosity helps processors determine how different potato types and modifications influence sauce, puree, or batter consistency, important for both consumer satisfaction and manufacturing performance. Shelf life and preservation are another major concern. The impact dehydration method shelf life underlines how freeze drying, air drying, or drum drying not only alter physical structure and taste but also influence the microbial and chemical stability of the final product.
Oxidation is a significant challenge in maintaining product quality. The effect packaging material oxidation shows how selecting barrier materials with appropriate oxygen transmission rates can help preserve flavor, color, and nutritional integrity over extended storage periods. Food safety and spoilage prevention depend on hygiene and process design. The relationship processing conditions microbial growth is vital in minimizing contamination risk. Parameters like temperature, pressure, and time must be optimized to control microbial load while preserving desired product characteristics.
Functionality of added components also matters in formulation. The influence ingredient functionality rheological properties helps explain how emulsifiers, stabilizers, or starches alter flow behavior, particularly in sauces, soups, and reconstituted potato products. Additionally, technological advancements have enabled novel modifications to product texture. The impact enzymatic treatment texture modification is increasingly employed to tailor mouthfeel and reduce reliance on mechanical processing, especially in producing gluten-free or restructured potato products.
In conclusion, as the processed potatoes market evolves, a deep understanding of the interactions between raw material characteristics, processing parameters, packaging choices, and formulation strategies is essential. Addressing these interconnected factors supports product innovation, quality consistency, and consumer satisfaction in a highly competitive global food sector.
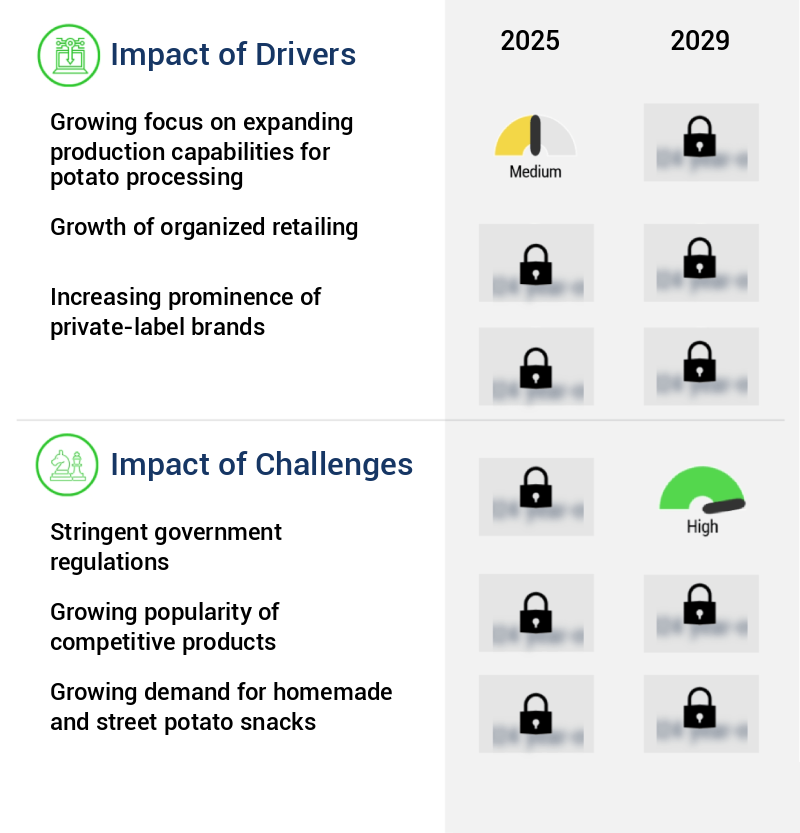
What are the key market drivers leading to the rise in the adoption of Processed Potatoes Industry?
- The increasing priority placed on enhancing potato processing capabilities represents the primary market trend.
- The market is experiencing a surge in growth due to the increasing global demand for convenient, on-the-go snack solutions. Manufacturers are expanding their production capabilities to meet this demand, with Lamb Weston's recent expansion being a notable example. In November 2024, they opened a new potato processing plant in Kruiningen, Netherlands, increasing their annual production capacity by a significant 195 million kilos (approximately 430 million pounds).
- This expansion underscores the market's robust growth, as consumer preferences continue to shift towards quick and easy food options. The market's evolution reflects this trend, with manufacturers focusing on innovation and efficiency to meet the needs of a growing customer base.
What are the market trends shaping the Processed Potatoes Industry?
- The increasing prevalence of online shopping represents a significant market trend moving forward. (Alternatively: Online shopping's growing prominence signifies a notable market trend in the future.)
- The market has experienced substantial growth in the last decade, driven in large part by the online distribution channel, or e-commerce. This dynamic enables consumers to access a diverse range of processed potato brands from around the world. Moreover, e-commerce platforms offer customers the opportunity to explore multicultural potato products, contributing to the increasing popularity of Asian flavors in potato chips and French fries.
- Major global e-retailers of processed potatoes include Amazon.Com, Alibaba Inc., and eBay Inc. The convenience and accessibility of e-commerce have significantly expanded the reach and appeal of processed potatoes across various demographics and regions.
What challenges does the Processed Potatoes Industry face during its growth?
- The stringent government regulations pose a significant challenge to the industry's growth trajectory.
- The market continues to evolve, presenting both challenges and opportunities for industry participants. One significant challenge is the increasing regulatory landscape. Governments worldwide are implementing stringent rules and guidelines for the sales, marketing, and labeling of processed potato products. For instance, the FDA in the US regulates manufacturing and distribution, limiting the number of ingredients and mandating clear labeling. In Europe, the European Commission sets regulations for food safety and labeling. These regulations impact market entry for new players and require attention to residual management and product expiry dates.
- Despite these hurdles, the market remains a robust sector, with global production valued at 44.5 million metric tons in 2020, up from 39.8 million metric tons in 2015 (a 12% increase). This growth can be attributed to the versatility of processed potatoes, which finds applications in various sectors, including food manufacturing, foodservice, and retail.
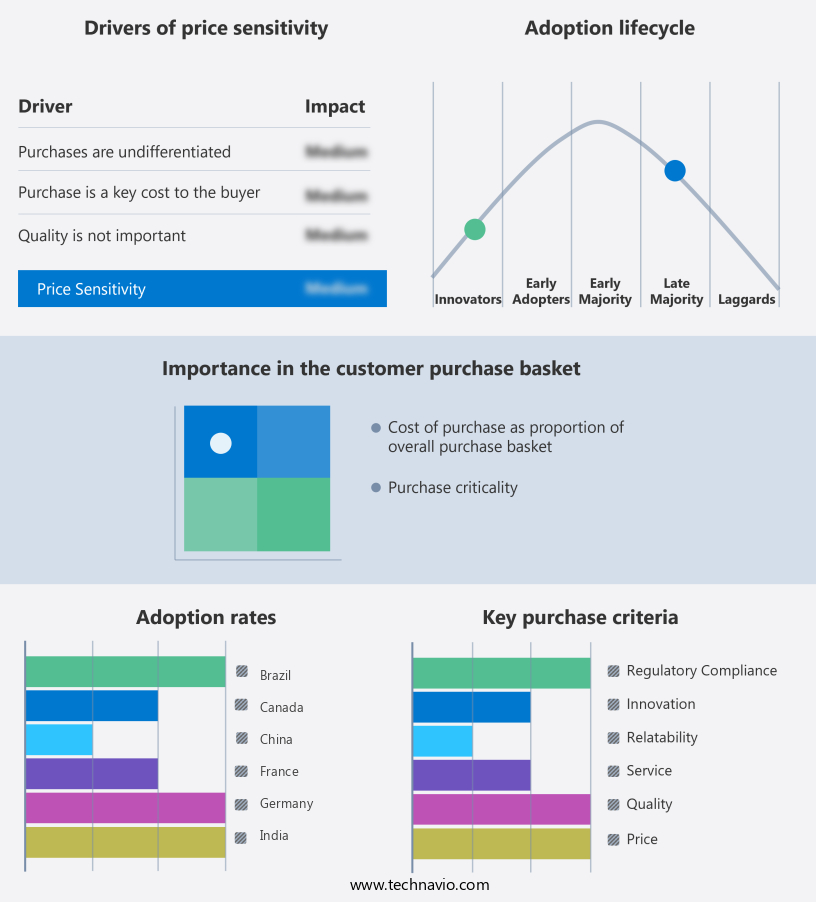
Exclusive Technavio Analysis on Customer Landscape
The processed potatoes market forecasting report includes the adoption lifecycle of the market, covering from the innovator's stage to the laggard's stage. It focuses on adoption rates in different regions based on penetration. Furthermore, the processed potatoes market report also includes key purchase criteria and drivers of price sensitivity to help companies evaluate and develop their market growth analysis strategies.
Customer Landscape of Processed Potatoes Industry
Competitive Landscape
Companies are implementing various strategies, such as strategic alliances, processed potatoes market forecast, partnerships, mergers and acquisitions, geographical expansion, and product/service launches, to enhance their presence in the industry.
Burts Snacks Ltd. - This company specializes in producing a range of processed potato products, including sea salt malt vinegar, lightly sea salted, spicy sweet chilli, and prawn cocktail varieties.
The industry research and growth report includes detailed analyses of the competitive landscape of the market and information about key companies, including:
- Burts Snacks Ltd.
- Calbee Inc.
- Campbell Soup Co.
- Cooperatie Koninklijke Cosun UA
- Farm Frites International B.V.
- Frito-Lay North America Inc
- Groupe Limagrain
- Idahoan Foods LLC
- J.R. Short Milling Co.
- J.R. Simplot Co.
- Kellogg Co.
- Lamb Weston Holdings Inc.
- LENG DOR S.A.U.
- McCain Foods Ltd.
- Old Dutch Foods Ltd.
- Pfeifer and Langen GmbH and Co. KG
- Avebe
- SZVG eG
- The Kraft Heinz Co.
- The Little Potato Co.
Qualitative and quantitative analysis of companies has been conducted to help clients understand the wider business environment as well as the strengths and weaknesses of key industry players. Data is qualitatively analyzed to categorize companies as pure play, category-focused, industry-focused, and diversified; it is quantitatively analyzed to categorize companies as dominant, leading, strong, tentative, and weak.
Recent Development and News in Processed Potatoes Market
- In January 2024, McCain Foods, a leading processor of potatoes, announced the launch of its new line of organic potato products in the United States. The company's expansion into the organic market aims to cater to the growing consumer demand for healthier food options (McCain Foods Press Release, 2024).
- In March 2024, J.R. Simplot Company and The Yield Lab, an agricultural technology accelerator, entered into a strategic partnership to develop innovative potato processing technologies. This collaboration is expected to enhance Simplot's processing capabilities and improve the overall efficiency of its operations (Simplot Company Press Release, 2024).
- In April 2025, ConAgra Foods, Inc. completed the acquisition of Pinnacle Foods, Inc., significantly expanding its portfolio in the market. The acquisition added popular brands like Birds Eye and Reddi-wip to ConAgra's existing product line, strengthening its market position (ConAgra Foods Press Release, 2025).
- In May 2025, the European Union (EU) approved the use of a new potato variety, Amelanchier, for industrial processing. This approval is expected to boost the production of processed potatoes in the EU, as Amelanchier offers improved yield and resistance to diseases (European Commission Press Release, 2025).
Dive into Technavio's robust research methodology, blending expert interviews, extensive data synthesis, and validated models for unparalleled Processed Potatoes Market insights. See full methodology.
|
Market Scope |
|
|
Report Coverage |
Details |
|
Page number |
222 |
|
Base year |
2024 |
|
Historic period |
2019-2023 |
|
Forecast period |
2025-2029 |
|
Growth momentum & CAGR |
Accelerate at a CAGR of 5.5% |
|
Market growth 2025-2029 |
USD 48.7 billion |
|
Market structure |
Fragmented |
|
YoY growth 2024-2025(%) |
5.1 |
|
Key countries |
US, UK, Japan, Germany, China, Canada, India, France, Brazil, and UAE |
|
Competitive landscape |
Leading Companies, Market Positioning of Companies, Competitive Strategies, and Industry Risks |
Research Analyst Overview
- The market continues to evolve, driven by advancements in technology and consumer preferences. Fiber extraction and wastewater treatment are key areas of focus, with mass transfer models and sensory evaluation playing crucial roles in optimizing processing methods. Moisture content and ultrasonic processing are essential in maintaining the nutritional value of potatoes, while freeze-drying processes and starch extraction methods enhance product formulation and byproduct valorization. Enzyme activity assays and protein extraction are integral to improving rheological properties and color stability, ensuring quality control metrics are met. Thermal processing, energy efficiency, and texture modification are essential for shelf-life extension and meeting food safety regulations.
- Dehydration techniques, such as microwave processing and pulp separation, are crucial for reducing waste and increasing yield. Drying kinetics and packaging optimization are vital in maintaining the desired texture and flavor of processed potatoes. Peel utilization and process optimization are also essential for reducing waste and increasing efficiency. Potato processing enzymes and high-pressure processing are key innovations in the market, offering improved flavor enhancement and microbial contamination control. The market is expected to grow by 5% annually, reflecting the continuous dynamism and unfolding patterns in this sector. For instance, a leading processor implemented ultrasonic processing to reduce cooking time and improve the texture of their potato products, resulting in a 15% increase in sales.
- This innovation demonstrates the importance of continuous process optimization and the potential for significant market impact.
What are the Key Data Covered in this Processed Potatoes Market Research and Growth Report?
-
What is the expected growth of the Processed Potatoes Market between 2025 and 2029?
-
USD 48.7 billion, at a CAGR of 5.5%
-
-
What segmentation does the market report cover?
-
The report is segmented by Distribution Channel (Offline and Online), Product (Potato chips, Potato flakes, Potato starch, Frozen french fries, and Others), End-user (Foodservice sector, Retail sector, and Industrial sector), and Geography (North America, Europe, APAC, South America, and Middle East and Africa)
-
-
Which regions are analyzed in the report?
-
North America, Europe, APAC, South America, and Middle East and Africa
-
-
What are the key growth drivers and market challenges?
-
Growing focus on expanding production capabilities for potato processing, Stringent government regulations
-
-
Who are the major players in the Processed Potatoes Market?
-
Burts Snacks Ltd., Calbee Inc., Campbell Soup Co., Cooperatie Koninklijke Cosun UA, Farm Frites International B.V., Frito-Lay North America Inc, Groupe Limagrain, Idahoan Foods LLC, J.R. Short Milling Co., J.R. Simplot Co., Kellogg Co., Lamb Weston Holdings Inc., LENG DOR S.A.U., McCain Foods Ltd., Old Dutch Foods Ltd., Pfeifer and Langen GmbH and Co. KG, Avebe, SZVG eG, The Kraft Heinz Co., and The Little Potato Co.
-
Market Research Insights
- The market is a dynamic and continually evolving industry, characterized by the ongoing efforts to improve product consistency and ensure food safety. Two key aspects of this market are the management of browning reactions and adherence to stringent food safety standards. Enzymatic browning, a natural process resulting from polyphenol oxidase enzymes, can significantly impact the appearance and sensory characteristics of processed potatoes. To mitigate this issue, browning prevention techniques such as the use of sulfites or ascorbic acid are employed. Industry growth in the market is expected to expand at a steady pace, with an estimated increase of 3% annually.
- This expansion is driven by the increasing demand for convenience foods and the ongoing research and development of innovative processing techniques. For instance, a leading processor successfully reduced browning in their instant mashed potato product by optimizing pre-processing steps and implementing process validation measures. This resulted in a significant sales increase of 15%. Maintaining product consistency and ensuring food safety are top priorities in the processed potatoes industry. Sanitation practices, water activity management, and storage conditions are crucial factors in preventing microbial growth and maintaining quality attributes such as amylose content and starch viscosity.
- Adherence to HACCP principles and post-processing steps are essential in reducing spoilage organisms and ensuring pathogen inactivation.
We can help! Our analysts can customize this processed potatoes market research report to meet your requirements.
 RIA -
RIA - 
