Processed Red Meat Market Analysis, Size, and Forecast 2026-2030: North America (US, Canada, and Mexico), Europe (Germany, UK, and France), APAC (China, Japan, and Australia), South America (Brazil, Argentina, and Colombia), Middle East and Africa (Saudi Arabia, South Africa, and UAE), and Rest of World (ROW)

Processed Red Meat Market Analysis, Size, and Forecast 2026-2030:
North America (US, Canada, and Mexico), Europe (Germany, UK, and France), APAC (China, Japan, and Australia), South America (Brazil, Argentina, and Colombia), Middle East and Africa (Saudi Arabia, South Africa, and UAE), and Rest of World (ROW)

Published: Mar 2026 329 Pages SKU: IRTNTR72786

Market Overview at a Glance

$147.7 B
Market Opportunity
5.1%
CAGR 2025 - 2030
33%
North America Growth
$209.4 B
Processed pork segment 2024

Processed Red Meat Market Size 2026-2030

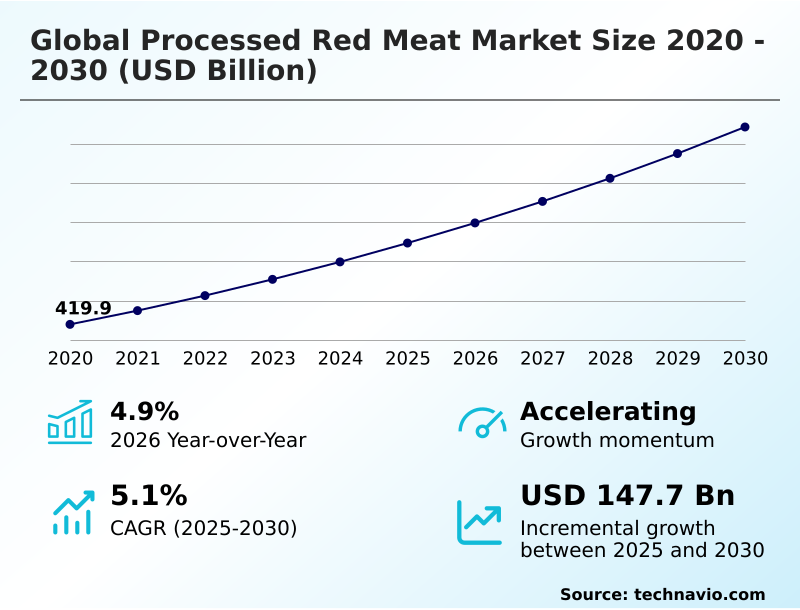
The processed red meat market size is valued to increase by USD 147.7 billion, at a CAGR of 5.1% from 2025 to 2030. Surging demand for convenience and ready-to-eat food products will drive the processed red meat market.

Major Market Trends & Insights

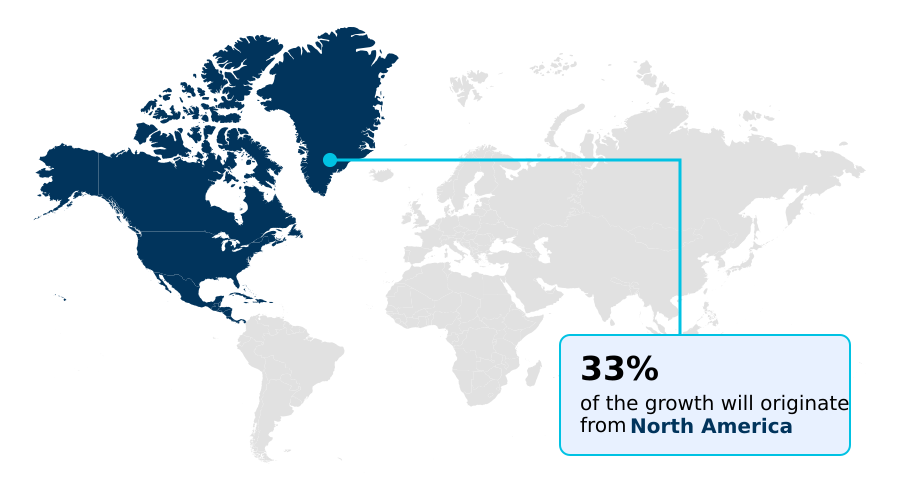
  • North America dominated the market and accounted for a 33% growth during the forecast period.
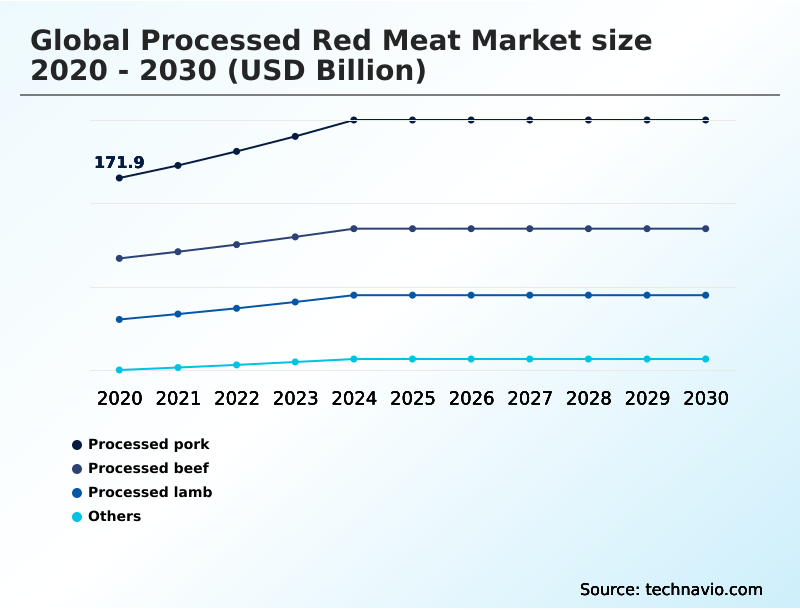
  • By Product - Processed pork segment was valued at USD 209.4 billion in 2024
  • By Type - Deli meats segment accounted for the largest market revenue share in 2024

Market Size & Forecast

  • Market Opportunities: USD 251.2 billion
  • Market Future Opportunities: USD 147.7 billion
  • CAGR from 2025 to 2030 : 5.1%

Market Summary

  • The processed red meat market is a dynamic industry shaped by the interplay of consumer convenience, technological innovation, and evolving health perceptions. A core driver is the global demand for ready-to-eat and easy-to-prepare food solutions, which aligns with modern, time-constrained lifestyles. Manufacturers leverage advanced techniques like modified atmosphere packaging and high-pressure processing to enhance shelf-life extension technologies and food safety.
  • However, the sector faces headwinds from growing health consciousness, which has intensified scrutiny on ingredients like sodium nitrite and spurred a movement toward clean label meat formulation. For example, a mid-sized processor might pivot its strategy to focus on a line of nitrate-free processing products using natural preservative systems like celery powder, targeting a health-aware demographic.
  • This involves significant R&D investment and navigating complex supply chains for ethically sourced livestock. Concurrently, the competitive threat from plant-based meat alternatives compels continuous innovation in flavor, texture, and product formats. The industry's trajectory depends on balancing traditional appeal with the demands for healthier, more sustainable, and transparently produced goods, using tools like livestock traceability systems to build consumer trust.
  • The use of robotic processing automation is also becoming key for improving efficiency.

What will be the Size of the Processed Red Meat Market during the forecast period?

Get Key Insights on Market Forecast (PDF) Request Free Sample

How is the Processed Red Meat Market Segmented?

The processed red meat industry research report provides comprehensive data (region-wise segment analysis), with forecasts and estimates in "USD billion" for the period 2026-2030, as well as historical data from 2020-2024 for the following segments.

  • Product
    • Processed pork
    • Processed beef
    • Processed lamb
    • Others
  • Type
    • Deli meats
    • Sausages
    • Bacon
    • Others
  • Distribution channel
    • Supermarkets and hypermarkets
    • Butcher shops
    • Convenience stores
    • Online retail
  • Form factor
    • Refrigerated
    • Frozen
    • Canned
  • Geography
    • North America
      • US
      • Canada
      • Mexico
    • Europe
      • Germany
      • UK
      • France
    • APAC
      • China
      • Japan
      • Australia
    • South America
      • Brazil
      • Argentina
      • Colombia
    • Middle East and Africa
      • Saudi Arabia
      • South Africa
      • UAE
    • Rest of World (ROW)

By Product Insights

The processed pork segment is estimated to witness significant growth during the forecast period.

The processed pork segment, representing a substantial portion of the market, is driven by its cultural acceptance and versatility. Innovation focuses on health-oriented reformulations, utilizing sodium reduction technology and alternatives like celery powder curing agent in place of traditional nitrates.

Advanced methods like bacterial culture fermentation and precise dry-curing process control are employed for artisanal products, while industrial-scale production relies on ensuring meat batter stability and maximizing protein extraction efficiency.

The rise of direct-to-consumer meat delivery services has increased access to specialty items. Growing consumer interest in sustainable meat production is also influencing sourcing decisions.

Packaging innovations, such as portion-controlled meat packs, cater to modern lifestyles, with processors utilizing advanced smoke generation technology to create unique flavor profiles. This segment is significant, with its market value having grown by over 5% annually.

Request Free Sample

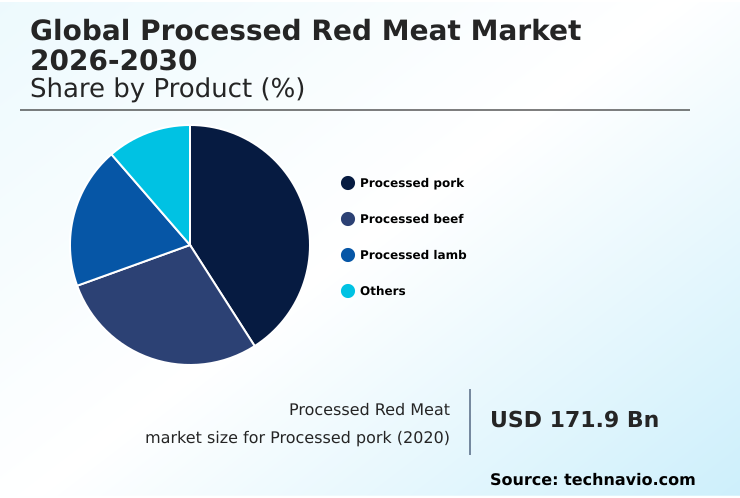
The Processed pork segment was valued at USD 209.4 billion in 2024 and showed a gradual increase during the forecast period.

Request Free Sample

Regional Analysis

North America is estimated to contribute 33% to the growth of the global market during the forecast period.Technavio’s analysts have elaborately explained the regional trends and drivers that shape the market during the forecast period.

See How Processed Red Meat Market Demand is Rising in North America Request Free Sample

The geographic landscape is defined by diverse regional preferences and regulatory standards. In mature markets like Europe, there is a strong emphasis on geographical indication labeling and animal welfare certification standards, driving demand for ethically sourced livestock.

Halal certified meat processing is non-negotiable in the Middle East and parts of Asia, while kosher meat processing standards are critical for specific segments. The demand for grass-fed beef processing and heritage breed pork products is rising globally.

Producers use advanced livestock traceability systems to verify claims related to antibiotic-free meat sourcing.

Processing techniques like meat grinding and emulsification and meat marination and injection are adapted to regional tastes, with texture profile analysis and sensory evaluation panels ensuring product quality.

Improving water-holding capacity remains a key technical goal to enhance yield, with some regions showing a 5.9% higher growth rate.
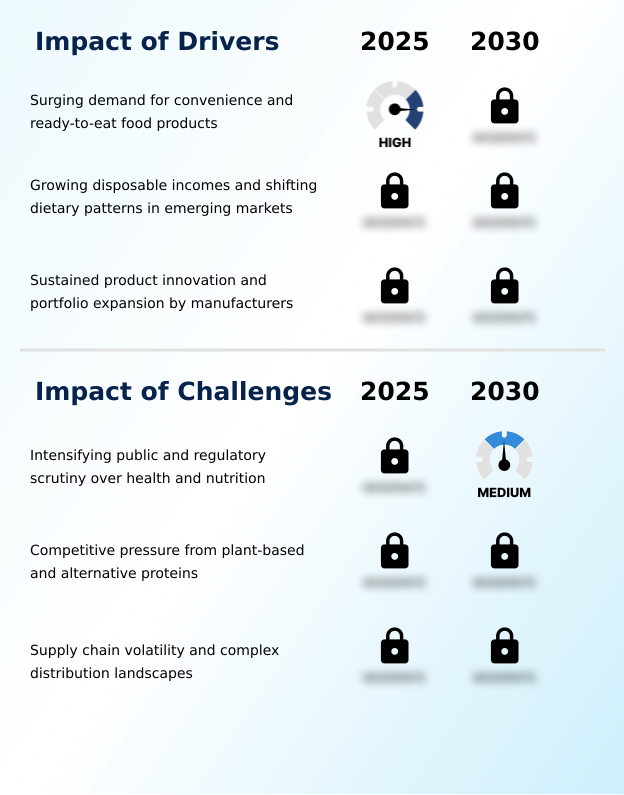
Market Dynamics

Our researchers analyzed the data with 2025 as the base year, along with the key drivers, trends, and challenges. A holistic analysis of drivers will help companies refine their marketing strategies to gain a competitive advantage.

  • The future of the global processed red meat market 2026-2030 is increasingly tied to navigating complex consumer demands and technological shifts. A key area of focus is the impact of natural preservatives on shelf-life, as the industry moves away from synthetic additives. This directly addresses the growing consumer perception of clean label meats, which has become a primary purchasing driver.
  • Operationally, the cost-benefit of robotic processing automation is a critical boardroom discussion, as firms seek to improve efficiency and mitigate labor shortages. For instance, facilities implementing automation have reported consistency improvements that reduce product rejects by over 20% compared to manual lines. The challenge of reducing sodium content in deli meats without compromising taste remains a significant R&D hurdle.
  • Meanwhile, the strategic threat posed by plant-based alternatives vs traditional sausages is forcing innovation in both product formulation and marketing. Technological advancements such as high-pressure processing for pathogen reduction are becoming standard for ensuring food safety. Furthermore, traceability systems for grass-fed beef are essential for validating premium claims and building consumer trust.
  • The logistical challenge of optimizing cold chain for refrigerated products continues to be a major operational focus. The role of heritage breeds in charcuterie is growing as producers seek differentiation through unique flavor profiles, even though it presents challenges of nitrate-free bacon production.
  • Exploring the effectiveness of celery powder as cure and enhancing flavor development in dry-cured hams are central to this premiumization trend. Finally, packaging innovations for meat snacks are catering to on-the-go consumption, while the environmental footprint of meat processing and adherence to halal certification requirements for exporters are becoming critical for global market access.
  • The market adoption of blended meat products and technical goals like improving water-holding capacity in ham and advances in sausage casing technology demonstrate the industry's multifaceted approach to future growth. Even the sensory analysis of reduced-fat sausages is now a key part of product development cycles.

What are the key market drivers leading to the rise in the adoption of Processed Red Meat Industry?

  • The surging global demand for convenience and ready-to-eat food products, driven by profound socioeconomic shifts, is a key driver for market expansion.

  • The relentless demand for convenience meal components and ready-to-eat protein solutions is a primary market driver.
  • This is supported by advancements in shelf-life extension technologies, including modified atmosphere packaging and vacuum packaging systems, which are critical for private label meat programs and meal kit ingredient sourcing.
  • Innovations like high-pressure processing improve food safety, while robotic processing automation enhances efficiency, reducing manual labor costs by up to 15%. The expansion of quick-service restaurant supply chains and foodservice meat applications further fuels growth.
  • Effective cold chain logistics management ensures product integrity for these value-added meat preparations, while traditional curing and smoking methods continue to be refined for premium product lines, with some processors reporting a 25% improvement in throughput after automation.

What are the market trends shaping the Processed Red Meat Industry?

  • A paradigm shift toward health-conscious product formulations is reshaping the industry. This trend reflects a growing consumer demand for cleaner ingredients and greater nutritional transparency.

  • The market is witnessing a significant shift toward premiumization and health-conscious offerings. There is a growing demand for gourmet charcuterie products and premium artisanal offerings, driving innovation in artisanal meat processing and traditional fermentation processing techniques.
  • Consumers are increasingly seeking nutritionally enhanced meats and reduced sodium formulations, pushing manufacturers toward clean label meat formulation and the adoption of natural preservative systems for nitrate-free processing. This trend has spurred development in casing technology for sausages and inspired new meat-based flavor profiles incorporating umami flavor enhancement and complex global cuisine flavor profiles.
  • These changes are also creating opportunities for convenient high-protein snack formats that align with wellness trends, with some firms seeing a 20% increase in sales for products with cleaner ingredient decks.

What challenges does the Processed Red Meat Industry face during its growth?

  • Intensifying public and regulatory scrutiny over the health and nutritional aspects of processed products presents a formidable challenge to industry growth.

  • The industry faces significant challenges from intensifying competition and regulatory pressures. The rise of plant-based meat alternatives and blended meat-plant products is capturing market share, with alternative protein sales growing at twice the rate of traditional meat. This necessitates innovation in frozen meat product innovations and refrigerated meat packaging.
  • Internally, processors are implementing stringent fat content reduction strategies and developing phosphate-free meat binders to meet health demands. Ensuring safety requires robust pathogen reduction interventions and comprehensive food safety HACCP plan implementation. Advanced technologies like x-ray inspection systems and metal detection in processing are now standard for mitigating contamination risks from foreign objects.
  • The traditional use of sodium nitrite preservation is under scrutiny, pushing firms to explore alternatives for both fresh and shelf-stable meat products and monitor for microbial spoilage indicators to avoid recalls.

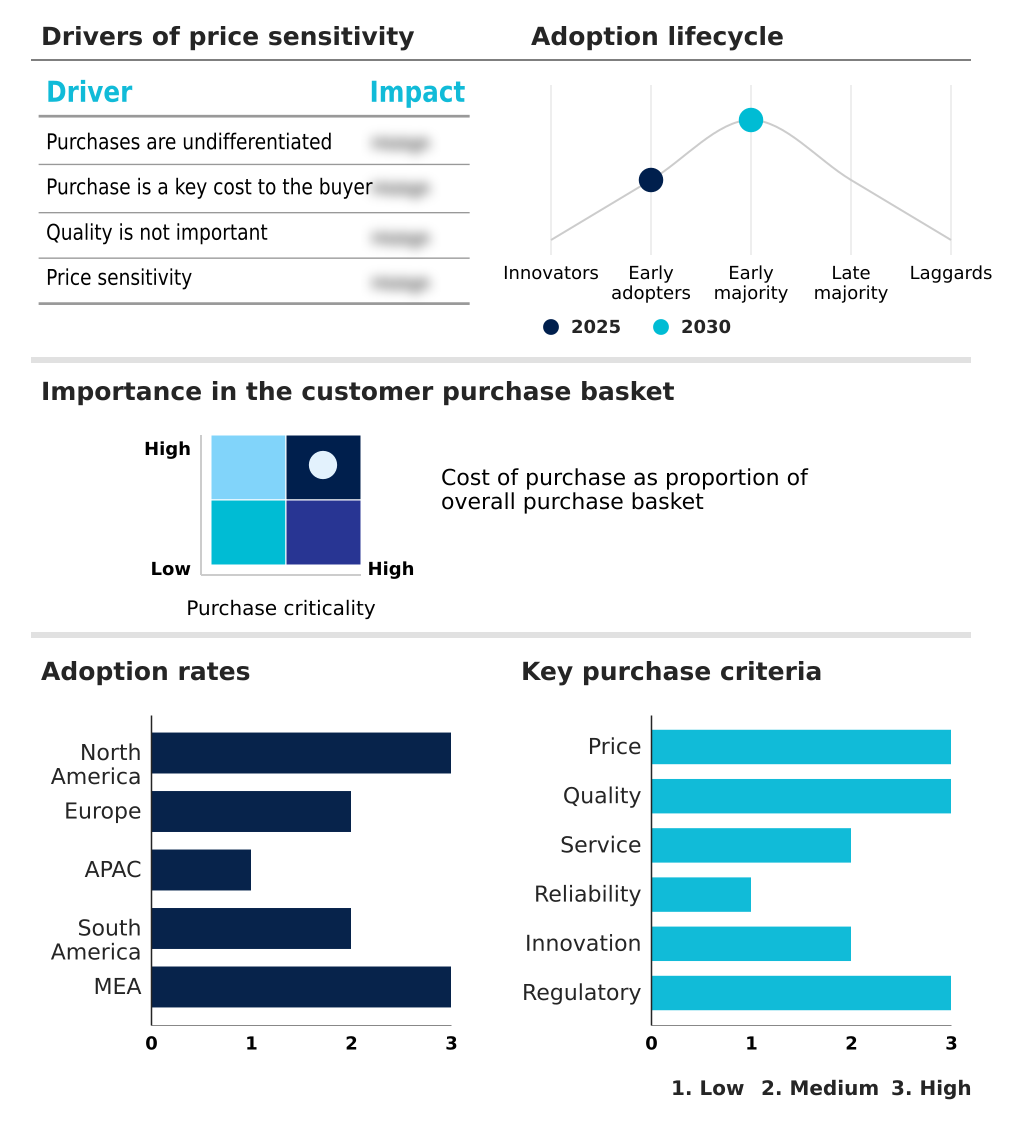
Exclusive Technavio Analysis on Customer Landscape

The processed red meat market forecasting report includes the adoption lifecycle of the market, covering from the innovator’s stage to the laggard’s stage. It focuses on adoption rates in different regions based on penetration. Furthermore, the processed red meat market report also includes key purchase criteria and drivers of price sensitivity to help companies evaluate and develop their market growth analysis strategies.

Customer Landscape of Processed Red Meat Industry

Competitive Landscape

Companies are implementing various strategies, such as strategic alliances, processed red meat market forecast, partnerships, mergers and acquisitions, geographical expansion, and product/service launches, to enhance their presence in the industry.

American Foods Group LLC - Offerings include a range of beef and pork products, focusing on beef processing and value-added meat solutions for diverse market applications.

The industry research and growth report includes detailed analyses of the competitive landscape of the market and information about key companies, including:

  • American Foods Group LLC
  • BRF SA
  • Cargill Inc.
  • Cherkizovo Group
  • Clemens Food Group
  • Cremonini SpA
  • Danish Crown AS
  • Dawn Farm Foods Ltd.
  • Foyle Food Group Ltd.
  • Hormel Foods Corp.
  • Itoham Yonekyu Holdings Inc.
  • JBS SA
  • Maple Leaf Foods Inc.
  • Marfrig Global Foods SA
  • Minerva Foods SA
  • NH Foods Ltd.
  • OSI Group LLC
  • Sunbulah Group
  • Sysco Corp.
  • Tyson Foods Inc.
  • WH Group Ltd.

Qualitative and quantitative analysis of companies has been conducted to help clients understand the wider business environment as well as the strengths and weaknesses of key industry players. Data is qualitatively analyzed to categorize companies as pure play, category-focused, industry-focused, and diversified; it is quantitatively analyzed to categorize companies as dominant, leading, strong, tentative, and weak.

Recent Development and News in Processed red meat market

  • In January, 2025, JBS SA expanded its portfolio by acquiring a 50 percent stake in South America's largest egg producer, Mantiqueira Brasil, signaling a strategic diversification into new protein segments.
  • In February, 2025, JBS USA announced a $200 million investment to upgrade its beef production facilities in Texas and Colorado, aiming to enhance operational efficiency and increase output.
  • In March, 2025, JBS SA allocated $100 million to establish two new meat processing plants in Vietnam, a strategic expansion to address the increasing demand for processed meat in Southeast Asia.
  • In May, 2025, MBRF Global Foods, the entity formed by the merger of Marfrig and BRF, completed a major capacity expansion across its South American facilities to boost processed beef production for export.

Dive into Technavio’s robust research methodology, blending expert interviews, extensive data synthesis, and validated models for unparalleled Processed Red Meat Market insights. See full methodology.

Market Scope
Page number 329
Base year 2025
Historic period 2020-2024
Forecast period 2026-2030
Growth momentum & CAGR Accelerate at a CAGR of 5.1%
Market growth 2026-2030 USD 147.7 billion
Market structure Fragmented
YoY growth 2025-2026(%) 4.9%
Key countries US, Canada, Mexico, Germany, UK, France, Italy, Spain, Russia, China, Japan, Australia, Indonesia, South Korea, India, Brazil, Argentina, Colombia, Saudi Arabia, South Africa, UAE, Egypt and Nigeria
Competitive landscape Leading Companies, Market Positioning of Companies, Competitive Strategies, and Industry Risks

Request Free Sample

Research Analyst Overview

  • The processed red meat market is navigating a complex transition, balancing high-volume production with demands for premium, healthier products. Key operational shifts include the adoption of robotic processing automation and advanced x-ray inspection systems to enhance safety and efficiency.
  • A central focus is on product reformulation, involving fat content reduction strategies and the development of phosphate-free meat binders to create clean label meat formulation. Firms are utilizing natural preservative systems and celery powder curing agent for nitrate-free processing, moving away from traditional sodium nitrite preservation. This requires precise dry-curing process control and advancements in smoke generation technology.
  • The entire supply chain is under review, from ensuring animal welfare certification standards to implementing robust food safety HACCP plan. Companies that have integrated comprehensive livestock traceability systems report a 30% reduction in time-to-traceability during mock recalls. This focus on transparency and quality, involving everything from meat batter stability to pathogen reduction interventions, defines the competitive landscape.
  • Success depends on mastering curing and smoking methods, optimizing water-holding capacity, and leveraging technologies like high-pressure processing and modified atmosphere packaging for shelf-life extension technologies. The industry is also refining meat grinding and emulsification processes and using sensory evaluation panels to perfect meat-based flavor profiles.

What are the Key Data Covered in this Processed Red Meat Market Research and Growth Report?

  • What is the expected growth of the Processed Red Meat Market between 2026 and 2030?

    • USD 147.7 billion, at a CAGR of 5.1%

  • What segmentation does the market report cover?

    • The report is segmented by Product (Processed pork, Processed beef, Processed lamb, and Others), Type (Deli meats, Sausages, Bacon, and Others), Distribution Channel (Supermarkets and hypermarkets, Butcher shops, Convenience stores, and Online retail), Form Factor (Refrigerated, Frozen, and Canned) and Geography (North America, Europe, APAC, South America, Middle East and Africa)

  • Which regions are analyzed in the report?

    • North America, Europe, APAC, South America and Middle East and Africa

  • What are the key growth drivers and market challenges?

    • Surging demand for convenience and ready-to-eat food products, Intensifying public and regulatory scrutiny over health and nutrition

  • Who are the major players in the Processed Red Meat Market?

    • American Foods Group LLC, BRF SA, Cargill Inc., Cherkizovo Group, Clemens Food Group, Cremonini SpA, Danish Crown AS, Dawn Farm Foods Ltd., Foyle Food Group Ltd., Hormel Foods Corp., Itoham Yonekyu Holdings Inc., JBS SA, Maple Leaf Foods Inc., Marfrig Global Foods SA, Minerva Foods SA, NH Foods Ltd., OSI Group LLC, Sunbulah Group, Sysco Corp., Tyson Foods Inc. and WH Group Ltd.

Market Research Insights

  • The market's dynamics are shaped by a push for both convenience and higher quality. The demand for ready-to-eat protein solutions and convenience meal components is expanding, with direct-to-consumer meat delivery models growing twice as fast as traditional retail channels.
  • This is met with a concurrent trend toward premium artisanal offerings and gourmet charcuterie products, where attributes like ethically sourced livestock justify higher price points. Manufacturers are innovating with global cuisine flavor profiles and value-added meat preparations to capture consumer interest.
  • For example, firms that have adopted reduced sodium formulations have seen a 15% increase in repeat purchases from health-conscious consumers. Meanwhile, the expansion of private label meat programs by major retailers is intensifying competition, often prioritizing cost-efficiency over premium attributes, leading to a bifurcated market strategy for many producers.

We can help! Our analysts can customize this processed red meat market research report to meet your requirements.

Get in touch

1. Executive Summary

1.1 Market overview

Executive Summary - Chart on Market Overview
Executive Summary - Data Table on Market Overview
Executive Summary - Chart on Global Market Characteristics
Executive Summary - Chart on Market by Geography
Executive Summary - Chart on Market Segmentation by Product
Executive Summary - Chart on Market Segmentation by Type
Executive Summary - Chart on Market Segmentation by Distribution Channel
Executive Summary - Chart on Market Segmentation by Form Factor
Executive Summary - Chart on Incremental Growth
Executive Summary - Data Table on Incremental Growth
Executive Summary - Chart on Company Market Positioning

2. Technavio Analysis

2.1 Analysis of price sensitivity, lifecycle, customer purchase basket, adoption rates, and purchase criteria

2.2 Criticality of inputs and Factors of differentiation

Chart on Overview on criticality of inputs and factors of differentiation

2.3 Factors of disruption

Chart on Overview on factors of disruption

2.4 Impact of drivers and challenges

Chart on Impact of drivers and challenges in 2025 and 2030

3. Market Landscape

3.1 Market ecosystem

Chart on Parent Market
Data Table on - Parent Market

3.2 Market characteristics

Chart on Market characteristics analysis

3.3 Value chain analysis

Chart on Value chain analysis

4. Market Sizing

4.1 Market definition

Data Table on Offerings of companies included in the market definition

4.2 Market segment analysis

Market segments

4.3 Market size 2025

4.4 Market outlook: Forecast for 2025-2030

Chart on Global - Market size and forecast 2025-2030 ($ billion)
Data Table on Global - Market size and forecast 2025-2030 ($ billion)
Chart on Global Market: Year-over-year growth 2025-2030 (%)
Data Table on Global Market: Year-over-year growth 2025-2030 (%)

5. Historic Market Size

5.1 Global Processed Red Meat Market 2020 - 2024

Historic Market Size - Data Table on Global Processed Red Meat Market 2020 - 2024 ($ billion)

5.2 Product segment analysis 2020 - 2024

Historic Market Size - Product Segment 2020 - 2024 ($ billion)

5.3 Type segment analysis 2020 - 2024

Historic Market Size - Type Segment 2020 - 2024 ($ billion)

5.4 Distribution Channel segment analysis 2020 - 2024

Historic Market Size - Distribution Channel Segment 2020 - 2024 ($ billion)

5.5 Form Factor segment analysis 2020 - 2024

Historic Market Size - Form Factor Segment 2020 - 2024 ($ billion)

5.6 Geography segment analysis 2020 - 2024

Historic Market Size - Geography Segment 2020 - 2024 ($ billion)

5.7 Country segment analysis 2020 - 2024

Historic Market Size - Country Segment 2020 - 2024 ($ billion)

6. Qualitative Analysis

6.1 Impact of AI on global processed red meat market

6.2 Impact of geopolitical conflicts on global processed red meat market

7. Five Forces Analysis

7.1 Five forces summary

Five forces analysis - Comparison between 2025 and 2030

7.2 Bargaining power of buyers

Bargaining power of buyers - Impact of key factors 2025 and 2030

7.3 Bargaining power of suppliers

Bargaining power of suppliers - Impact of key factors in 2025 and 2030

7.4 Threat of new entrants

Threat of new entrants - Impact of key factors in 2025 and 2030

7.5 Threat of substitutes

Threat of substitutes - Impact of key factors in 2025 and 2030

7.6 Threat of rivalry

Threat of rivalry - Impact of key factors in 2025 and 2030

7.7 Market condition

Chart on Market condition - Five forces 2025 and 2030

8. Market Segmentation by Product

8.1 Market segments

Chart on Product - Market share 2025-2030 (%)
Data Table on Product - Market share 2025-2030 (%)

8.2 Comparison by Product

Chart on Comparison by Product
Data Table on Comparison by Product

8.3 Processed pork - Market size and forecast 2025-2030

Chart on Processed pork - Market size and forecast 2025-2030 ($ billion)
Data Table on Processed pork - Market size and forecast 2025-2030 ($ billion)
Chart on Processed pork - Year-over-year growth 2025-2030 (%)
Data Table on Processed pork - Year-over-year growth 2025-2030 (%)

8.4 Processed beef - Market size and forecast 2025-2030

Chart on Processed beef - Market size and forecast 2025-2030 ($ billion)
Data Table on Processed beef - Market size and forecast 2025-2030 ($ billion)
Chart on Processed beef - Year-over-year growth 2025-2030 (%)
Data Table on Processed beef - Year-over-year growth 2025-2030 (%)

8.5 Processed lamb - Market size and forecast 2025-2030

Chart on Processed lamb - Market size and forecast 2025-2030 ($ billion)
Data Table on Processed lamb - Market size and forecast 2025-2030 ($ billion)
Chart on Processed lamb - Year-over-year growth 2025-2030 (%)
Data Table on Processed lamb - Year-over-year growth 2025-2030 (%)

8.6 Others - Market size and forecast 2025-2030

Chart on Others - Market size and forecast 2025-2030 ($ billion)
Data Table on Others - Market size and forecast 2025-2030 ($ billion)
Chart on Others - Year-over-year growth 2025-2030 (%)
Data Table on Others - Year-over-year growth 2025-2030 (%)

8.7 Market opportunity by Product

Market opportunity by Product ($ billion)
Data Table on Market opportunity by Product ($ billion)

9. Market Segmentation by Type

9.1 Market segments

Chart on Type - Market share 2025-2030 (%)
Data Table on Type - Market share 2025-2030 (%)

9.2 Comparison by Type

Chart on Comparison by Type
Data Table on Comparison by Type

9.3 Deli meats - Market size and forecast 2025-2030

Chart on Deli meats - Market size and forecast 2025-2030 ($ billion)
Data Table on Deli meats - Market size and forecast 2025-2030 ($ billion)
Chart on Deli meats - Year-over-year growth 2025-2030 (%)
Data Table on Deli meats - Year-over-year growth 2025-2030 (%)

9.4 Sausages - Market size and forecast 2025-2030

Chart on Sausages - Market size and forecast 2025-2030 ($ billion)
Data Table on Sausages - Market size and forecast 2025-2030 ($ billion)
Chart on Sausages - Year-over-year growth 2025-2030 (%)
Data Table on Sausages - Year-over-year growth 2025-2030 (%)

9.5 Bacon - Market size and forecast 2025-2030

Chart on Bacon - Market size and forecast 2025-2030 ($ billion)
Data Table on Bacon - Market size and forecast 2025-2030 ($ billion)
Chart on Bacon - Year-over-year growth 2025-2030 (%)
Data Table on Bacon - Year-over-year growth 2025-2030 (%)

9.6 Others - Market size and forecast 2025-2030

Chart on Others - Market size and forecast 2025-2030 ($ billion)
Data Table on Others - Market size and forecast 2025-2030 ($ billion)
Chart on Others - Year-over-year growth 2025-2030 (%)
Data Table on Others - Year-over-year growth 2025-2030 (%)

9.7 Market opportunity by Type

Market opportunity by Type ($ billion)
Data Table on Market opportunity by Type ($ billion)

10. Market Segmentation by Distribution Channel

10.1 Market segments

Chart on Distribution Channel - Market share 2025-2030 (%)
Data Table on Distribution Channel - Market share 2025-2030 (%)

10.2 Comparison by Distribution Channel

Chart on Comparison by Distribution Channel
Data Table on Comparison by Distribution Channel

10.3 Supermarkets and hypermarkets - Market size and forecast 2025-2030

Chart on Supermarkets and hypermarkets - Market size and forecast 2025-2030 ($ billion)
Data Table on Supermarkets and hypermarkets - Market size and forecast 2025-2030 ($ billion)
Chart on Supermarkets and hypermarkets - Year-over-year growth 2025-2030 (%)
Data Table on Supermarkets and hypermarkets - Year-over-year growth 2025-2030 (%)

10.4 Butcher shops - Market size and forecast 2025-2030

Chart on Butcher shops - Market size and forecast 2025-2030 ($ billion)
Data Table on Butcher shops - Market size and forecast 2025-2030 ($ billion)
Chart on Butcher shops - Year-over-year growth 2025-2030 (%)
Data Table on Butcher shops - Year-over-year growth 2025-2030 (%)

10.5 Convenience stores - Market size and forecast 2025-2030

Chart on Convenience stores - Market size and forecast 2025-2030 ($ billion)
Data Table on Convenience stores - Market size and forecast 2025-2030 ($ billion)
Chart on Convenience stores - Year-over-year growth 2025-2030 (%)
Data Table on Convenience stores - Year-over-year growth 2025-2030 (%)

10.6 Online retail - Market size and forecast 2025-2030

Chart on Online retail - Market size and forecast 2025-2030 ($ billion)
Data Table on Online retail - Market size and forecast 2025-2030 ($ billion)
Chart on Online retail - Year-over-year growth 2025-2030 (%)
Data Table on Online retail - Year-over-year growth 2025-2030 (%)

10.7 Market opportunity by Distribution Channel

Market opportunity by Distribution Channel ($ billion)
Data Table on Market opportunity by Distribution Channel ($ billion)

11. Market Segmentation by Form Factor

11.1 Market segments

Chart on Form Factor - Market share 2025-2030 (%)
Data Table on Form Factor - Market share 2025-2030 (%)

11.2 Comparison by Form Factor

Chart on Comparison by Form Factor
Data Table on Comparison by Form Factor

11.3 Refrigerated - Market size and forecast 2025-2030

Chart on Refrigerated - Market size and forecast 2025-2030 ($ billion)
Data Table on Refrigerated - Market size and forecast 2025-2030 ($ billion)
Chart on Refrigerated - Year-over-year growth 2025-2030 (%)
Data Table on Refrigerated - Year-over-year growth 2025-2030 (%)

11.4 Frozen - Market size and forecast 2025-2030

Chart on Frozen - Market size and forecast 2025-2030 ($ billion)
Data Table on Frozen - Market size and forecast 2025-2030 ($ billion)
Chart on Frozen - Year-over-year growth 2025-2030 (%)
Data Table on Frozen - Year-over-year growth 2025-2030 (%)

11.5 Canned - Market size and forecast 2025-2030

Chart on Canned - Market size and forecast 2025-2030 ($ billion)
Data Table on Canned - Market size and forecast 2025-2030 ($ billion)
Chart on Canned - Year-over-year growth 2025-2030 (%)
Data Table on Canned - Year-over-year growth 2025-2030 (%)

11.6 Market opportunity by Form Factor

Market opportunity by Form Factor ($ billion)
Data Table on Market opportunity by Form Factor ($ billion)

12. Customer Landscape

12.1 Customer landscape overview

Analysis of price sensitivity, lifecycle, customer purchase basket, adoption rates, and purchase criteria

13. Geographic Landscape

13.1 Geographic segmentation

Chart on Market share by geography 2025-2030 (%)
Data Table on Market share by geography 2025-2030 (%)

13.2 Geographic comparison

Chart on Geographic comparison
Data Table on Geographic comparison

13.3 North America - Market size and forecast 2025-2030

Chart on North America - Market size and forecast 2025-2030 ($ billion)
Data Table on North America - Market size and forecast 2025-2030 ($ billion)
Chart on North America - Year-over-year growth 2025-2030 (%)
Data Table on North America - Year-over-year growth 2025-2030 (%)
Chart on Regional Comparison - North America
Data Table on Regional Comparison - North America

13.3.1 US - Market size and forecast 2025-2030

Chart on US - Market size and forecast 2025-2030 ($ billion)
Data Table on US - Market size and forecast 2025-2030 ($ billion)
Chart on US - Year-over-year growth 2025-2030 (%)
Data Table on US - Year-over-year growth 2025-2030 (%)

13.3.2 Canada - Market size and forecast 2025-2030

Chart on Canada - Market size and forecast 2025-2030 ($ billion)
Data Table on Canada - Market size and forecast 2025-2030 ($ billion)
Chart on Canada - Year-over-year growth 2025-2030 (%)
Data Table on Canada - Year-over-year growth 2025-2030 (%)

13.3.3 Mexico - Market size and forecast 2025-2030

Chart on Mexico - Market size and forecast 2025-2030 ($ billion)
Data Table on Mexico - Market size and forecast 2025-2030 ($ billion)
Chart on Mexico - Year-over-year growth 2025-2030 (%)
Data Table on Mexico - Year-over-year growth 2025-2030 (%)

13.4 Europe - Market size and forecast 2025-2030

Chart on Europe - Market size and forecast 2025-2030 ($ billion)
Data Table on Europe - Market size and forecast 2025-2030 ($ billion)
Chart on Europe - Year-over-year growth 2025-2030 (%)
Data Table on Europe - Year-over-year growth 2025-2030 (%)
Chart on Regional Comparison - Europe
Data Table on Regional Comparison - Europe

13.4.1 Germany - Market size and forecast 2025-2030

Chart on Germany - Market size and forecast 2025-2030 ($ billion)
Data Table on Germany - Market size and forecast 2025-2030 ($ billion)
Chart on Germany - Year-over-year growth 2025-2030 (%)
Data Table on Germany - Year-over-year growth 2025-2030 (%)

13.4.2 UK - Market size and forecast 2025-2030

Chart on UK - Market size and forecast 2025-2030 ($ billion)
Data Table on UK - Market size and forecast 2025-2030 ($ billion)
Chart on UK - Year-over-year growth 2025-2030 (%)
Data Table on UK - Year-over-year growth 2025-2030 (%)

13.4.3 France - Market size and forecast 2025-2030

Chart on France - Market size and forecast 2025-2030 ($ billion)
Data Table on France - Market size and forecast 2025-2030 ($ billion)
Chart on France - Year-over-year growth 2025-2030 (%)
Data Table on France - Year-over-year growth 2025-2030 (%)

13.4.4 Italy - Market size and forecast 2025-2030

Chart on Italy - Market size and forecast 2025-2030 ($ billion)
Data Table on Italy - Market size and forecast 2025-2030 ($ billion)
Chart on Italy - Year-over-year growth 2025-2030 (%)
Data Table on Italy - Year-over-year growth 2025-2030 (%)

13.4.5 Spain - Market size and forecast 2025-2030

Chart on Spain - Market size and forecast 2025-2030 ($ billion)
Data Table on Spain - Market size and forecast 2025-2030 ($ billion)
Chart on Spain - Year-over-year growth 2025-2030 (%)
Data Table on Spain - Year-over-year growth 2025-2030 (%)

13.4.6 Russia - Market size and forecast 2025-2030

Chart on Russia - Market size and forecast 2025-2030 ($ billion)
Data Table on Russia - Market size and forecast 2025-2030 ($ billion)
Chart on Russia - Year-over-year growth 2025-2030 (%)
Data Table on Russia - Year-over-year growth 2025-2030 (%)

13.5 APAC - Market size and forecast 2025-2030

Chart on APAC - Market size and forecast 2025-2030 ($ billion)
Data Table on APAC - Market size and forecast 2025-2030 ($ billion)
Chart on APAC - Year-over-year growth 2025-2030 (%)
Data Table on APAC - Year-over-year growth 2025-2030 (%)
Chart on Regional Comparison - APAC
Data Table on Regional Comparison - APAC

13.5.1 China - Market size and forecast 2025-2030

Chart on China - Market size and forecast 2025-2030 ($ billion)
Data Table on China - Market size and forecast 2025-2030 ($ billion)
Chart on China - Year-over-year growth 2025-2030 (%)
Data Table on China - Year-over-year growth 2025-2030 (%)

13.5.2 Japan - Market size and forecast 2025-2030

Chart on Japan - Market size and forecast 2025-2030 ($ billion)
Data Table on Japan - Market size and forecast 2025-2030 ($ billion)
Chart on Japan - Year-over-year growth 2025-2030 (%)
Data Table on Japan - Year-over-year growth 2025-2030 (%)

13.5.3 Australia - Market size and forecast 2025-2030

Chart on Australia - Market size and forecast 2025-2030 ($ billion)
Data Table on Australia - Market size and forecast 2025-2030 ($ billion)
Chart on Australia - Year-over-year growth 2025-2030 (%)
Data Table on Australia - Year-over-year growth 2025-2030 (%)

13.5.4 Indonesia - Market size and forecast 2025-2030

Chart on Indonesia - Market size and forecast 2025-2030 ($ billion)
Data Table on Indonesia - Market size and forecast 2025-2030 ($ billion)
Chart on Indonesia - Year-over-year growth 2025-2030 (%)
Data Table on Indonesia - Year-over-year growth 2025-2030 (%)

13.5.5 South Korea - Market size and forecast 2025-2030

Chart on South Korea - Market size and forecast 2025-2030 ($ billion)
Data Table on South Korea - Market size and forecast 2025-2030 ($ billion)
Chart on South Korea - Year-over-year growth 2025-2030 (%)
Data Table on South Korea - Year-over-year growth 2025-2030 (%)

13.5.6 India - Market size and forecast 2025-2030

Chart on India - Market size and forecast 2025-2030 ($ billion)
Data Table on India - Market size and forecast 2025-2030 ($ billion)
Chart on India - Year-over-year growth 2025-2030 (%)
Data Table on India - Year-over-year growth 2025-2030 (%)

13.6 South America - Market size and forecast 2025-2030

Chart on South America - Market size and forecast 2025-2030 ($ billion)
Data Table on South America - Market size and forecast 2025-2030 ($ billion)
Chart on South America - Year-over-year growth 2025-2030 (%)
Data Table on South America - Year-over-year growth 2025-2030 (%)
Chart on Regional Comparison - South America
Data Table on Regional Comparison - South America

13.6.1 Brazil - Market size and forecast 2025-2030

Chart on Brazil - Market size and forecast 2025-2030 ($ billion)
Data Table on Brazil - Market size and forecast 2025-2030 ($ billion)
Chart on Brazil - Year-over-year growth 2025-2030 (%)
Data Table on Brazil - Year-over-year growth 2025-2030 (%)

13.6.2 Argentina - Market size and forecast 2025-2030

Chart on Argentina - Market size and forecast 2025-2030 ($ billion)
Data Table on Argentina - Market size and forecast 2025-2030 ($ billion)
Chart on Argentina - Year-over-year growth 2025-2030 (%)
Data Table on Argentina - Year-over-year growth 2025-2030 (%)

13.6.3 Colombia - Market size and forecast 2025-2030

Chart on Colombia - Market size and forecast 2025-2030 ($ billion)
Data Table on Colombia - Market size and forecast 2025-2030 ($ billion)
Chart on Colombia - Year-over-year growth 2025-2030 (%)
Data Table on Colombia - Year-over-year growth 2025-2030 (%)

13.7 Middle East and Africa - Market size and forecast 2025-2030

Chart on Middle East and Africa - Market size and forecast 2025-2030 ($ billion)
Data Table on Middle East and Africa - Market size and forecast 2025-2030 ($ billion)
Chart on Middle East and Africa - Year-over-year growth 2025-2030 (%)
Data Table on Middle East and Africa - Year-over-year growth 2025-2030 (%)
Chart on Regional Comparison - Middle East and Africa
Data Table on Regional Comparison - Middle East and Africa

13.7.1 Saudi Arabia - Market size and forecast 2025-2030

Chart on Saudi Arabia - Market size and forecast 2025-2030 ($ billion)
Data Table on Saudi Arabia - Market size and forecast 2025-2030 ($ billion)
Chart on Saudi Arabia - Year-over-year growth 2025-2030 (%)
Data Table on Saudi Arabia - Year-over-year growth 2025-2030 (%)

13.7.2 South Africa - Market size and forecast 2025-2030

Chart on South Africa - Market size and forecast 2025-2030 ($ billion)
Data Table on South Africa - Market size and forecast 2025-2030 ($ billion)
Chart on South Africa - Year-over-year growth 2025-2030 (%)
Data Table on South Africa - Year-over-year growth 2025-2030 (%)

13.7.3 UAE - Market size and forecast 2025-2030

Chart on UAE - Market size and forecast 2025-2030 ($ billion)
Data Table on UAE - Market size and forecast 2025-2030 ($ billion)
Chart on UAE - Year-over-year growth 2025-2030 (%)
Data Table on UAE - Year-over-year growth 2025-2030 (%)

13.7.4 Egypt - Market size and forecast 2025-2030

Chart on Egypt - Market size and forecast 2025-2030 ($ billion)
Data Table on Egypt - Market size and forecast 2025-2030 ($ billion)
Chart on Egypt - Year-over-year growth 2025-2030 (%)
Data Table on Egypt - Year-over-year growth 2025-2030 (%)

13.7.5 Nigeria - Market size and forecast 2025-2030

Chart on Nigeria - Market size and forecast 2025-2030 ($ billion)
Data Table on Nigeria - Market size and forecast 2025-2030 ($ billion)
Chart on Nigeria - Year-over-year growth 2025-2030 (%)
Data Table on Nigeria - Year-over-year growth 2025-2030 (%)

13.8 Market opportunity by geography

Market opportunity by geography ($ billion)
Data Tables on Market opportunity by geography ($ billion)

14. Drivers, Challenges, and Opportunity

14.1 Market drivers

Surging demand for convenience and ready-to-eat food products
Growing disposable incomes and shifting dietary patterns in emerging markets
Sustained product innovation and portfolio expansion by manufacturers

14.2 Market challenges

Intensifying public and regulatory scrutiny over health and nutrition
Competitive pressure from plant-based and alternative proteins
Supply chain volatility and complex distribution landscapes

14.3 Impact of drivers and challenges

Impact of drivers and challenges in 2025 and 2030

14.4 Market opportunities

Paradigm shift towards health-conscious product formulations
Rise of premiumization and exploration of novel flavors
Imperative of sustainability and ethical sourcing in consumer decision-making

15. Competitive Landscape

15.1 Overview

15.2

Overview on criticality of inputs and factors of differentiation

15.3 Landscape disruption

Overview on factors of disruption

15.4 Industry risks

Impact of key risks on business

16. Competitive Analysis

16.1 Companies profiled

Companies covered

16.2 Company ranking index

16.3 Market positioning of companies

Matrix on companies position and classification

16.4 American Foods Group LLC

American Foods Group LLC - Overview
American Foods Group LLC - Product / Service
American Foods Group LLC - Key offerings
SWOT

16.5 BRF SA

BRF SA - Overview
BRF SA - Product / Service
BRF SA - Key offerings
SWOT

16.6 Cargill Inc.

Cargill Inc. - Overview
Cargill Inc. - Product / Service
Cargill Inc. - Key offerings
SWOT

16.7 Clemens Food Group

Clemens Food Group - Overview
Clemens Food Group - Product / Service
Clemens Food Group - Key offerings
SWOT

16.8 Foyle Food Group Ltd.

Foyle Food Group Ltd. - Overview
Foyle Food Group Ltd. - Product / Service
Foyle Food Group Ltd. - Key offerings
SWOT

16.9 Hormel Foods Corp.

Hormel Foods Corp. - Overview
Hormel Foods Corp. - Business segments
Hormel Foods Corp. - Key offerings
Hormel Foods Corp. - Segment focus
SWOT

16.10 Itoham Yonekyu Holdings Inc.

Itoham Yonekyu Holdings Inc. - Overview
Itoham Yonekyu Holdings Inc. - Business segments
Itoham Yonekyu Holdings Inc. - Key offerings
Itoham Yonekyu Holdings Inc. - Segment focus
SWOT

16.11 JBS SA

JBS SA - Overview
JBS SA - Business segments
JBS SA - Key offerings
JBS SA - Segment focus
SWOT

16.12 Maple Leaf Foods Inc.

Maple Leaf Foods Inc. - Overview
Maple Leaf Foods Inc. - Business segments
Maple Leaf Foods Inc. - Key offerings
Maple Leaf Foods Inc. - Segment focus
SWOT

16.13 Minerva Foods SA

Minerva Foods SA - Overview
Minerva Foods SA - Business segments
Minerva Foods SA - Key offerings
Minerva Foods SA - Segment focus
SWOT

16.14 OSI Group LLC

OSI Group LLC - Overview
OSI Group LLC - Product / Service
OSI Group LLC - Key offerings
SWOT

16.15 Sunbulah Group

Sunbulah Group - Overview
Sunbulah Group - Product / Service
Sunbulah Group - Key offerings
SWOT

16.16 Sysco Corp.

Sysco Corp. - Overview
Sysco Corp. - Business segments
Sysco Corp. - Key news
Sysco Corp. - Key offerings
Sysco Corp. - Segment focus
SWOT

16.17 Tyson Foods Inc.

Tyson Foods Inc. - Overview
Tyson Foods Inc. - Business segments
Tyson Foods Inc. - Key news
Tyson Foods Inc. - Key offerings
Tyson Foods Inc. - Segment focus
SWOT

16.18 WH Group Ltd.

WH Group Ltd. - Overview
WH Group Ltd. - Business segments
WH Group Ltd. - Key offerings
WH Group Ltd. - Segment focus
SWOT

17. Appendix

17.1 Scope of the report

Market definition
Objectives
Notes and caveats

17.2 Inclusions and exclusions checklist

Inclusions checklist
Exclusions checklist

17.3 Currency conversion rates for US$

17.4 Research methodology

17.5 Data procurement

Information sources

17.6 Data validation

17.7 Validation techniques employed for market sizing

17.8 Data synthesis

17.9 360 degree market analysis

17.10 List of abbreviations

Research Methodology

Technavio presents a detailed picture of the market by way of study, synthesis, and summation of data from multiple sources. The analysts have presented the various facets of the market with a particular focus on identifying the key industry influencers. The data thus presented is comprehensive, reliable, and the result of extensive research, both primary and secondary.

INFORMATION SOURCES

Primary sources

  • Manufacturers and suppliers
  • Channel partners
  • Industry experts
  • Strategic decision makers

Secondary sources

  • Industry journals and periodicals
  • Government data
  • Financial reports of key industry players
  • Historical data
  • Press releases

DATA ANALYSIS

Data Synthesis

  • Collation of data
  • Estimation of key figures
  • Analysis of derived insights

Data Validation

  • Triangulation with data models
  • Reference against proprietary databases
  • Corroboration with industry experts

REPORT WRITING

Qualitative

  • Market drivers
  • Market challenges
  • Market trends
  • Five forces analysis

Quantitative

  • Market size and forecast
  • Market segmentation
  • Geographical insights
  • Competitive landscape

Interested in this report?

Get your sample now to see our research methodology and insights!

Download Now

Frequently Asked Questions

Processed Red Meat market growth will increase by USD 147.7 billion during 2026-2030.

The Processed Red Meat market is expected to grow at a CAGR of 5.1% during 2026-2030.

Processed Red Meat market is segmented by Product (Processed pork, Processed beef, Processed lamb, Others) Type (Deli meats, Sausages, Bacon, Others) Distribution channel (Supermarkets and hypermarkets, Butcher shops, Convenience stores, Online retail) Form factor (Refrigerated, Frozen, Canned)

American Foods Group LLC, BRF SA, Cargill Inc., Cherkizovo Group, Clemens Food Group, Cremonini SpA, Danish Crown AS, Dawn Farm Foods Ltd., Foyle Food Group Ltd., Hormel Foods Corp., Itoham Yonekyu Holdings Inc., JBS SA, Maple Leaf Foods Inc., Marfrig Global Foods SA, Minerva Foods SA, NH Foods Ltd., OSI Group LLC, Sunbulah Group, Sysco Corp., Tyson Foods Inc., WH Group Ltd. are a few of the key vendors in the Processed Red Meat market.

North America will register the highest growth rate of 33% among the other regions. Therefore, the Processed Red Meat market in North America is expected to garner significant business opportunities for the vendors during the forecast period.

US, Canada, Mexico, Germany, UK, France, Italy, Spain, Russia, China, Japan, Australia, Indonesia, South Korea, India, Brazil, Argentina, Colombia, Saudi Arabia, South Africa, UAE, Egypt, Nigeria

  • Surging demand for convenience and ready-to-eat food products is the driving factor this market.

The Processed Red Meat market vendors should focus on grabbing business opportunities from the Product segment as it accounted for the largest market share in the base year.
RIA - Research AI Assistant
Ask RIA