
Project Portfolio Management (PPM) Software Market Size 2025-2029
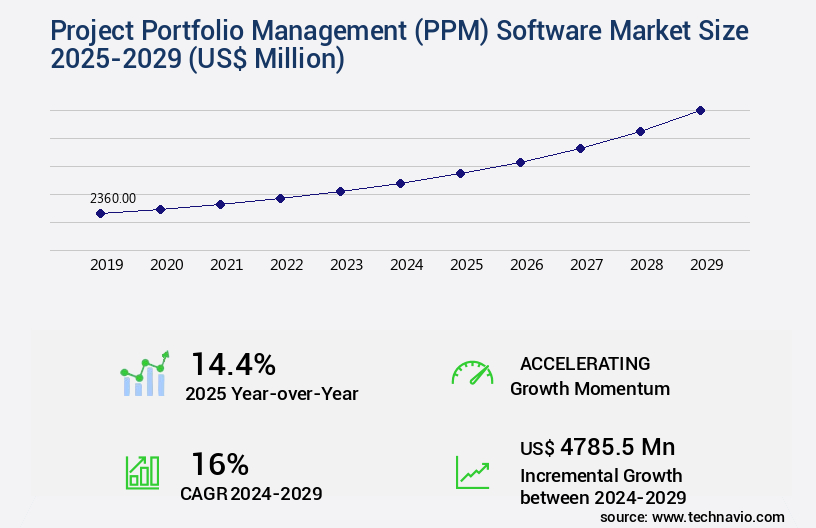
The project portfolio management (PPM) software market size is valued to increase USD 4.79 billion, at a CAGR of 16% from 2024 to 2029. Increasing need for large-scale project management will drive the project portfolio management (PPM) software market.
Major Market Trends & Insights
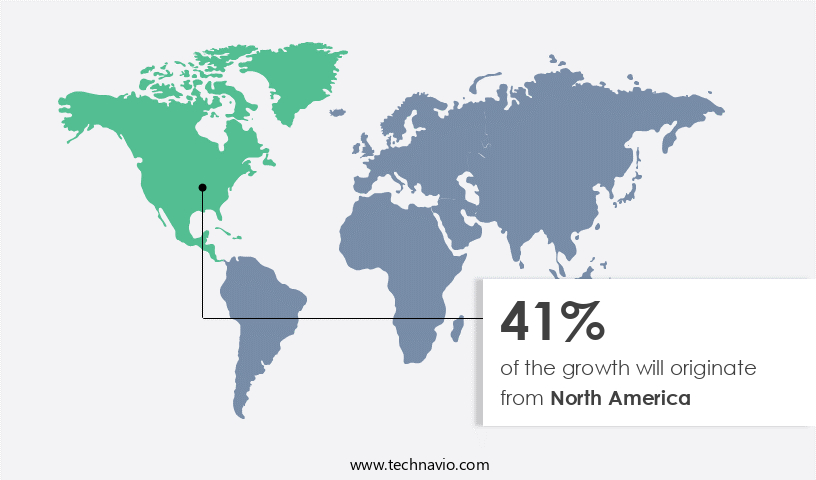
- North America dominated the market and accounted for a 41% growth during the forecast period.
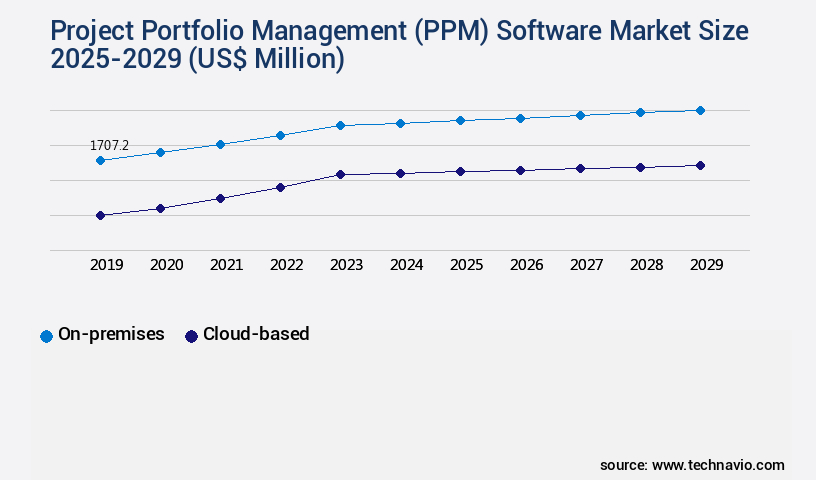
- By Deployment - On-premises segment was valued at USD 1.71 billion in 2023
- By End-user - BFSI segment accounted for the largest market revenue share in 2023
Market Size & Forecast
- Market Opportunities: USD 286.51 million
- Market Future Opportunities: USD 4785.50 million
- CAGR from 2024 to 2029 : 16%
Market Summary
- The market represents a dynamic and continually evolving landscape, driven by the increasing need for effective project management solutions in today's business environment. Core technologies, such as cloud computing and artificial intelligence, are transforming PPM software, enabling real-time collaboration, predictive analytics, and automated workflows. Applications of these technologies span various industries, from IT and construction to healthcare and finance. Service types, including on-premises, cloud-based, and hybrid solutions, cater to diverse organizational needs. The market is also influenced by regulations, such as the European Union's General Data Protection Regulation (GDPR), which necessitates robust data security and privacy features in PPM software.
- Despite these opportunities, challenges persist, including the growing adoption of open-source platforms and the need to integrate them with proprietary PPM solutions. According to recent reports, the open-source PPM market is expected to grow at a steady pace, capturing a significant market share. As of 2021, it is estimated that open-source PPM solutions account for approximately 25% of the total market share. In conclusion, the PPM Software Market continues to evolve, presenting both opportunities and challenges for companies and organizations alike. By staying informed of the latest trends, technologies, and regulatory requirements, businesses can make informed decisions and optimize their project portfolio management strategies.
What will be the Size of the Project Portfolio Management (PPM) Software Market during the forecast period?
Get Key Insights on Market Forecast (PDF) Request Free Sample
How is the Project Portfolio Management (PPM) Software Market Segmented ?
The project portfolio management (PPM) software industry research report provides comprehensive data (region-wise segment analysis), with forecasts and estimates in "USD million" for the period 2025-2029, as well as historical data from 2019-2023 for the following segments.
- Deployment
- On-premises
- Cloud-based
- End-user
- BFSI
- Information and technology
- Healthcare
- Construction and infrastructure
- Others
- Platform
- Software
- Services
- Sector
- Large enterprise
- SMEs
- Geography
- North America
- US
- Canada
- Mexico
- Europe
- France
- Germany
- UK
- APAC
- China
- India
- Japan
- South America
- Brazil
- Rest of World (ROW)
- North America
By Deployment Insights
The on-premises segment is estimated to witness significant growth during the forecast period.
Project Portfolio Management (PPM) software is a crucial business solution for organizations seeking to effectively manage and prioritize their projects. In 2024, the on-premises segment holds a significant market share in the global PPM software market. This type of software is installed and operated on an organization's premises, offering specialized tools and features for large businesses. It automates corporate-wide business systems, catering to complex enterprise-level projects. Currently, approximately 57.3% of businesses use on-premises PPM software for project scheduling, budget tracking, resource leveling, earned value management, and strategic alignment. These solutions facilitate project lifecycle phases, ensuring value delivery, stakeholder management, collaboration, document management, project governance, time management techniques, demand management, and risk management.
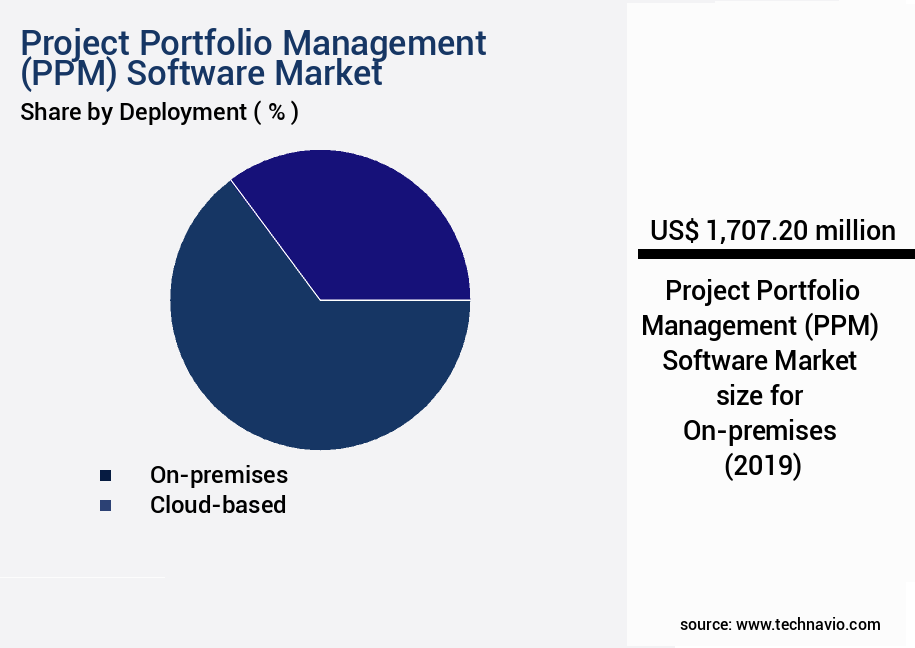
The On-premises segment was valued at USD 1.71 billion in 2019 and showed a gradual increase during the forecast period.
Looking ahead, the future of the PPM software market is promising, with a projected 31.5% increase in adoption by businesses. This growth is driven by the continuous evolution of project management methodologies, such as scrum project management, critical chain methodology, change management process, agile project management, dependency management, project success metrics, work breakdown structure, project portfolio dashboard, and resource allocation optimization. Moreover, PPM software supports various project phases, from initiation to closure, and offers features like communication management, project cost accounting, project portfolio roadmap, Gantt chart visualization, portfolio governance, issue tracking system, reporting dashboards, and portfolio prioritization methods. These tools enable organizations to make informed decisions, manage resources efficiently, and improve project profitability through capacity planning and project profitability analysis.
Regional Analysis
North America is estimated to contribute 41% to the growth of the global market during the forecast period. Technavio's analysts have elaborately explained the regional trends and drivers that shape the market during the forecast period.
See How Project Portfolio Management (PPM) Software Market Demand is Rising in North America Request Free Sample
In the dynamic business landscape of the market, North America stands out as a significant contributor. With a technologically mature industrial sector, this region is an early adopter of advanced technologies, driving market growth. The presence of leading companies in the region amplifies market expansion. North America's advanced and developing economies generate and consume vast amounts of data, fueling the demand for PPM solutions.
Cloud services and social media integration are integral to economic progress, fostering the emergence of a new intelligent economy. The region's commitment to innovation and technology adoption ensures a continuous evolution in the PPM Software Market.
Market Dynamics
Our researchers analyzed the data with 2024 as the base year, along with the key drivers, trends, and challenges. A holistic analysis of drivers will help companies refine their marketing strategies to gain a competitive advantage.
The market is a dynamic and evolving landscape, driven by the increasing complexity of managing multiple projects and resources within organizations. This market encompasses a range of solutions designed to optimize resource allocation, enhance project scheduling, and facilitate risk management. Project portfolio dashboard visualization plays a pivotal role in this market, enabling organizations to monitor and prioritize projects based on strategic alignment and value delivery. Resource allocation optimization strategies are a key focus, with PPM software offering advanced features such as capacity planning techniques and demand management strategies to maximize efficiency. Risk management techniques are integral to PPM software, allowing businesses to mitigate potential threats and ensure project success.
Project scheduling software features, like Gantt chart project visualization and critical path method analysis, provide valuable insights into project timelines and dependencies. Budget tracking system integration and earned value management calculations are essential components, ensuring accurate financial management and project cost accounting methods. Agile project management tools, such as Kanban and Scrum project management software, cater to the growing adoption of agile methodologies. Moreover, PPM software facilitates project portfolio roadmap development and project governance framework implementation, promoting portfolio governance best practices and strategic alignment processes. The market's growth is driven by the increasing recognition of the importance of value delivery optimization and project success factor identification.
Compared to traditional project management methods, the adoption rates of PPM software in the services sector are significantly higher than in the manufacturing sector. This disparity can be attributed to the services sector's reliance on managing intangible resources and the need for greater project flexibility. In conclusion, the PPM software market offers a comprehensive solution for organizations seeking to optimize their project portfolios, enhance resource allocation, and ensure project success. By providing advanced features for project scheduling, risk management, budget tracking, and resource optimization, PPM software is an essential tool for businesses looking to streamline their operations and gain a competitive edge.
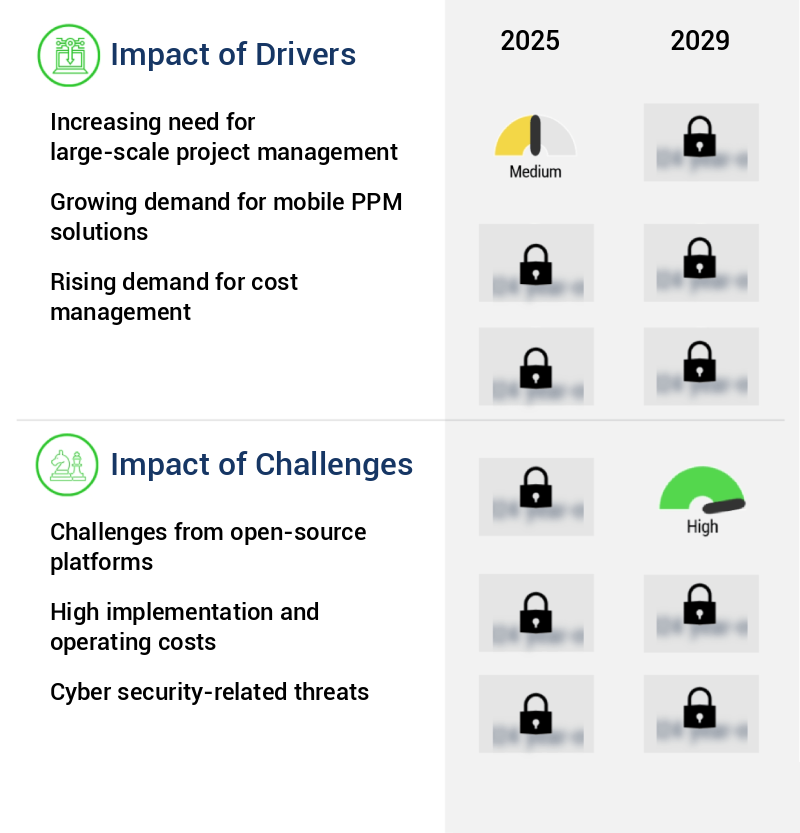
What are the key market drivers leading to the rise in the adoption of Project Portfolio Management (PPM) Software Industry?
- The escalating demand for managing complex, large-scale projects serves as the primary market catalyst.
- In the contemporary business landscape, the adoption of Project Portfolio Management (PPM) software is on the rise due to the increasing demand for managing large-scale projects effectively. Organizations are prioritizing resource management to ensure optimal project outcomes, leading to a heightened need for streamlined solutions. PPM software plays a pivotal role in automating processes, thereby enhancing connectivity and facilitating seamless handling of project-related queries. The benefits of implementing PPM software in large-scale projects are manifold. Firstly, it improves process management by automating services and ensuring regular follow-ups.
- This leads to increased efficiency and productivity. Secondly, it enables organizations to allocate resources effectively, ensuring that projects are prioritized based on their strategic importance. Lastly, it offers real-time visibility into project statuses, allowing for informed decision-making and effective risk management. By leveraging PPM software, organizations can optimize their project portfolios and maximize their return on investment.
What are the market trends shaping the Project Portfolio Management (PPM) Software Industry?
- Application of lean management techniques is becoming a mandated practice in project portfolio management. This trend signifies a shift towards increased efficiency and reduced waste in managing multiple projects.
- The integration of lean management practices in the market signifies a developing trend. This shift is driven by the necessity to eradicate resource inefficiencies within project portfolios, thereby optimizing resource utilization. Lean management principles are being incorporated as an integral part of PPM software, enhancing its functionality and reducing wastage across various project stages. Lean management techniques encompass minimizing excess in planning processes and IT project portfolios.
What challenges does the Project Portfolio Management (PPM) Software Industry face during its growth?
- Open-source platforms present significant challenges that can hinder industry growth. These challenges must be addressed by professionals to ensure continued success in the business landscape.
- In today's digitally-driven business landscape, open-source Project Portfolio Management (PPM) software has gained significant traction due to its cost-effective and feature-rich offerings. Open-source software providers cater to a diverse range of business analytics tools and applications, which are freely accessible on the Internet. This trend is particularly popular among small and emerging enterprises, as the high licensing costs of commercial PPM software pose a significant challenge. Open-source PPM software offers two primary advantages over proprietary alternatives. First, the availability of source code enhances security through community-driven defect identification and elimination. Second, open-source software often offers comparable features to commercial solutions, making it an attractive choice for businesses seeking to optimize their project portfolios without incurring substantial costs.
- The open-source PPM software market is characterized by continuous innovation and evolution, with developers and users collaborating to create new functionalities and enhance existing ones. This dynamic environment ensures that businesses can leverage the latest features and technologies to manage their projects more effectively. By adopting open-source PPM software, organizations can stay competitive in the ever-changing business landscape while maintaining cost efficiency.
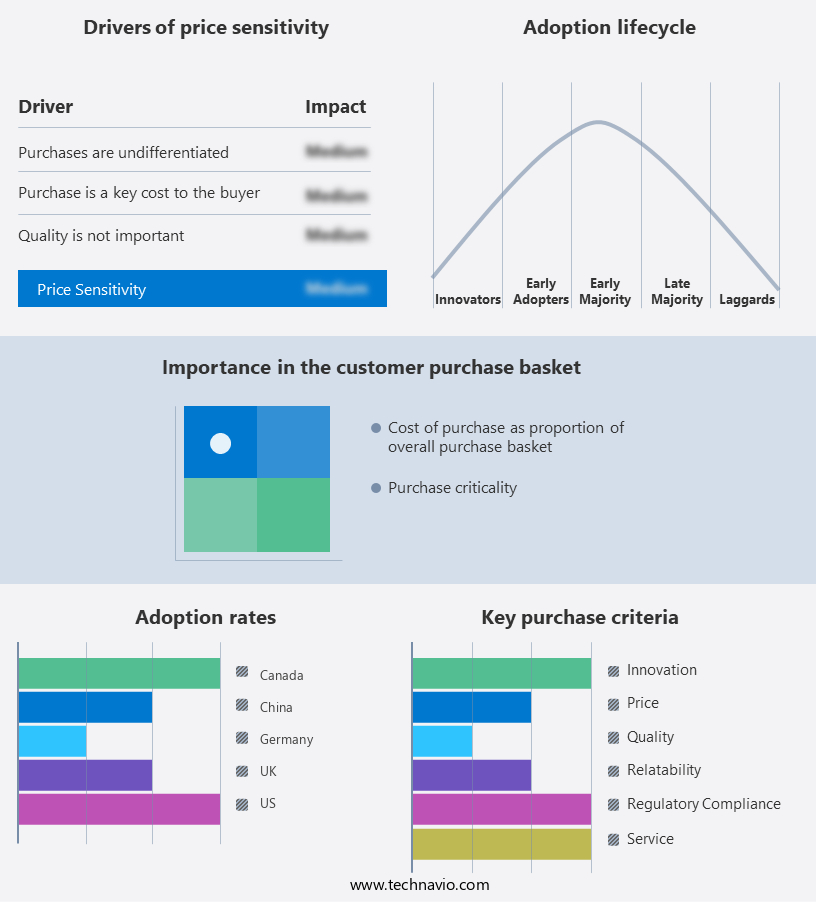
Exclusive Technavio Analysis on Customer Landscape
The project portfolio management (PPM) software market forecasting report includes the adoption lifecycle of the market, covering from the innovator's stage to the laggard's stage. It focuses on adoption rates in different regions based on penetration. Furthermore, the project portfolio management (PPM) software market report also includes key purchase criteria and drivers of price sensitivity to help companies evaluate and develop their market growth analysis strategies.
Customer Landscape of Project Portfolio Management (PPM) Software Industry
Competitive Landscape
Companies are implementing various strategies, such as strategic alliances, project portfolio management (ppm) software market forecast, partnerships, mergers and acquisitions, geographical expansion, and product/service launches, to enhance their presence in the industry.
Adobe Inc. - This company specializes in project portfolio management, enabling organizations to effectively prioritize and manage projects to attain strategic business objectives.
The industry research and growth report includes detailed analyses of the competitive landscape of the market and information about key companies, including:
- Adobe Inc.
- BestOutcome Ltd.
- Broadcom Inc.
- Cerri.com AG
- Hexagon AB
- Microsoft Corp.
- ONEPOINT Projects GmbH
- Open Text Corp.
- Oracle Corp.
- Planisware SAS
- Planview Inc.
- Project Objects
- SAP SE
- Sciforma Corp.
- ServiceNow Inc.
- Smartsheet Inc.
- Sopheon Corp.
- Upland Software Inc.
- WorkOtter Inc.
Qualitative and quantitative analysis of companies has been conducted to help clients understand the wider business environment as well as the strengths and weaknesses of key industry players. Data is qualitatively analyzed to categorize companies as pure play, category-focused, industry-focused, and diversified; it is quantitatively analyzed to categorize companies as dominant, leading, strong, tentative, and weak.
Recent Development and News in Project Portfolio Management (PPM) Software Market
- In January 2024, Microsoft announced the launch of Project Oakdale, an advanced Project Portfolio Management (PPM) solution integrated with Power BI and Microsoft Teams, aimed at enhancing collaboration and data visualization for businesses (Microsoft Press Release).
- In March 2024, CA Technologies and ServiceNow joined forces to offer a unified PPM solution, combining CA's project and portfolio management capabilities with ServiceNow's IT service management platform (ServiceNow Press Release).
- In April 2025, Planview, a leading PPM software provider, secured a USD 150 million investment from Blackstone Growth, further strengthening its position in the market and enabling continued innovation and expansion (Bloomberg).
- In May 2025, Salesforce acquired Elements.Cloud, a popular PPM tool, to bolster its Project Management and Construction Cloud offerings, marking a significant entry into the construction project management sector (Salesforce Press Release).
Dive into Technavio's robust research methodology, blending expert interviews, extensive data synthesis, and validated models for unparalleled Project Portfolio Management (PPM) Software Market insights. See full methodology.
|
Market Scope |
|
|
Report Coverage |
Details |
|
Page number |
225 |
|
Base year |
2024 |
|
Historic period |
2019-2023 |
|
Forecast period |
2025-2029 |
|
Growth momentum & CAGR |
Accelerate at a CAGR of 16% |
|
Market growth 2025-2029 |
USD 4785.5 million |
|
Market structure |
Fragmented |
|
YoY growth 2024-2025(%) |
14.4 |
|
Key countries |
US, Canada, UK, Germany, Brazil, China, Mexico, France, India, and Japan |
|
Competitive landscape |
Leading Companies, Market Positioning of Companies, Competitive Strategies, and Industry Risks |
Research Analyst Overview
- Project Portfolio Management (PPM) software plays a pivotal role in managing multiple projects within an organization, integrating elements such as project scheduling, budget tracking, and resource allocation. The market for PPM solutions continues to evolve, with key trends shaping its dynamics. Kanban project management and agile methodologies have gained significant traction, enabling teams to manage workflows more efficiently and adapt to changing priorities. Resource leveling and demand management help organizations balance resource utilization and project demands, ensuring optimal productivity. Strategic alignment and value delivery are essential components of PPM, enabling organizations to prioritize projects based on business value and align them with strategic objectives.
- Stakeholder management and collaboration platforms facilitate effective communication and collaboration among team members and stakeholders. Project governance and time management techniques ensure that projects adhere to established policies and deadlines. Scrum project management and critical chain methodology offer structured frameworks for managing complex projects. Change management processes and dependency management help organizations manage project risks and adapt to unforeseen circumstances. Project success metrics, work breakdown structures, and portfolio dashboards provide valuable insights into project performance and enable data-driven decision-making. Risk management tools and resource allocation optimization help organizations mitigate risks and allocate resources effectively.
- PPM software solutions continue to evolve, offering advanced features such as issue tracking systems, reporting dashboards, and portfolio prioritization methods. Gantt chart visualization and portfolio governance enable organizations to manage project portfolios more effectively, ensuring that resources are allocated to the most valuable projects. In summary, the PPM software market is characterized by continuous innovation and the integration of various project management methodologies, tools, and techniques to help organizations manage their project portfolios more effectively and efficiently.
What are the Key Data Covered in this Project Portfolio Management (PPM) Software Market Research and Growth Report?
-
What is the expected growth of the Project Portfolio Management (PPM) Software Market between 2025 and 2029?
-
USD 4.79 billion, at a CAGR of 16%
-
-
What segmentation does the market report cover?
-
The report is segmented by Deployment (On-premises and Cloud-based), End-user (BFSI, Information and technology, Healthcare, Construction and infrastructure, and Others), Platform (Software and Services), Sector (Large enterprise and SMEs), and Geography (North America, Europe, APAC, South America, and Middle East and Africa)
-
-
Which regions are analyzed in the report?
-
North America, Europe, APAC, South America, and Middle East and Africa
-
-
What are the key growth drivers and market challenges?
-
Increasing need for large-scale project management, Challenges from open-source platforms
-
-
Who are the major players in the Project Portfolio Management (PPM) Software Market?
-
Adobe Inc., BestOutcome Ltd., Broadcom Inc., Cerri.com AG, Hexagon AB, Microsoft Corp., ONEPOINT Projects GmbH, Open Text Corp., Oracle Corp., Planisware SAS, Planview Inc., Project Objects, SAP SE, Sciforma Corp., ServiceNow Inc., Smartsheet Inc., Sopheon Corp., Upland Software Inc., and WorkOtter Inc.
-
Market Research Insights
- The market encompasses a range of solutions designed to help organizations effectively manage multiple projects and prioritize resources. According to industry estimates, the global PPM market size is projected to reach USD 12.2 billion by 2025. This expansion is driven by the increasing adoption of strategic project management, program management, and enterprise project management. A key component of PPM software is project portfolio optimization, which enables organizations to allocate resources efficiently and balance projects based on business value. In contrast, the average organization manages over 1,000 active projects at any given time, making effective portfolio management essential.
- By implementing PPM solutions, organizations can streamline project selection criteria, improve project prioritization, and enhance project financial control. Additionally, these tools offer features such as performance reporting, risk assessment matrices, project scope management, project team collaboration, and project data analytics to ensure portfolio balance and stakeholder satisfaction.
We can help! Our analysts can customize this project portfolio management (PPM) software market research report to meet your requirements.
 RIA -
RIA - 
