Property And Casualty Insurance Market Analysis, Size, and Forecast 2026-2030: North America (US, Canada, and Mexico), Europe (Germany, UK, and France), APAC (China, Japan, and South Korea), South America (Brazil, Argentina, and Colombia), Middle East and Africa (South Africa, Saudi Arabia, and UAE), and Rest of World (ROW)

Property And Casualty Insurance Market Analysis, Size, and Forecast 2026-2030:
North America (US, Canada, and Mexico), Europe (Germany, UK, and France), APAC (China, Japan, and South Korea), South America (Brazil, Argentina, and Colombia), Middle East and Africa (South Africa, Saudi Arabia, and UAE), and Rest of World (ROW)

Published: Mar 2026 308 Pages SKU: IRTNTR75412

Market Overview at a Glance

$900.4 Mn
Market Opportunity
8.9%
CAGR 2025 - 2030
43.7%
North America Growth
$622.5 Mn
Direct business segment 2024

Property And Casualty Insurance Market Size 2026-2030

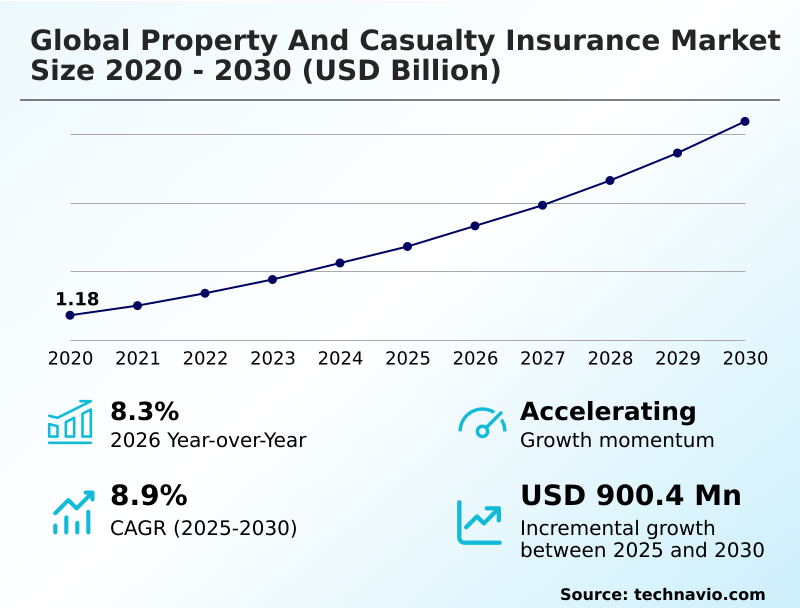
The property and casualty insurance market size is valued to increase by USD 900.4 million, at a CAGR of 8.9% from 2025 to 2030. Implementation of intelligent insurance and agentic artificial intelligence integration will drive the property and casualty insurance market.

Major Market Trends & Insights

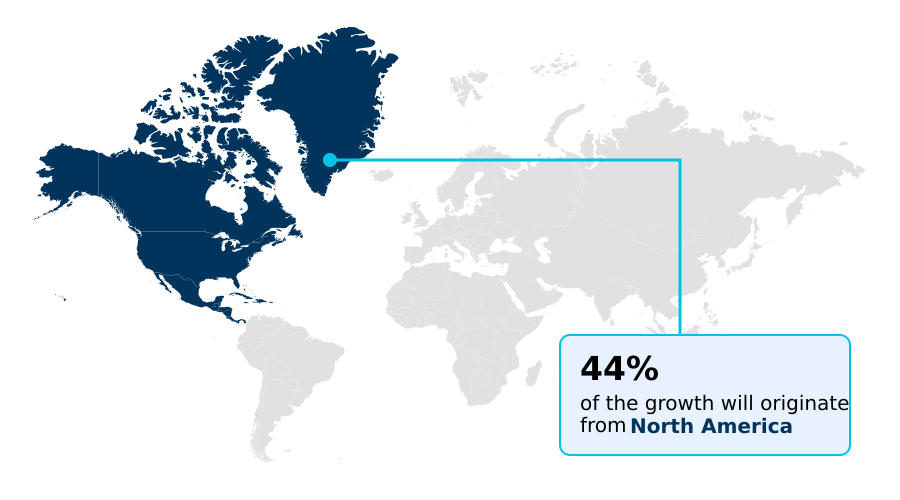
  • North America dominated the market and accounted for a 43.7% growth during the forecast period.
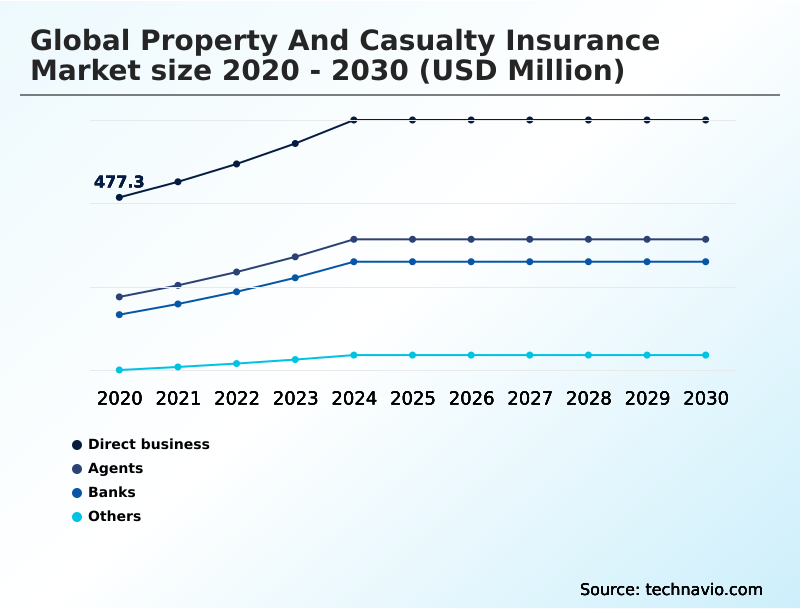
  • By Distribution Channel - Direct business segment was valued at USD 622.5 million in 2024
  • By Product Type - Fire insurance segment accounted for the largest market revenue share in 2024

Market Size & Forecast

  • Market Opportunities: USD 1.41 billion
  • Market Future Opportunities: USD 900.4 million
  • CAGR from 2025 to 2030 : 8.9%

Market Summary

  • The property and casualty insurance market is undergoing a significant transformation, driven by technological integration and shifting risk landscapes. Insurers are moving from traditional indemnity-based policies toward dynamic models incorporating real-time data for precision underwriting. A key trend is the growth of parametric insurance, where automated payouts are triggered by predefined environmental indices, bypassing lengthy claims processing.
  • For instance, an agricultural enterprise can secure coverage that pays out automatically when satellite data confirms a drought, ensuring immediate liquidity. This shift is enabled by agentic artificial intelligence and advanced catastrophe modeling, which allows for more accurate risk-pooling mechanism design.
  • However, the industry faces challenges from social inflation and the rise of deepfake-enabled fraud, which complicate actuarial modeling and increase loss-adjustment expenses. Simultaneously, embedded distribution models that integrate insurance into third-party platforms are creating frictionless customer journeys, expanding market reach and redefining policyholder engagement through seamless ecosystem integration.

What will be the Size of the Property And Casualty Insurance Market during the forecast period?

Get Key Insights on Market Forecast (PDF) Request Free Sample

How is the Property And Casualty Insurance Market Segmented?

The property and casualty insurance industry research report provides comprehensive data (region-wise segment analysis), with forecasts and estimates in "USD million" for the period 2026-2030, as well as historical data from 2020-2024 for the following segments.

  • Distribution channel
    • Direct business
    • Agents
    • Banks
    • Others
  • Product type
    • Fire insurance
    • Motor insurance
    • Marine insurance
    • Aviation insurance
    • Others
  • Type
    • Short-term policies
    • Long-term policies
  • Geography
    • North America
      • US
      • Canada
      • Mexico
    • Europe
      • Germany
      • UK
      • France
    • APAC
      • China
      • Japan
      • South Korea
    • South America
      • Brazil
      • Argentina
      • Colombia
    • Middle East and Africa
      • South Africa
      • Saudi Arabia
      • UAE
    • Rest of World (ROW)

By Distribution Channel Insights

The direct business segment is estimated to witness significant growth during the forecast period.

The direct business segment is evolving beyond simple direct-to-consumer (D2C) channels into a sophisticated intelligent insurance operating model. Carriers leverage API-first products and insurtech partnerships for seamless embedded distribution within non-insurance digital ecosystems, creating a frictionless customer journey.

This approach, supported by advanced actuarial modeling and customer relationship management (CRM) tools, enables a level of precision underwriting previously unattainable. Through API-driven distribution and open insurance initiatives, insurers are also enhancing bancassurance models to target high-net-worth individuals more effectively.

The focus is on automating workflows, with automated claims processing improving efficiency by over 25% for standard personal line claims, thereby strengthening the direct-to-policyholder relationship without intermediaries.

Request Free Sample

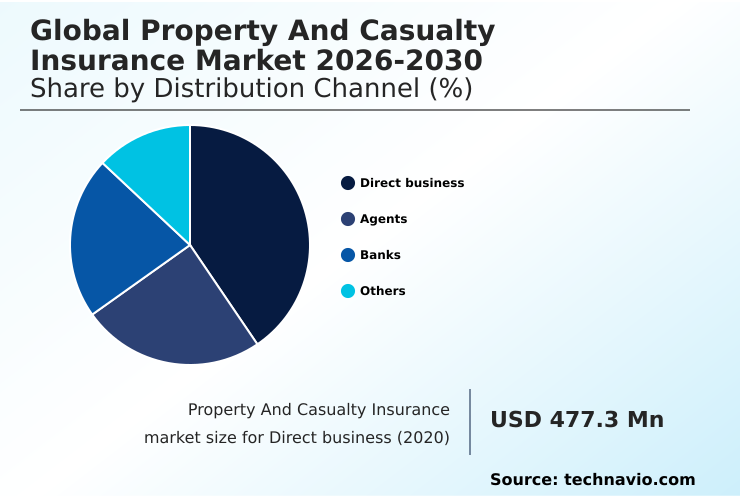
The Direct business segment was valued at USD 622.5 million in 2024 and showed a gradual increase during the forecast period.

Request Free Sample

Regional Analysis

North America is estimated to contribute 43.7% to the growth of the global market during the forecast period.Technavio’s analysts have elaborately explained the regional trends and drivers that shape the market during the forecast period.

See How Property And Casualty Insurance Market Demand is Rising in North America Request Free Sample

The geographic landscape is marked by distinct regional dynamics, with North America leading in the adoption of advanced litigation analytics to counter social inflation.

In APAC, rapid urbanization and regulatory support for open insurance initiatives are driving growth, with a focus on sharia-compliant insurance products in markets like Indonesia.

European insurers, guided by the Digital Operational Resilience Act (DORA), are focused on enhancing cyber-physical resilience and integrating ESG metrics. Bancassurance models remain a key distribution channel in Europe and Latin America.

Across regions, there's a rise in specialized commercial lines to cover risks like business interruption, with some carriers leveraging digital twin technology for complex asset underwriting.

This regional specialization, combined with global trends like unmanned aerial vehicles (UAVs) insurance, is creating diverse opportunities, with top-quartile firms in APAC achieving a net combined ratio that is 5% better than regional averages.

Market Dynamics

Our researchers analyzed the data with 2025 as the base year, along with the key drivers, trends, and challenges. A holistic analysis of drivers will help companies refine their marketing strategies to gain a competitive advantage.

  • Strategic decisions in the sector are increasingly shaped by the impact of social inflation on casualty insurance lines, forcing a re-evaluation of long-tail liability risks. To maintain profitability, carriers are focusing on how to optimize the P&C net combined ratio with AI, using machine learning for AI-driven precision underwriting in property insurance.
  • This involves sophisticated actuarial modeling for long-tail liability risks to price coverage for unpredictable litigation more accurately. The rise of usage-based motor insurance premium calculation models, powered by telematics, exemplifies the shift toward personalized pricing. In commercial fleet risk management, the role of telematics is crucial for monitoring driver behavior and reducing claims.
  • For catastrophic events, reinsurance strategies for managing secondary perils are being revamped, while parametric insurance solutions for natural catastrophes offer faster payouts. At the corporate level, alternative risk transfer structures for corporate self-insurance are gaining traction. Operationally, digital transformation of automated claims processing is a priority, alongside advanced methods for detecting fraud in claims using litigation analytics.
  • The market structure is also evolving, with managing general underwriter models for specialty lines and embedded insurance integration in automotive OEM sales becoming more common. These shifts occur within a framework of strict solvency mandates and capital adequacy requirements, ensuring stability.

What are the key market drivers leading to the rise in the adoption of Property And Casualty Insurance Industry?

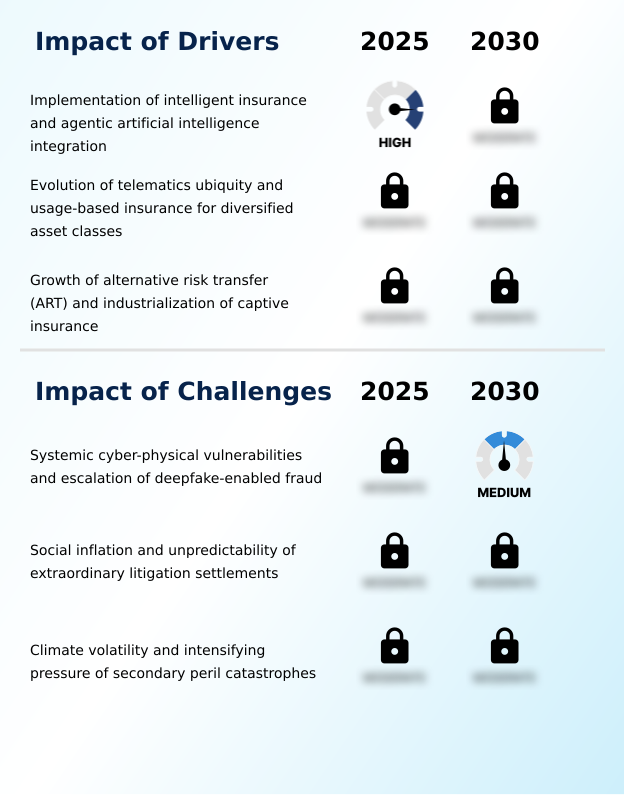
  • A key market driver is the implementation of intelligent insurance models, which integrate agentic artificial intelligence to automate complex decision-making processes.

  • Core market drivers are centered on the industrialization of data and intelligence. The implementation of agentic artificial intelligence within a cloud-native architecture is enabling a new intelligent insurance operating model, with some carriers reporting a 30% gain in operational efficiency.
  • This is complemented by the widespread adoption of telematics and usage-based insurance (UBI), which leverage real-time behavioral data from sources like advanced driver-assistance systems (ADAS) to personalize premiums, reducing claims frequency by up to 25%.
  • Furthermore, as market volatility persists, large enterprises are turning to alternative risk transfer (ART) structures, including captive insurance companies and multi-year casualty programs.
  • These loss-sensitive mechanisms, often managed by a managing general agent (MGA), provide greater control over long-tail liabilities and offer stability against unpredictable reinsurance pricing.

What are the market trends shaping the Property And Casualty Insurance Industry?

  • The market is shaped by the expansion of parametric insurance solutions, which are increasingly coupled with real-time climate data for proactive risk orchestration.

  • Market trends are coalescing around data-driven, automated risk management. The growth of parametric insurance, which abandons traditional indemnity-based policies for payouts based on predefined environmental indices, has reduced loss-adjustment expenses by up to 40% in certain catastrophe scenarios. This is enabled by real-time risk orchestration using satellite telemetry and climate data.
  • Concurrently, the industry is combatting the effects of social inflation with advanced litigation analytics. These tools analyze regional juror sentiment and historical court data, improving the accuracy of claims triage processes by 15%. This allows carriers to more effectively manage nuclear verdicts fueled by third-party litigation financing.
  • These trends, supported by sophisticated catastrophe modeling and the use of structured risk solutions, are reshaping how insurers price risk and interact with policyholders.

What challenges does the Property And Casualty Insurance Industry face during its growth?

  • A primary challenge for the industry is the rise of systemic cyber-physical vulnerabilities, compounded by the escalation of sophisticated, deepfake-enabled fraud.

  • The industry is confronting a triad of systemic challenges that test traditional risk-pooling mechanisms. The escalation of cyber-physical threats, particularly deepfake-enabled fraud targeting claims, has forced insurers to invest in advanced biometric and cryptographic tools, increasing compliance costs associated with principle-based regulations by an estimated 10-15%.
  • Concurrently, social inflation continues to pressure the net combined ratio on liability lines, with nuclear verdicts making actuarial modeling for long-tail risks exceedingly difficult. Climate volatility presents the third major hurdle, as the rising frequency of secondary perils strains reinsurance capacity and forces a reliance on state-backed insurers in high-risk zones.
  • This has led to a recalibration of property-catastrophe reinsurance strategies and a greater emphasis on catastrophe bonds to manage exposures within tightening solvency mandates.

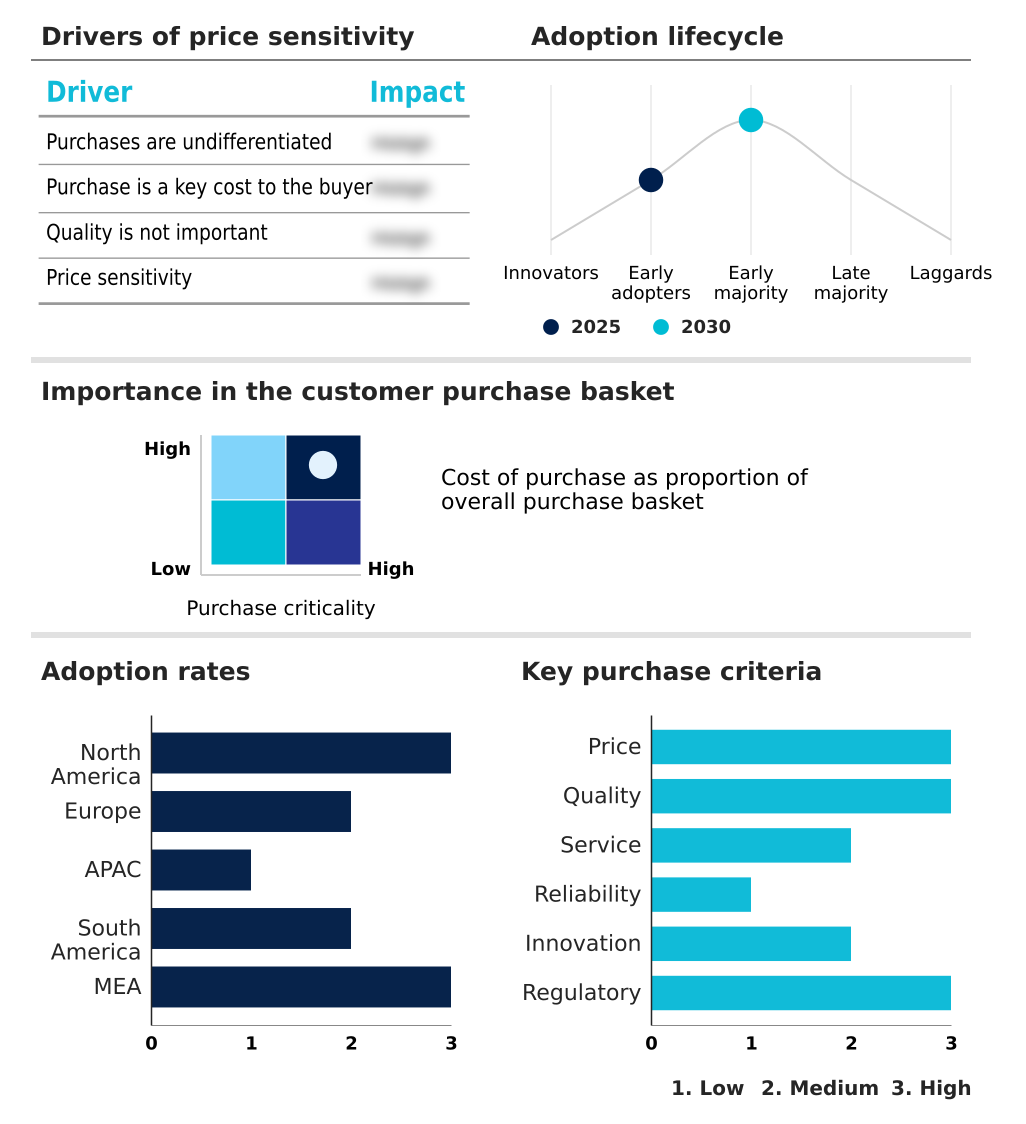
Exclusive Technavio Analysis on Customer Landscape

The property and casualty insurance market forecasting report includes the adoption lifecycle of the market, covering from the innovator’s stage to the laggard’s stage. It focuses on adoption rates in different regions based on penetration. Furthermore, the property and casualty insurance market report also includes key purchase criteria and drivers of price sensitivity to help companies evaluate and develop their market growth analysis strategies.

Customer Landscape of Property And Casualty Insurance Industry

Competitive Landscape

Companies are implementing various strategies, such as strategic alliances, property and casualty insurance market forecast, partnerships, mergers and acquisitions, geographical expansion, and product/service launches, to enhance their presence in the industry.

Allianz SE - Delivers property and casualty insurance, including commercial liability and motor coverage, backed by extensive global risk management and digital platform support.

The industry research and growth report includes detailed analyses of the competitive landscape of the market and information about key companies, including:

  • Allianz SE
  • American International Group
  • AXA Group
  • BHHC
  • Chubb Ltd.
  • CNA Financial Corp.
  • ICICI Lombard Insurance Co.
  • Liberty Mutual Holding Co. Inc.
  • Munich Reinsurance Co.
  • Nationwide Mutual Insurance Co.
  • Sompo Holdings Inc.
  • State Farm Insurance Co.
  • Swiss Re Ltd.
  • The Allstate Corp.
  • The Progressive Corp.
  • The Travelers Co. Inc.
  • Tokio Marine Holdings Inc.
  • Universal Insurance Holdings
  • USAA
  • Zurich Insurance Co. Ltd.

Qualitative and quantitative analysis of companies has been conducted to help clients understand the wider business environment as well as the strengths and weaknesses of key industry players. Data is qualitatively analyzed to categorize companies as pure play, category-focused, industry-focused, and diversified; it is quantitatively analyzed to categorize companies as dominant, leading, strong, tentative, and weak.

Recent Development and News in Property and casualty insurance market

  • In March 2025, digital financial services platform PhonePe launched a comprehensive suite of vehicle insurance products, enabling users to compare and purchase policies directly within its application environment.
  • In January 2025, Allianz SE announced a global partnership with Anthropic to accelerate the integration of responsible artificial intelligence into its insurance operations, automating complex claims processing and enhancing underwriting speed.
  • In November 2024, Chubb Limited reported record full-year net income, driven by a record-low property and casualty combined ratio, highlighting a trend where operational excellence is a primary driver of profitability.
  • In February 2025, the Indian Department for Promotion of Industry and Internal Trade formally liberalized the national insurance sector, permitting up to 100% foreign direct investment to attract global capital and technical expertise.

Dive into Technavio’s robust research methodology, blending expert interviews, extensive data synthesis, and validated models for unparalleled Property And Casualty Insurance Market insights. See full methodology.

Market Scope
Page number 308
Base year 2025
Historic period 2020-2024
Forecast period 2026-2030
Growth momentum & CAGR Accelerate at a CAGR of 8.9%
Market growth 2026-2030 USD 900.4 million
Market structure Fragmented
YoY growth 2025-2026(%) 8.3%
Key countries US, Canada, Mexico, Germany, UK, France, Italy, Spain, The Netherlands, China, Japan, South Korea, India, Australia, Indonesia, Brazil, Argentina, Colombia, South Africa, Saudi Arabia, UAE, Israel and Turkey
Competitive landscape Leading Companies, Market Positioning of Companies, Competitive Strategies, and Industry Risks

Request Free Sample

Research Analyst Overview

  • The market is rapidly transitioning toward a model where technological proficiency dictates leadership. The integration of agentic artificial intelligence and telematics is no longer optional, enabling advanced usage-based insurance (UBI) models and real-time risk orchestration. This shift is critical for managing emerging challenges like deepfake-enabled fraud and systemic cyber-physical threats.
  • Insurers are leveraging cloud-native architecture to deploy API-first products for embedded distribution, moving beyond traditional bancassurance models. In parallel, the industry is grappling with social inflation, using advanced litigation analytics to refine precision underwriting. The adoption of alternative risk transfer (ART) and captive insurance companies reflects a strategic move to manage volatility from secondary perils.
  • This tech-driven evolution is validated by performance metrics, as firms implementing automated claims processing have achieved a 30% reduction in processing time. This operational gain directly informs boardroom budgeting for digital transformation, as it proves the ROI on investments in platforms that support sophisticated catastrophe modeling, actuarial modeling, and reinsurance capacity management.

What are the Key Data Covered in this Property And Casualty Insurance Market Research and Growth Report?

  • What is the expected growth of the Property And Casualty Insurance Market between 2026 and 2030?

    • USD 900.4 million, at a CAGR of 8.9%

  • What segmentation does the market report cover?

    • The report is segmented by Distribution Channel (Direct business, Agents, Banks, and Others), Product Type (Fire insurance, Motor insurance, Marine insurance, Aviation insurance, and Others), Type (Short-term policies, and Long-term policies) and Geography (North America, Europe, APAC, South America, Middle East and Africa)

  • Which regions are analyzed in the report?

    • North America, Europe, APAC, South America and Middle East and Africa

  • What are the key growth drivers and market challenges?

    • Implementation of intelligent insurance and agentic artificial intelligence integration, Systemic cyber-physical vulnerabilities and escalation of deepfake-enabled fraud

  • Who are the major players in the Property And Casualty Insurance Market?

    • Allianz SE, American International Group, AXA Group, BHHC, Chubb Ltd., CNA Financial Corp., ICICI Lombard Insurance Co., Liberty Mutual Holding Co. Inc., Munich Reinsurance Co., Nationwide Mutual Insurance Co., Sompo Holdings Inc., State Farm Insurance Co., Swiss Re Ltd., The Allstate Corp., The Progressive Corp., The Travelers Co. Inc., Tokio Marine Holdings Inc., Universal Insurance Holdings, USAA and Zurich Insurance Co. Ltd.

Market Research Insights

  • The market is defined by a rapid pivot toward an intelligent insurance operating model, where technology drives competitive advantage. The integration of high-fidelity predictive analytics and generative AI in claims has enabled leading firms to reduce claims frequency by up to 25% through proactive risk mitigation.
  • This shift is supported by frictionless ecosystem integration and the growth of insurtech partnerships, creating direct-to-consumer (D2C) channels that offer a frictionless customer journey. As carriers adopt structured risk solutions and catastrophe bonds to manage volatility, they are also leveraging real-time climate data to refine underwriting.
  • The industrialization of telematics allows for hyper-personalized policies, contributing to operational efficiency gains of up to 30% in automated workflows, fundamentally reshaping the relationship between insurers and policyholders.

We can help! Our analysts can customize this property and casualty insurance market research report to meet your requirements.

Get in touch

1. Executive Summary

1.1 Market overview

Executive Summary - Chart on Market Overview
Executive Summary - Data Table on Market Overview
Executive Summary - Chart on Global Market Characteristics
Executive Summary - Chart on Market by Geography
Executive Summary - Chart on Market Segmentation by Distribution Channel
Executive Summary - Chart on Market Segmentation by Product Type
Executive Summary - Chart on Market Segmentation by Type
Executive Summary - Chart on Incremental Growth
Executive Summary - Data Table on Incremental Growth
Executive Summary - Chart on Company Market Positioning

2. Technavio Analysis

2.1 Analysis of price sensitivity, lifecycle, customer purchase basket, adoption rates, and purchase criteria

2.2 Criticality of inputs and Factors of differentiation

Chart on Overview on criticality of inputs and factors of differentiation

2.3 Factors of disruption

Chart on Overview on factors of disruption

2.4 Impact of drivers and challenges

Chart on Impact of drivers and challenges in 2025 and 2030

3. Market Landscape

3.1 Market ecosystem

Chart on Parent Market
Data Table on - Parent Market

3.2 Market characteristics

Chart on Market characteristics analysis

3.3 Value chain analysis

Chart on Value chain analysis

4. Market Sizing

4.1 Market definition

Data Table on Offerings of companies included in the market definition

4.2 Market segment analysis

Market segments

4.3 Market size 2025

4.4 Market outlook: Forecast for 2025-2030

Chart on Global - Market size and forecast 2025-2030 ($ million)
Data Table on Global - Market size and forecast 2025-2030 ($ million)
Chart on Global Market: Year-over-year growth 2025-2030 (%)
Data Table on Global Market: Year-over-year growth 2025-2030 (%)

5. Historic Market Size

5.1 Global Property And Casualty Insurance Market 2020 - 2024

Historic Market Size - Data Table on Global Property And Casualty Insurance Market 2020 - 2024 ($ million)

5.2 Distribution Channel segment analysis 2020 - 2024

Historic Market Size - Distribution Channel Segment 2020 - 2024 ($ million)

5.3 Product Type segment analysis 2020 - 2024

Historic Market Size - Product Type Segment 2020 - 2024 ($ million)

5.4 Type segment analysis 2020 - 2024

Historic Market Size - Type Segment 2020 - 2024 ($ million)

5.5 Geography segment analysis 2020 - 2024

Historic Market Size - Geography Segment 2020 - 2024 ($ million)

5.6 Country segment analysis 2020 - 2024

Historic Market Size - Country Segment 2020 - 2024 ($ million)

6. Qualitative Analysis

6.1 Impact of AI in global property and casualty insurance market

7. Five Forces Analysis

7.1 Five forces summary

Five forces analysis - Comparison between 2025 and 2030

7.2 Bargaining power of buyers

Bargaining power of buyers - Impact of key factors 2025 and 2030

7.3 Bargaining power of suppliers

Bargaining power of suppliers - Impact of key factors in 2025 and 2030

7.4 Threat of new entrants

Threat of new entrants - Impact of key factors in 2025 and 2030

7.5 Threat of substitutes

Threat of substitutes - Impact of key factors in 2025 and 2030

7.6 Threat of rivalry

Threat of rivalry - Impact of key factors in 2025 and 2030

7.7 Market condition

Chart on Market condition - Five forces 2025 and 2030

8. Market Segmentation by Distribution Channel

8.1 Market segments

Chart on Distribution Channel - Market share 2025-2030 (%)
Data Table on Distribution Channel - Market share 2025-2030 (%)

8.2 Comparison by Distribution Channel

Chart on Comparison by Distribution Channel
Data Table on Comparison by Distribution Channel

8.3 Direct business - Market size and forecast 2025-2030

Chart on Direct business - Market size and forecast 2025-2030 ($ million)
Data Table on Direct business - Market size and forecast 2025-2030 ($ million)
Chart on Direct business - Year-over-year growth 2025-2030 (%)
Data Table on Direct business - Year-over-year growth 2025-2030 (%)

8.4 Agents - Market size and forecast 2025-2030

Chart on Agents - Market size and forecast 2025-2030 ($ million)
Data Table on Agents - Market size and forecast 2025-2030 ($ million)
Chart on Agents - Year-over-year growth 2025-2030 (%)
Data Table on Agents - Year-over-year growth 2025-2030 (%)

8.5 Banks - Market size and forecast 2025-2030

Chart on Banks - Market size and forecast 2025-2030 ($ million)
Data Table on Banks - Market size and forecast 2025-2030 ($ million)
Chart on Banks - Year-over-year growth 2025-2030 (%)
Data Table on Banks - Year-over-year growth 2025-2030 (%)

8.6 Others - Market size and forecast 2025-2030

Chart on Others - Market size and forecast 2025-2030 ($ million)
Data Table on Others - Market size and forecast 2025-2030 ($ million)
Chart on Others - Year-over-year growth 2025-2030 (%)
Data Table on Others - Year-over-year growth 2025-2030 (%)

8.7 Market opportunity by Distribution Channel

Market opportunity by Distribution Channel ($ million)
Data Table on Market opportunity by Distribution Channel ($ million)

9. Market Segmentation by Product Type

9.1 Market segments

Chart on Product Type - Market share 2025-2030 (%)
Data Table on Product Type - Market share 2025-2030 (%)

9.2 Comparison by Product Type

Chart on Comparison by Product Type
Data Table on Comparison by Product Type

9.3 Fire insurance - Market size and forecast 2025-2030

Chart on Fire insurance - Market size and forecast 2025-2030 ($ million)
Data Table on Fire insurance - Market size and forecast 2025-2030 ($ million)
Chart on Fire insurance - Year-over-year growth 2025-2030 (%)
Data Table on Fire insurance - Year-over-year growth 2025-2030 (%)

9.4 Motor insurance - Market size and forecast 2025-2030

Chart on Motor insurance - Market size and forecast 2025-2030 ($ million)
Data Table on Motor insurance - Market size and forecast 2025-2030 ($ million)
Chart on Motor insurance - Year-over-year growth 2025-2030 (%)
Data Table on Motor insurance - Year-over-year growth 2025-2030 (%)

9.5 Marine insurance - Market size and forecast 2025-2030

Chart on Marine insurance - Market size and forecast 2025-2030 ($ million)
Data Table on Marine insurance - Market size and forecast 2025-2030 ($ million)
Chart on Marine insurance - Year-over-year growth 2025-2030 (%)
Data Table on Marine insurance - Year-over-year growth 2025-2030 (%)

9.6 Aviation insurance - Market size and forecast 2025-2030

Chart on Aviation insurance - Market size and forecast 2025-2030 ($ million)
Data Table on Aviation insurance - Market size and forecast 2025-2030 ($ million)
Chart on Aviation insurance - Year-over-year growth 2025-2030 (%)
Data Table on Aviation insurance - Year-over-year growth 2025-2030 (%)

9.7 Others - Market size and forecast 2025-2030

Chart on Others - Market size and forecast 2025-2030 ($ million)
Data Table on Others - Market size and forecast 2025-2030 ($ million)
Chart on Others - Year-over-year growth 2025-2030 (%)
Data Table on Others - Year-over-year growth 2025-2030 (%)

9.8 Market opportunity by Product Type

Market opportunity by Product Type ($ million)
Data Table on Market opportunity by Product Type ($ million)

10. Market Segmentation by Type

10.1 Market segments

Chart on Type - Market share 2025-2030 (%)
Data Table on Type - Market share 2025-2030 (%)

10.2 Comparison by Type

Chart on Comparison by Type
Data Table on Comparison by Type

10.3 Short-term policies - Market size and forecast 2025-2030

Chart on Short-term policies - Market size and forecast 2025-2030 ($ million)
Data Table on Short-term policies - Market size and forecast 2025-2030 ($ million)
Chart on Short-term policies - Year-over-year growth 2025-2030 (%)
Data Table on Short-term policies - Year-over-year growth 2025-2030 (%)

10.4 Long-term policies - Market size and forecast 2025-2030

Chart on Long-term policies - Market size and forecast 2025-2030 ($ million)
Data Table on Long-term policies - Market size and forecast 2025-2030 ($ million)
Chart on Long-term policies - Year-over-year growth 2025-2030 (%)
Data Table on Long-term policies - Year-over-year growth 2025-2030 (%)

10.5 Market opportunity by Type

Market opportunity by Type ($ million)
Data Table on Market opportunity by Type ($ million)

11. Customer Landscape

11.1 Customer landscape overview

Analysis of price sensitivity, lifecycle, customer purchase basket, adoption rates, and purchase criteria

12. Geographic Landscape

12.1 Geographic segmentation

Chart on Market share by geography 2025-2030 (%)
Data Table on Market share by geography 2025-2030 (%)

12.2 Geographic comparison

Chart on Geographic comparison
Data Table on Geographic comparison

12.3 North America - Market size and forecast 2025-2030

Chart on North America - Market size and forecast 2025-2030 ($ million)
Data Table on North America - Market size and forecast 2025-2030 ($ million)
Chart on North America - Year-over-year growth 2025-2030 (%)
Data Table on North America - Year-over-year growth 2025-2030 (%)
Chart on Regional Comparison - North America
Data Table on Regional Comparison - North America

12.3.1 US - Market size and forecast 2025-2030

Chart on US - Market size and forecast 2025-2030 ($ million)
Data Table on US - Market size and forecast 2025-2030 ($ million)
Chart on US - Year-over-year growth 2025-2030 (%)
Data Table on US - Year-over-year growth 2025-2030 (%)

12.3.2 Canada - Market size and forecast 2025-2030

Chart on Canada - Market size and forecast 2025-2030 ($ million)
Data Table on Canada - Market size and forecast 2025-2030 ($ million)
Chart on Canada - Year-over-year growth 2025-2030 (%)
Data Table on Canada - Year-over-year growth 2025-2030 (%)

12.3.3 Mexico - Market size and forecast 2025-2030

Chart on Mexico - Market size and forecast 2025-2030 ($ million)
Data Table on Mexico - Market size and forecast 2025-2030 ($ million)
Chart on Mexico - Year-over-year growth 2025-2030 (%)
Data Table on Mexico - Year-over-year growth 2025-2030 (%)

12.4 Europe - Market size and forecast 2025-2030

Chart on Europe - Market size and forecast 2025-2030 ($ million)
Data Table on Europe - Market size and forecast 2025-2030 ($ million)
Chart on Europe - Year-over-year growth 2025-2030 (%)
Data Table on Europe - Year-over-year growth 2025-2030 (%)
Chart on Regional Comparison - Europe
Data Table on Regional Comparison - Europe

12.4.1 Germany - Market size and forecast 2025-2030

Chart on Germany - Market size and forecast 2025-2030 ($ million)
Data Table on Germany - Market size and forecast 2025-2030 ($ million)
Chart on Germany - Year-over-year growth 2025-2030 (%)
Data Table on Germany - Year-over-year growth 2025-2030 (%)

12.4.2 UK - Market size and forecast 2025-2030

Chart on UK - Market size and forecast 2025-2030 ($ million)
Data Table on UK - Market size and forecast 2025-2030 ($ million)
Chart on UK - Year-over-year growth 2025-2030 (%)
Data Table on UK - Year-over-year growth 2025-2030 (%)

12.4.3 France - Market size and forecast 2025-2030

Chart on France - Market size and forecast 2025-2030 ($ million)
Data Table on France - Market size and forecast 2025-2030 ($ million)
Chart on France - Year-over-year growth 2025-2030 (%)
Data Table on France - Year-over-year growth 2025-2030 (%)

12.4.4 Italy - Market size and forecast 2025-2030

Chart on Italy - Market size and forecast 2025-2030 ($ million)
Data Table on Italy - Market size and forecast 2025-2030 ($ million)
Chart on Italy - Year-over-year growth 2025-2030 (%)
Data Table on Italy - Year-over-year growth 2025-2030 (%)

12.4.5 Spain - Market size and forecast 2025-2030

Chart on Spain - Market size and forecast 2025-2030 ($ million)
Data Table on Spain - Market size and forecast 2025-2030 ($ million)
Chart on Spain - Year-over-year growth 2025-2030 (%)
Data Table on Spain - Year-over-year growth 2025-2030 (%)

12.4.6 The Netherlands - Market size and forecast 2025-2030

Chart on The Netherlands - Market size and forecast 2025-2030 ($ million)
Data Table on The Netherlands - Market size and forecast 2025-2030 ($ million)
Chart on The Netherlands - Year-over-year growth 2025-2030 (%)
Data Table on The Netherlands - Year-over-year growth 2025-2030 (%)

12.5 APAC - Market size and forecast 2025-2030

Chart on APAC - Market size and forecast 2025-2030 ($ million)
Data Table on APAC - Market size and forecast 2025-2030 ($ million)
Chart on APAC - Year-over-year growth 2025-2030 (%)
Data Table on APAC - Year-over-year growth 2025-2030 (%)
Chart on Regional Comparison - APAC
Data Table on Regional Comparison - APAC

12.5.1 China - Market size and forecast 2025-2030

Chart on China - Market size and forecast 2025-2030 ($ million)
Data Table on China - Market size and forecast 2025-2030 ($ million)
Chart on China - Year-over-year growth 2025-2030 (%)
Data Table on China - Year-over-year growth 2025-2030 (%)

12.5.2 Japan - Market size and forecast 2025-2030

Chart on Japan - Market size and forecast 2025-2030 ($ million)
Data Table on Japan - Market size and forecast 2025-2030 ($ million)
Chart on Japan - Year-over-year growth 2025-2030 (%)
Data Table on Japan - Year-over-year growth 2025-2030 (%)

12.5.3 South Korea - Market size and forecast 2025-2030

Chart on South Korea - Market size and forecast 2025-2030 ($ million)
Data Table on South Korea - Market size and forecast 2025-2030 ($ million)
Chart on South Korea - Year-over-year growth 2025-2030 (%)
Data Table on South Korea - Year-over-year growth 2025-2030 (%)

12.5.4 India - Market size and forecast 2025-2030

Chart on India - Market size and forecast 2025-2030 ($ million)
Data Table on India - Market size and forecast 2025-2030 ($ million)
Chart on India - Year-over-year growth 2025-2030 (%)
Data Table on India - Year-over-year growth 2025-2030 (%)

12.5.5 Australia - Market size and forecast 2025-2030

Chart on Australia - Market size and forecast 2025-2030 ($ million)
Data Table on Australia - Market size and forecast 2025-2030 ($ million)
Chart on Australia - Year-over-year growth 2025-2030 (%)
Data Table on Australia - Year-over-year growth 2025-2030 (%)

12.5.6 Indonesia - Market size and forecast 2025-2030

Chart on Indonesia - Market size and forecast 2025-2030 ($ million)
Data Table on Indonesia - Market size and forecast 2025-2030 ($ million)
Chart on Indonesia - Year-over-year growth 2025-2030 (%)
Data Table on Indonesia - Year-over-year growth 2025-2030 (%)

12.6 South America - Market size and forecast 2025-2030

Chart on South America - Market size and forecast 2025-2030 ($ million)
Data Table on South America - Market size and forecast 2025-2030 ($ million)
Chart on South America - Year-over-year growth 2025-2030 (%)
Data Table on South America - Year-over-year growth 2025-2030 (%)
Chart on Regional Comparison - South America
Data Table on Regional Comparison - South America

12.6.1 Brazil - Market size and forecast 2025-2030

Chart on Brazil - Market size and forecast 2025-2030 ($ million)
Data Table on Brazil - Market size and forecast 2025-2030 ($ million)
Chart on Brazil - Year-over-year growth 2025-2030 (%)
Data Table on Brazil - Year-over-year growth 2025-2030 (%)

12.6.2 Argentina - Market size and forecast 2025-2030

Chart on Argentina - Market size and forecast 2025-2030 ($ million)
Data Table on Argentina - Market size and forecast 2025-2030 ($ million)
Chart on Argentina - Year-over-year growth 2025-2030 (%)
Data Table on Argentina - Year-over-year growth 2025-2030 (%)

12.6.3 Colombia - Market size and forecast 2025-2030

Chart on Colombia - Market size and forecast 2025-2030 ($ million)
Data Table on Colombia - Market size and forecast 2025-2030 ($ million)
Chart on Colombia - Year-over-year growth 2025-2030 (%)
Data Table on Colombia - Year-over-year growth 2025-2030 (%)

12.7 Middle East and Africa - Market size and forecast 2025-2030

Chart on Middle East and Africa - Market size and forecast 2025-2030 ($ million)
Data Table on Middle East and Africa - Market size and forecast 2025-2030 ($ million)
Chart on Middle East and Africa - Year-over-year growth 2025-2030 (%)
Data Table on Middle East and Africa - Year-over-year growth 2025-2030 (%)
Chart on Regional Comparison - Middle East and Africa
Data Table on Regional Comparison - Middle East and Africa

12.7.1 South Africa - Market size and forecast 2025-2030

Chart on South Africa - Market size and forecast 2025-2030 ($ million)
Data Table on South Africa - Market size and forecast 2025-2030 ($ million)
Chart on South Africa - Year-over-year growth 2025-2030 (%)
Data Table on South Africa - Year-over-year growth 2025-2030 (%)

12.7.2 Saudi Arabia - Market size and forecast 2025-2030

Chart on Saudi Arabia - Market size and forecast 2025-2030 ($ million)
Data Table on Saudi Arabia - Market size and forecast 2025-2030 ($ million)
Chart on Saudi Arabia - Year-over-year growth 2025-2030 (%)
Data Table on Saudi Arabia - Year-over-year growth 2025-2030 (%)

12.7.3 UAE - Market size and forecast 2025-2030

Chart on UAE - Market size and forecast 2025-2030 ($ million)
Data Table on UAE - Market size and forecast 2025-2030 ($ million)
Chart on UAE - Year-over-year growth 2025-2030 (%)
Data Table on UAE - Year-over-year growth 2025-2030 (%)

12.7.4 Israel - Market size and forecast 2025-2030

Chart on Israel - Market size and forecast 2025-2030 ($ million)
Data Table on Israel - Market size and forecast 2025-2030 ($ million)
Chart on Israel - Year-over-year growth 2025-2030 (%)
Data Table on Israel - Year-over-year growth 2025-2030 (%)

12.7.5 Turkey - Market size and forecast 2025-2030

Chart on Turkey - Market size and forecast 2025-2030 ($ million)
Data Table on Turkey - Market size and forecast 2025-2030 ($ million)
Chart on Turkey - Year-over-year growth 2025-2030 (%)
Data Table on Turkey - Year-over-year growth 2025-2030 (%)

12.8 Market opportunity by geography

Market opportunity by geography ($ million)
Data Tables on Market opportunity by geography ($ million)

13. Drivers, Challenges, and Opportunity

13.1 Market drivers

Implementation of intelligent insurance and agentic artificial intelligence integration
Evolution of telematics ubiquity and usage-based insurance for diversified asset classes
Growth of alternative risk transfer (ART) and industrialization of captive insurance

13.2 Market challenges

Systemic cyber-physical vulnerabilities and escalation of deepfake-enabled fraud
Social inflation and unpredictability of extraordinary litigation settlements
Climate volatility and intensifying pressure of secondary peril catastrophes

13.3 Impact of drivers and challenges

Impact of drivers and challenges in 2025 and 2030

13.4 Market opportunities

Growth of parametric solutions and real-time climate risk orchestration
Emergence of embedded distribution and frictionless ecosystem integration
Impact of social inflation and rise of advanced litigation analytics

14. Competitive Landscape

14.1 Overview

14.2

Overview on criticality of inputs and factors of differentiation

14.3 Landscape disruption

Overview on factors of disruption

14.4 Industry risks

Impact of key risks on business

15. Competitive Analysis

15.1 Companies profiled

Companies covered

15.2 Company ranking index

15.3 Market positioning of companies

Matrix on companies position and classification

15.4 Allianz SE

Allianz SE - Overview
Allianz SE - Business segments
Allianz SE - Key news
Allianz SE - Key offerings
Allianz SE - Segment focus
SWOT

15.5 American International Group

American International Group - Overview
American International Group - Business segments
American International Group - Key news
American International Group - Key offerings
American International Group - Segment focus
SWOT

15.6 AXA Group

AXA Group - Overview
AXA Group - Business segments
AXA Group - Key news
AXA Group - Key offerings
AXA Group - Segment focus
SWOT

15.7 Chubb Ltd.

Chubb Ltd. - Overview
Chubb Ltd. - Business segments
Chubb Ltd. - Key news
Chubb Ltd. - Key offerings
Chubb Ltd. - Segment focus
SWOT

15.8 CNA Financial Corp.

CNA Financial Corp. - Overview
CNA Financial Corp. - Business segments
CNA Financial Corp. - Key offerings
CNA Financial Corp. - Segment focus
SWOT

15.9 Munich Reinsurance Co.

Munich Reinsurance Co. - Overview
Munich Reinsurance Co. - Business segments
Munich Reinsurance Co. - Key news
Munich Reinsurance Co. - Key offerings
Munich Reinsurance Co. - Segment focus
SWOT

15.10 Nationwide Mutual Insurance Co.

Nationwide Mutual Insurance Co. - Overview
Nationwide Mutual Insurance Co. - Product / Service
Nationwide Mutual Insurance Co. - Key offerings
SWOT

15.11 Sompo Holdings Inc.

Sompo Holdings Inc. - Overview
Sompo Holdings Inc. - Business segments
Sompo Holdings Inc. - Key offerings
Sompo Holdings Inc. - Segment focus
SWOT

15.12 Swiss Re Ltd.

Swiss Re Ltd. - Overview
Swiss Re Ltd. - Business segments
Swiss Re Ltd. - Key offerings
Swiss Re Ltd. - Segment focus
SWOT

15.13 The Allstate Corp.

The Allstate Corp. - Overview
The Allstate Corp. - Business segments
The Allstate Corp. - Key offerings
The Allstate Corp. - Segment focus
SWOT

15.14 The Progressive Corp.

The Progressive Corp. - Overview
The Progressive Corp. - Business segments
The Progressive Corp. - Key offerings
The Progressive Corp. - Segment focus
SWOT

15.15 The Travelers Co. Inc.

The Travelers Co. Inc. - Overview
The Travelers Co. Inc. - Business segments
The Travelers Co. Inc. - Key offerings
The Travelers Co. Inc. - Segment focus
SWOT

15.16 Tokio Marine Holdings Inc.

Tokio Marine Holdings Inc. - Overview
Tokio Marine Holdings Inc. - Business segments
Tokio Marine Holdings Inc. - Key offerings
Tokio Marine Holdings Inc. - Segment focus
SWOT

15.17 Universal Insurance Holdings

Universal Insurance Holdings - Overview
Universal Insurance Holdings - Product / Service
Universal Insurance Holdings - Key offerings
SWOT

15.18 Zurich Insurance Co. Ltd.

Zurich Insurance Co. Ltd. - Overview
Zurich Insurance Co. Ltd. - Business segments
Zurich Insurance Co. Ltd. - Key news
Zurich Insurance Co. Ltd. - Key offerings
Zurich Insurance Co. Ltd. - Segment focus
SWOT

16. Appendix

16.1 Scope of the report

Market definition
Objectives
Notes and caveats

16.2 Inclusions and exclusions checklist

Inclusions checklist
Exclusions checklist

16.3 Currency conversion rates for US$

16.4 Research methodology

16.5 Data procurement

Information sources

16.6 Data validation

16.7 Validation techniques employed for market sizing

16.8 Data synthesis

16.9 360 degree market analysis

16.10 List of abbreviations

Research Methodology

Technavio presents a detailed picture of the market by way of study, synthesis, and summation of data from multiple sources. The analysts have presented the various facets of the market with a particular focus on identifying the key industry influencers. The data thus presented is comprehensive, reliable, and the result of extensive research, both primary and secondary.

INFORMATION SOURCES

Primary sources

  • Manufacturers and suppliers
  • Channel partners
  • Industry experts
  • Strategic decision makers

Secondary sources

  • Industry journals and periodicals
  • Government data
  • Financial reports of key industry players
  • Historical data
  • Press releases

DATA ANALYSIS

Data Synthesis

  • Collation of data
  • Estimation of key figures
  • Analysis of derived insights

Data Validation

  • Triangulation with data models
  • Reference against proprietary databases
  • Corroboration with industry experts

REPORT WRITING

Qualitative

  • Market drivers
  • Market challenges
  • Market trends
  • Five forces analysis

Quantitative

  • Market size and forecast
  • Market segmentation
  • Geographical insights
  • Competitive landscape

Interested in this report?

Get your sample now to see our research methodology and insights!

Download Now

Frequently Asked Questions

Property And Casualty Insurance market growth will increase by USD 900.4 million during 2026-2030.

The Property And Casualty Insurance market is expected to grow at a CAGR of 8.9% during 2026-2030.

Property And Casualty Insurance market is segmented by Distribution channel (Direct business, Agents, Banks, Others) Product type (Fire insurance, Motor insurance, Marine insurance, Aviation insurance, Others) Type (Short-term policies, Long-term policies)

Allianz SE, American International Group, AXA Group, BHHC, Chubb Ltd., CNA Financial Corp., ICICI Lombard Insurance Co., Liberty Mutual Holding Co. Inc., Munich Reinsurance Co., Nationwide Mutual Insurance Co., Sompo Holdings Inc., State Farm Insurance Co., Swiss Re Ltd., The Allstate Corp., The Progressive Corp., The Travelers Co. Inc., Tokio Marine Holdings Inc., Universal Insurance Holdings, USAA, Zurich Insurance Co. Ltd. are a few of the key vendors in the Property And Casualty Insurance market.

North America will register the highest growth rate of 43.7% among the other regions. Therefore, the Property And Casualty Insurance market in North America is expected to garner significant business opportunities for the vendors during the forecast period.

US, Canada, Mexico, Germany, UK, France, Italy, Spain, The Netherlands, China, Japan, South Korea, India, Australia, Indonesia, Brazil, Argentina, Colombia, South Africa, Saudi Arabia, UAE, Israel, Turkey

  • Implementation of intelligent insurance and agentic artificial intelligence integration is the driving factor this market.

The Property And Casualty Insurance market vendors should focus on grabbing business opportunities from the Distribution channel segment as it accounted for the largest market share in the base year.
RIA - Research AI Assistant
Ask RIA