Pruritus Drugs Market Analysis, Size, and Forecast 2026-2030: North America (US, Canada, and Mexico), Europe (Germany, UK, and France), APAC (China, Japan, and India), South America (Brazil, Argentina, and Colombia), Middle East and Africa (South Africa, UAE, and Saudi Arabia), Asia, Rest of World (ROW)

Pruritus Drugs Market Analysis, Size, and Forecast 2026-2030:
North America (US, Canada, and Mexico), Europe (Germany, UK, and France), APAC (China, Japan, and India), South America (Brazil, Argentina, and Colombia), Middle East and Africa (South Africa, UAE, and Saudi Arabia), Asia, Rest of World (ROW)

Published: Mar 2026 307 Pages SKU: IRTNTR72374

Market Overview at a Glance

$6.79 B
Market Opportunity
7.2%
CAGR 2025 - 2030
44.1%
North America Growth
$4.26 B
Hematologic pruritus segment 2024

Pruritus Drugs Market Size 2026-2030

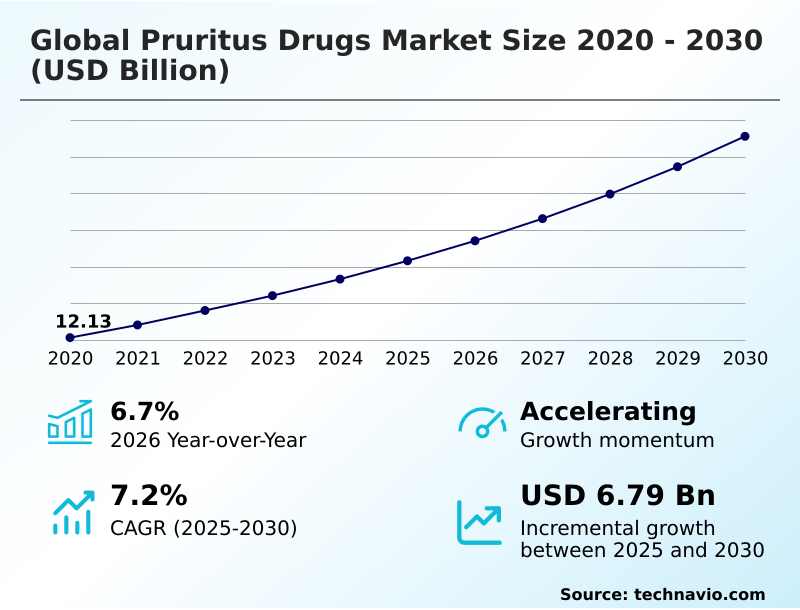
The pruritus drugs market size is valued to increase by USD 6.79 billion, at a CAGR of 7.2% from 2025 to 2030. Increasing prevalence of chronic systemic and dermatological diseases will drive the pruritus drugs market.

Major Market Trends & Insights

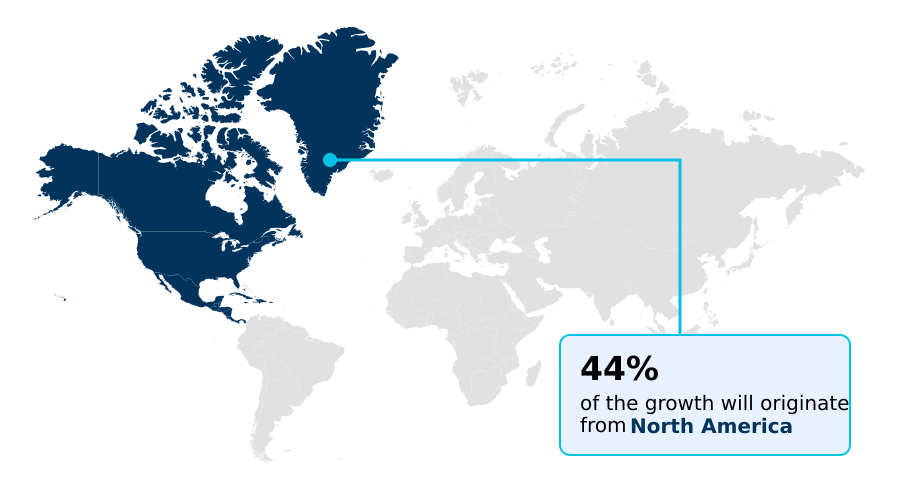
  • North America dominated the market and accounted for a 44.1% growth during the forecast period.
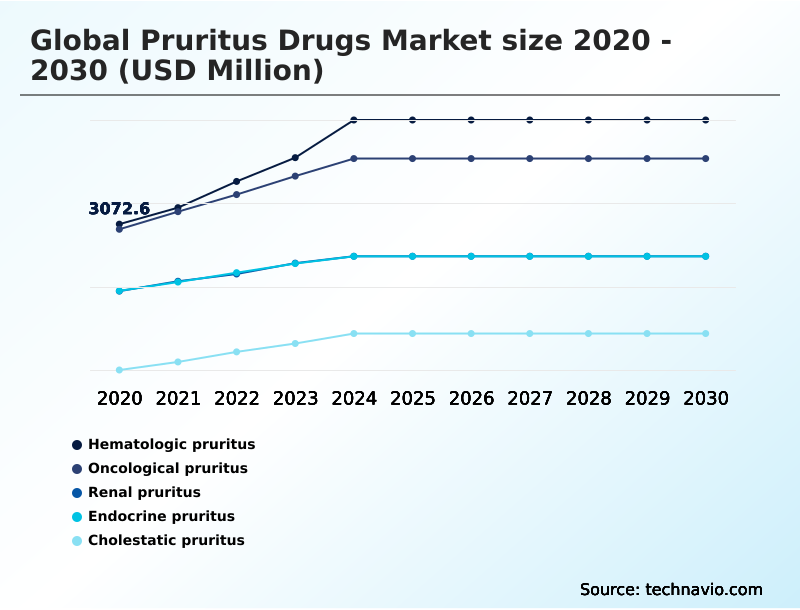
  • By Application - Hematologic pruritus segment was valued at USD 4.26 billion in 2024
  • By Route of Administration - Oral segment accounted for the largest market revenue share in 2024

Market Size & Forecast

  • Market Opportunities: USD 10.98 billion
  • Market Future Opportunities: USD 6.79 billion
  • CAGR from 2025 to 2030 : 7.2%

Market Summary

  • The pruritus drugs market is advancing beyond generalized symptom management toward precise, mechanism-based interventions. This evolution is driven by a deeper understanding of the neuroimmune pathways and cytokine cascades that mediate chronic itch in various dermatological and systemic diseases.
  • As a result, the therapeutic landscape is increasingly defined by targeted biologics and small-molecule inhibitors that offer superior efficacy compared to traditional antihistamines or corticosteroids. A significant business challenge involves navigating complex reimbursement landscapes; for instance, a company launching a novel monoclonal antibody for atopic dermatitis must overcome restrictive step-therapy protocols that mandate failure on multiple older, less effective treatments.
  • This requires generating robust pharmacoeconomic data to prove long-term value and justify premium pricing to payers. Strategic partnerships and innovative patient assistance programs are becoming critical for overcoming these access hurdles.
  • Concurrently, the market is influenced by the rising prevalence of conditions like chronic kidney disease-associated pruritus and cholestatic pruritus, creating demand for specialized treatments that address the unique pathophysiology of these systemic conditions. The development of therapies with improved safety profiles, such as nonsteroidal topical agents, addresses the long-term risks associated with corticosteroid use.

What will be the Size of the Pruritus Drugs Market during the forecast period?

Get Key Insights on Market Forecast (PDF) Request Free Sample

How is the Pruritus Drugs Market Segmented?

The pruritus drugs industry research report provides comprehensive data (region-wise segment analysis), with forecasts and estimates in "USD million" for the period 2026-2030, as well as historical data from 2020-2024 for the following segments.

  • Application
    • Hematologic pruritus
    • Oncological pruritus
    • Renal pruritus
    • Endocrine pruritus
    • Cholestatic pruritus
  • Route of administration
    • Oral
    • Topical
    • Injectable
    • Others
  • End-user
    • Hospitals
    • Homecare
    • Specialty Clinics
    • Others
  • Geography
    • North America
      • US
      • Canada
      • Mexico
    • Europe
      • Germany
      • UK
      • France
    • Asia
    • Rest of World (ROW)

By Application Insights

The hematologic pruritus segment is estimated to witness significant growth during the forecast period.

The hematologic pruritus segment of the pruritus drugs market addresses intense itching linked to blood disorders like polycythemia vera and Hodgkin's lymphoma.

The condition's complex pathogenesis, involving altered cytokine profiles and systemic histamine levels, makes it highly refractory to conventional antihistamines, creating a significant unmet clinical need.

This drives market demand for targeted therapeutic interventions, such as janus kinase inhibitors and other advanced immunomodulatory agents. The focus on personalized medicine, guided by molecular diagnostics, is transforming treatment paradigms.

Pharmaceutical development is increasingly centered on agents that address the underlying hematological drivers, with new therapies demonstrating over a 50% improvement in patient-reported itch severity, thereby improving quality of life and signaling a robust trajectory for therapeutic innovation.

Request Free Sample

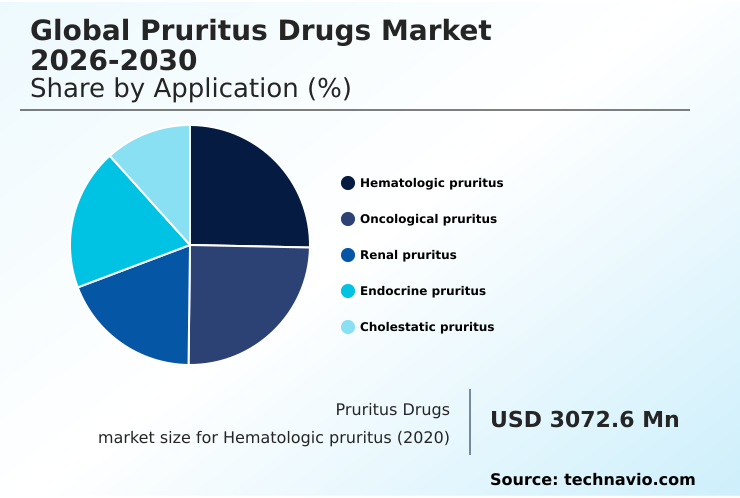
The Hematologic pruritus segment was valued at USD 4.26 billion in 2024 and showed a gradual increase during the forecast period.

Request Free Sample

Regional Analysis

North America is estimated to contribute 44.1% to the growth of the global market during the forecast period.Technavio’s analysts have elaborately explained the regional trends and drivers that shape the market during the forecast period.

See How Pruritus Drugs Market Demand is Rising in North America Request Free Sample

The geographic landscape of the pruritus drugs market is led by North America, which accounts for over 44% of the market, driven by high healthcare spending, favorable reimbursement for biologics, and a strong pipeline of janus kinase inhibitors.

Europe follows, with its market shaped by rigorous health technology assessments and centralized regulatory approvals. The Asia region is emerging as the fastest-growing market, with its expansion rate projected to be 15% higher than the global average.

This growth is fueled by rising disease prevalence, modernizing healthcare infrastructure in countries like China and India, and streamlined regulatory pathways for novel therapies.

The Rest of the World (ROW), encompassing South America, the Middle East, and Africa, presents opportunistic growth, driven by increasing awareness of conditions like atopic dermatitis and a gradual shift toward advanced therapeutics.

Market Dynamics

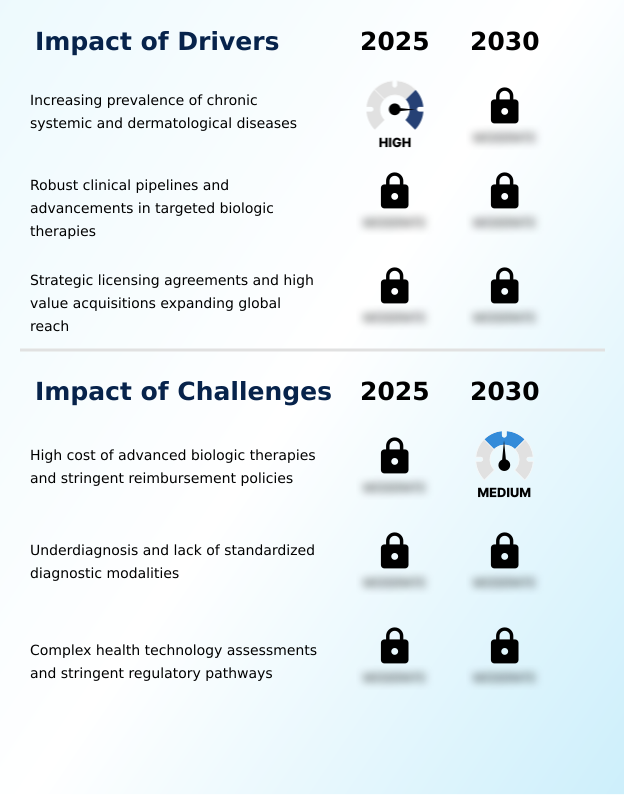
Our researchers analyzed the data with 2025 as the base year, along with the key drivers, trends, and challenges. A holistic analysis of drivers will help companies refine their marketing strategies to gain a competitive advantage.

  • Strategic development in the pruritus drugs market requires a nuanced approach to clinical trials and market access, particularly when considering the diverse etiologies of chronic itch. For companies developing targeted biologics for atopic dermatitis, demonstrating long-term safety and efficacy is paramount, especially when seeking approval for pediatric atopic dermatitis management.
  • The commercial success of emerging treatments for neuropathic itch and novel therapies for idiopathic pruritus hinges on robust patient-reported outcomes in pruritus trials that can effectively communicate value to payers. In parallel, the advancement of oral small molecules for systemic itch and kappa opioid agonists for renal pruritus requires navigating distinct regulatory and reimbursement challenges.
  • Firms specializing in therapies for cholestatic pruritus management, such as those with an ileal bile acid transporter inhibitors mechanism, must build strong relationships with hepatology specialists. An integrated strategy that addresses the pharmacology of neurokinin-1 receptor antagonists alongside the adverse effects of topical corticosteroids can yield a competitive advantage.
  • Furthermore, a focus on the cost-effectiveness of pruritus biologics is critical, as well-formulated pharmacoeconomic data can shorten the path to formulary inclusion by up to 12 months compared to approaches lacking such evidence, thereby accelerating revenue generation for advances in prurigo nodularis treatment and other high-need indications like chronic urticaria.

What are the key market drivers leading to the rise in the adoption of Pruritus Drugs Industry?

  • The increasing prevalence of chronic systemic and dermatological diseases that manifest with intense itch is a key driver fueling the expansion of the pruritus drugs market.

  • The pruritus drugs market is propelled by the rising global prevalence of chronic diseases and a robust clinical pipeline.
  • The increasing incidence of atopic dermatitis and other inflammatory skin disorders, coupled with an aging population susceptible to systemic conditions like cholestatic pruritus, creates a large, underserved patient base.
  • In response, pharmaceutical innovation is centered on targeted biologic therapies, including janus kinase inhibitors and monoclonal antibodies, which demonstrate up to a 70% improvement in itch scores for refractory patients.
  • These advancements are supported by strategic licensing agreements and acquisitions, which accelerate development timelines by an average of 18-24 months.
  • These partnerships synergize the agility of biotech firms with the global commercial reach of major pharmaceutical companies, ensuring that novel treatments like ileal bile acid transporter inhibitors rapidly reach patients in need.

What are the market trends shaping the Pruritus Drugs Industry?

  • A key market trend is the accelerated shift toward nonsteroidal topical innovations. This is driven by the need for safer, long-term alternatives to traditional corticosteroids for managing chronic itch.

  • Key trends shaping the pruritus drugs market include a significant move toward safer, more targeted therapies. There is an accelerated adoption of nonsteroidal topical innovations, with topical phosphodiesterase inhibitors showing a 30% reduction in local adverse events compared to long-term corticosteroid use. This addresses concerns about skin atrophy and systemic absorption.
  • Another major trend is the strategic expansion of existing biologics, such as interleukin-31 receptor antagonists, into idiopathic and unexplained itch syndromes, which could expand the addressable patient population by over 25%. Furthermore, the rising prominence of precision therapeutics for systemic conditions like uremic pruritus is evident.
  • The development of selective kappa opioid receptor agonists, which target the peripheral nervous system without central side effects, represents a significant advancement in managing itch for patients with end-stage renal disease.

What challenges does the Pruritus Drugs Industry face during its growth?

  • The high cost of advanced biologic therapies, compounded by stringent reimbursement policies and complex payer negotiations, presents a significant challenge to market growth and patient access.

  • Significant challenges constrain the pruritus drugs market, led by the high cost of advanced biologic therapies and stringent reimbursement policies. Payers often implement restrictive step-therapy protocols, delaying patient access to novel treatments like monoclonal antibodies by an average of six months. This creates a substantial barrier to care, particularly for those with severe prurigo nodularis.
  • Another critical issue is the widespread underdiagnosis of chronic itch, especially in developing regions, which leaves an estimated 30% of the potential market unaddressed due to a lack of standardized diagnostic tools and specialist access. Furthermore, complex health technology assessments and fragmented regulatory pathways, particularly in Europe, create significant hurdles.
  • Gaining market access for a new interleukin-31 receptor antagonist can require separate, lengthy negotiations in each country, dampening revenue potential.

Exclusive Technavio Analysis on Customer Landscape

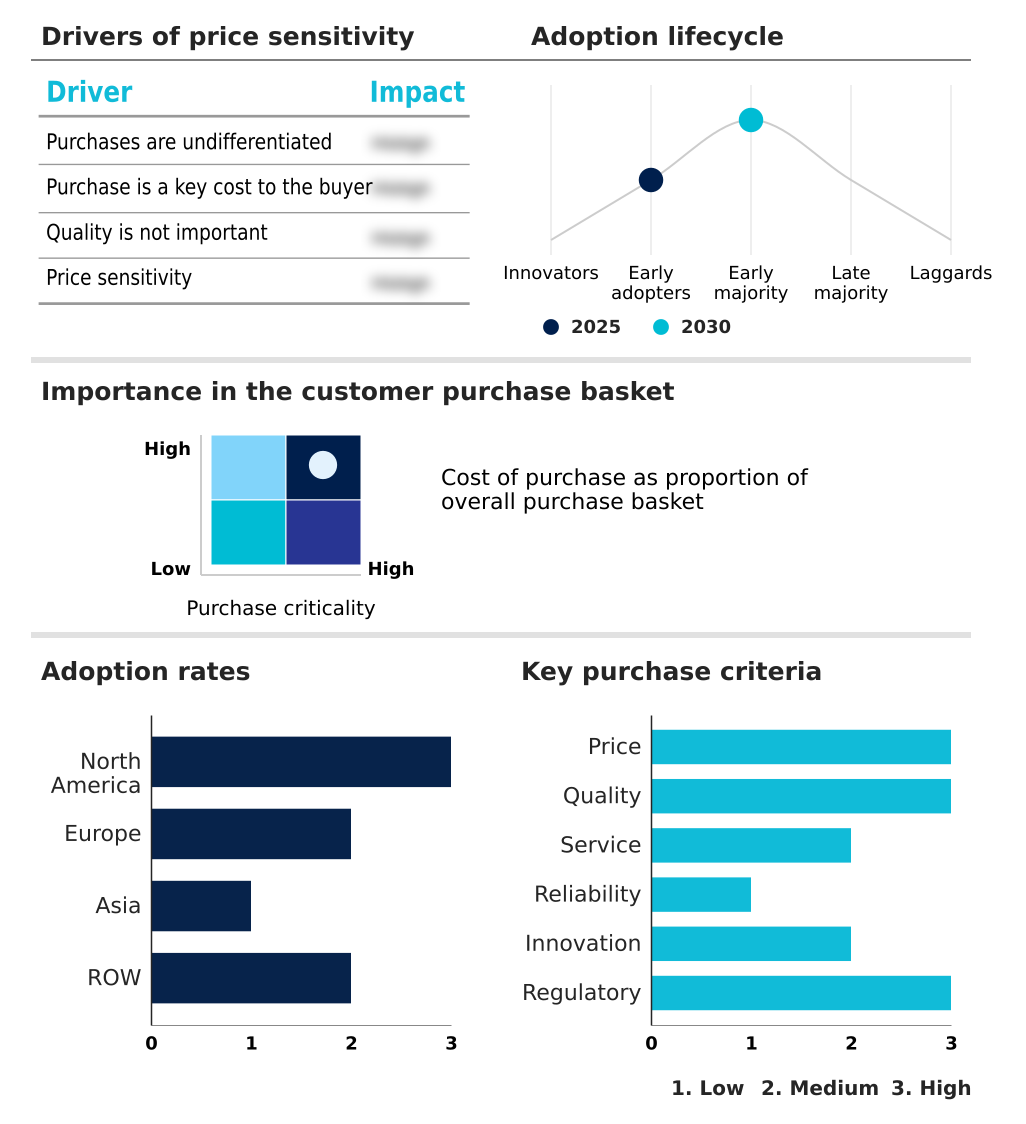
The pruritus drugs market forecasting report includes the adoption lifecycle of the market, covering from the innovator’s stage to the laggard’s stage. It focuses on adoption rates in different regions based on penetration. Furthermore, the pruritus drugs market report also includes key purchase criteria and drivers of price sensitivity to help companies evaluate and develop their market growth analysis strategies.

Customer Landscape of Pruritus Drugs Industry

Competitive Landscape

Companies are implementing various strategies, such as strategic alliances, pruritus drugs market forecast, partnerships, mergers and acquisitions, geographical expansion, and product/service launches, to enhance their presence in the industry.

AbbVie Inc. - Key offerings in the pruritus drugs market are shifting toward targeted biologic therapies and specialized small-molecule inhibitors designed to address complex neuroimmune and systemic itch pathways.

The industry research and growth report includes detailed analyses of the competitive landscape of the market and information about key companies, including:

  • AbbVie Inc.
  • Almirall SA
  • Bausch Health Companies Inc.
  • Bristol Myers Squibb Co.
  • CSL Ltd.
  • Escient Pharmaceuticals
  • Galderma Group AG
  • Incyte Corp.
  • Kiniksa Pharmaceuticals Ltd.
  • Kissei Pharmaceutical Co. Ltd.
  • LEO Pharma AS
  • Maruho Co. Ltd.
  • Pfizer Inc.
  • Regeneron Pharmaceuticals Inc.
  • Sanofi SA
  • Taiho Pharmaceutical Co. Ltd.
  • Toray Industries Inc.
  • Tvardi Therapeutics Inc.
  • Vanda Pharmaceuticals Inc.

Qualitative and quantitative analysis of companies has been conducted to help clients understand the wider business environment as well as the strengths and weaknesses of key industry players. Data is qualitatively analyzed to categorize companies as pure play, category-focused, industry-focused, and diversified; it is quantitatively analyzed to categorize companies as dominant, leading, strong, tentative, and weak.

Recent Development and News in Pruritus drugs market

  • In August 2025, a comprehensive multicenter, double-blind, randomized phase three clinical trial published in The British Medical Journal demonstrated that anrikefon, an investigational intravenous kappa opioid receptor agonist, was highly safe and resulted in a noticeable reduction in severe itch intensity for patients undergoing hemodialysis.
  • In October 2025, Arcutis Biotherapeutics presented compelling long-term clinical data demonstrating that Zoryve cream, a potent topical phosphodiesterase type four inhibitor, significantly reduced severe itch and sleep disturbances in patients with atopic dermatitis.
  • In December 2025, Galderma announced the first patient enrollment in a groundbreaking phase two clinical study to evaluate the safety and pharmacokinetic profile of nemolizumab for treating adult patients with chronic pruritus of unknown origin.
  • In February 2025, the European Commission granted widespread regulatory approval for Nemluvio, a targeted subcutaneous monoclonal antibody developed by Galderma, for the treatment of moderate-to-severe prurigo nodularis and atopic dermatitis.

Dive into Technavio’s robust research methodology, blending expert interviews, extensive data synthesis, and validated models for unparalleled Pruritus Drugs Market insights. See full methodology.

Market Scope
Page number 307
Base year 2025
Historic period 2020-2024
Forecast period 2026-2030
Growth momentum & CAGR Accelerate at a CAGR of 7.2%
Market growth 2026-2030 USD 6792.0 million
Market structure Fragmented
YoY growth 2025-2026(%) 6.7%
Key countries US, Canada, Mexico, Germany, UK, France, Italy, Spain, The Netherlands, China, Japan, India, South Korea, Indonesia, Thailand, Brazil, Argentina, South Africa, UAE, Saudi Arabia, Turkey, Colombia and Egypt
Competitive landscape Leading Companies, Market Positioning of Companies, Competitive Strategies, and Industry Risks

Request Free Sample

Research Analyst Overview

  • The pruritus drugs market is undergoing a fundamental transformation, driven by a deeper scientific understanding of the neuroimmune basis of chronic itch. This has catalyzed a shift from broad-spectrum corticosteroids and systemic immunosuppressants toward highly specific interventions. The current landscape is dominated by the development and commercialization of janus kinase inhibitors, monoclonal antibodies, and topical phosphodiesterase inhibitors.
  • These advanced therapeutics, including interleukin-31 receptor antagonists, target the precise cytokine pathways involved in conditions like atopic dermatitis, prurigo nodularis, and chronic spontaneous urticaria.
  • This focus on neuroimmune modulation and neuromodulators is also extending to systemic conditions such as cholestatic pruritus, uremic pruritus, and end-stage renal disease, where ileal bile acid transporter inhibitors and kappa opioid receptor agonists are setting new standards of care. Boardroom-level strategy is now centered on balancing the high costs of R&D with complex pharmacoeconomic evaluation and health technology assessments.
  • Novel therapies are demonstrating a 50% greater improvement in itch-free days compared to legacy treatments, justifying their value amidst stringent step-therapy protocols and a competitive environment pushing for nonsteroidal topical innovations.

What are the Key Data Covered in this Pruritus Drugs Market Research and Growth Report?

  • What is the expected growth of the Pruritus Drugs Market between 2026 and 2030?

    • USD 6.79 billion, at a CAGR of 7.2%

  • What segmentation does the market report cover?

    • The report is segmented by Application (Hematologic pruritus, Oncological pruritus, Renal pruritus, Endocrine pruritus, and Cholestatic pruritus), Route of Administration (Oral, Topical, Injectable, and Others), End-user (Hospitals, Homecare, Specialty Clinics, and Others) and Geography (North America, Europe, Asia, Rest of World (ROW))

  • Which regions are analyzed in the report?

    • North America, Europe, Asia and Rest of World (ROW)

  • What are the key growth drivers and market challenges?

    • Increasing prevalence of chronic systemic and dermatological diseases, High cost of advanced biologic therapies and stringent reimbursement policies

  • Who are the major players in the Pruritus Drugs Market?

    • AbbVie Inc., Almirall SA, Bausch Health Companies Inc., Bristol Myers Squibb Co., CSL Ltd., Escient Pharmaceuticals, Galderma Group AG, Incyte Corp., Kiniksa Pharmaceuticals Ltd., Kissei Pharmaceutical Co. Ltd., LEO Pharma AS, Maruho Co. Ltd., Pfizer Inc., Regeneron Pharmaceuticals Inc., Sanofi SA, Taiho Pharmaceutical Co. Ltd., Toray Industries Inc., Tvardi Therapeutics Inc. and Vanda Pharmaceuticals Inc.

Market Research Insights

  • The pruritus drugs market dynamics are shaped by a strategic pivot toward innovative delivery systems and specialized treatments that improve patient outcomes. The adoption of transdermal drug delivery and other novel administration routes improves bioavailability, with some formulations achieving a 20% faster onset of symptomatic relief compared to conventional methods.
  • Development of disease-modifying therapies is critical, as they target the underlying neuroimmune pathways of the itch-scratch cycle, demonstrating a 40% greater reduction in flare-ups over a six-month period. Firms are increasingly focused on creating robust real-world evidence to support clinical practice guidelines and secure favorable positioning in specialty pharmacy tiers.
  • This evidence-based approach helps navigate complex managed care strategies and prior authorization requirements, ultimately accelerating patient access to breakthrough treatments.

We can help! Our analysts can customize this pruritus drugs market research report to meet your requirements.

Get in touch

1. Executive Summary

1.1 Market overview

Executive Summary - Chart on Market Overview
Executive Summary - Data Table on Market Overview
Executive Summary - Chart on Global Market Characteristics
Executive Summary - Chart on Market by Geography
Executive Summary - Chart on Market Segmentation by Application
Executive Summary - Chart on Market Segmentation by Route of Administration
Executive Summary - Chart on Market Segmentation by End-user
Executive Summary - Chart on Incremental Growth
Executive Summary - Data Table on Incremental Growth
Executive Summary - Chart on Company Market Positioning

2. Technavio Analysis

2.1 Analysis of price sensitivity, lifecycle, customer purchase basket, adoption rates, and purchase criteria

2.2 Criticality of inputs and Factors of differentiation

Chart on Overview on criticality of inputs and factors of differentiation

2.3 Factors of disruption

Chart on Overview on factors of disruption

2.4 Impact of drivers and challenges

Chart on Impact of drivers and challenges in 2025 and 2030

3. Market Landscape

3.1 Market ecosystem

Chart on Parent Market
Data Table on - Parent Market

3.2 Market characteristics

Chart on Market characteristics analysis

3.3 Value chain analysis

Chart on Value chain analysis

4. Market Sizing

4.1 Market definition

Data Table on Offerings of companies included in the market definition

4.2 Market segment analysis

Market segments

4.3 Market size 2025

4.4 Market outlook: Forecast for 2025-2030

Chart on Global - Market size and forecast 2025-2030 ($ million)
Data Table on Global - Market size and forecast 2025-2030 ($ million)
Chart on Global Market: Year-over-year growth 2025-2030 (%)
Data Table on Global Market: Year-over-year growth 2025-2030 (%)

5. Historic Market Size

5.1 Global Pruritus Drugs Market 2020 - 2024

Historic Market Size - Data Table on Global Pruritus Drugs Market 2020 - 2024 ($ million)

5.2 Application segment analysis 2020 - 2024

Historic Market Size - Application Segment 2020 - 2024 ($ million)

5.3 Route of Administration segment analysis 2020 - 2024

Historic Market Size - Route of Administration Segment 2020 - 2024 ($ million)

5.4 End-user segment analysis 2020 - 2024

Historic Market Size - End-user Segment 2020 - 2024 ($ million)

5.5 Geography segment analysis 2020 - 2024

Historic Market Size - Geography Segment 2020 - 2024 ($ million)

5.6 Country segment analysis 2020 - 2024

Historic Market Size - Country Segment 2020 - 2024 ($ million)

6. Qualitative Analysis

6.1 Impact of AI on Global Pruritus Drugs Market

6.2 Impact of geopolitical conflict on Global Pruritus Drugs Market

7. Five Forces Analysis

7.1 Five forces summary

Five forces analysis - Comparison between 2025 and 2030

7.2 Bargaining power of buyers

Bargaining power of buyers - Impact of key factors 2025 and 2030

7.3 Bargaining power of suppliers

Bargaining power of suppliers - Impact of key factors in 2025 and 2030

7.4 Threat of new entrants

Threat of new entrants - Impact of key factors in 2025 and 2030

7.5 Threat of substitutes

Threat of substitutes - Impact of key factors in 2025 and 2030

7.6 Threat of rivalry

Threat of rivalry - Impact of key factors in 2025 and 2030

7.7 Market condition

Chart on Market condition - Five forces 2025 and 2030

8. Market Segmentation by Application

8.1 Market segments

Chart on Application - Market share 2025-2030 (%)
Data Table on Application - Market share 2025-2030 (%)

8.2 Comparison by Application

Chart on Comparison by Application
Data Table on Comparison by Application

8.3 Hematologic pruritus - Market size and forecast 2025-2030

Chart on Hematologic pruritus - Market size and forecast 2025-2030 ($ million)
Data Table on Hematologic pruritus - Market size and forecast 2025-2030 ($ million)
Chart on Hematologic pruritus - Year-over-year growth 2025-2030 (%)
Data Table on Hematologic pruritus - Year-over-year growth 2025-2030 (%)

8.4 Oncological pruritus - Market size and forecast 2025-2030

Chart on Oncological pruritus - Market size and forecast 2025-2030 ($ million)
Data Table on Oncological pruritus - Market size and forecast 2025-2030 ($ million)
Chart on Oncological pruritus - Year-over-year growth 2025-2030 (%)
Data Table on Oncological pruritus - Year-over-year growth 2025-2030 (%)

8.5 Renal pruritus - Market size and forecast 2025-2030

Chart on Renal pruritus - Market size and forecast 2025-2030 ($ million)
Data Table on Renal pruritus - Market size and forecast 2025-2030 ($ million)
Chart on Renal pruritus - Year-over-year growth 2025-2030 (%)
Data Table on Renal pruritus - Year-over-year growth 2025-2030 (%)

8.6 Endocrine pruritus - Market size and forecast 2025-2030

Chart on Endocrine pruritus - Market size and forecast 2025-2030 ($ million)
Data Table on Endocrine pruritus - Market size and forecast 2025-2030 ($ million)
Chart on Endocrine pruritus - Year-over-year growth 2025-2030 (%)
Data Table on Endocrine pruritus - Year-over-year growth 2025-2030 (%)

8.7 Cholestatic pruritus - Market size and forecast 2025-2030

Chart on Cholestatic pruritus - Market size and forecast 2025-2030 ($ million)
Data Table on Cholestatic pruritus - Market size and forecast 2025-2030 ($ million)
Chart on Cholestatic pruritus - Year-over-year growth 2025-2030 (%)
Data Table on Cholestatic pruritus - Year-over-year growth 2025-2030 (%)

8.8 Market opportunity by Application

Market opportunity by Application ($ million)
Data Table on Market opportunity by Application ($ million)

9. Market Segmentation by Route of Administration

9.1 Market segments

Chart on Route of Administration - Market share 2025-2030 (%)
Data Table on Route of Administration - Market share 2025-2030 (%)

9.2 Comparison by Route of Administration

Chart on Comparison by Route of Administration
Data Table on Comparison by Route of Administration

9.3 Oral - Market size and forecast 2025-2030

Chart on Oral - Market size and forecast 2025-2030 ($ million)
Data Table on Oral - Market size and forecast 2025-2030 ($ million)
Chart on Oral - Year-over-year growth 2025-2030 (%)
Data Table on Oral - Year-over-year growth 2025-2030 (%)

9.4 Topical - Market size and forecast 2025-2030

Chart on Topical - Market size and forecast 2025-2030 ($ million)
Data Table on Topical - Market size and forecast 2025-2030 ($ million)
Chart on Topical - Year-over-year growth 2025-2030 (%)
Data Table on Topical - Year-over-year growth 2025-2030 (%)

9.5 Injectable - Market size and forecast 2025-2030

Chart on Injectable - Market size and forecast 2025-2030 ($ million)
Data Table on Injectable - Market size and forecast 2025-2030 ($ million)
Chart on Injectable - Year-over-year growth 2025-2030 (%)
Data Table on Injectable - Year-over-year growth 2025-2030 (%)

9.6 Others - Market size and forecast 2025-2030

Chart on Others - Market size and forecast 2025-2030 ($ million)
Data Table on Others - Market size and forecast 2025-2030 ($ million)
Chart on Others - Year-over-year growth 2025-2030 (%)
Data Table on Others - Year-over-year growth 2025-2030 (%)

9.7 Market opportunity by Route of Administration

Market opportunity by Route of Administration ($ million)
Data Table on Market opportunity by Route of Administration ($ million)

10. Market Segmentation by End-user

10.1 Market segments

Chart on End-user - Market share 2025-2030 (%)
Data Table on End-user - Market share 2025-2030 (%)

10.2 Comparison by End-user

Chart on Comparison by End-user
Data Table on Comparison by End-user

10.3 Hospitals - Market size and forecast 2025-2030

Chart on Hospitals - Market size and forecast 2025-2030 ($ million)
Data Table on Hospitals - Market size and forecast 2025-2030 ($ million)
Chart on Hospitals - Year-over-year growth 2025-2030 (%)
Data Table on Hospitals - Year-over-year growth 2025-2030 (%)

10.4 Homecare - Market size and forecast 2025-2030

Chart on Homecare - Market size and forecast 2025-2030 ($ million)
Data Table on Homecare - Market size and forecast 2025-2030 ($ million)
Chart on Homecare - Year-over-year growth 2025-2030 (%)
Data Table on Homecare - Year-over-year growth 2025-2030 (%)

10.5 Specialty Clinics - Market size and forecast 2025-2030

Chart on Specialty Clinics - Market size and forecast 2025-2030 ($ million)
Data Table on Specialty Clinics - Market size and forecast 2025-2030 ($ million)
Chart on Specialty Clinics - Year-over-year growth 2025-2030 (%)
Data Table on Specialty Clinics - Year-over-year growth 2025-2030 (%)

10.6 Others - Market size and forecast 2025-2030

Chart on Others - Market size and forecast 2025-2030 ($ million)
Data Table on Others - Market size and forecast 2025-2030 ($ million)
Chart on Others - Year-over-year growth 2025-2030 (%)
Data Table on Others - Year-over-year growth 2025-2030 (%)

10.7 Market opportunity by End-user

Market opportunity by End-user ($ million)
Data Table on Market opportunity by End-user ($ million)

11. Customer Landscape

11.1 Customer landscape overview

Analysis of price sensitivity, lifecycle, customer purchase basket, adoption rates, and purchase criteria

12. Geographic Landscape

12.1 Geographic segmentation

Chart on Market share by geography 2025-2030 (%)
Data Table on Market share by geography 2025-2030 (%)

12.2 Geographic comparison

Chart on Geographic comparison
Data Table on Geographic comparison

12.3 North America - Market size and forecast 2025-2030

Chart on North America - Market size and forecast 2025-2030 ($ million)
Data Table on North America - Market size and forecast 2025-2030 ($ million)
Chart on North America - Year-over-year growth 2025-2030 (%)
Data Table on North America - Year-over-year growth 2025-2030 (%)
Chart on Regional Comparison - North America
Data Table on Regional Comparison - North America

12.3.1 US - Market size and forecast 2025-2030

Chart on US - Market size and forecast 2025-2030 ($ million)
Data Table on US - Market size and forecast 2025-2030 ($ million)
Chart on US - Year-over-year growth 2025-2030 (%)
Data Table on US - Year-over-year growth 2025-2030 (%)

12.3.2 Canada - Market size and forecast 2025-2030

Chart on Canada - Market size and forecast 2025-2030 ($ million)
Data Table on Canada - Market size and forecast 2025-2030 ($ million)
Chart on Canada - Year-over-year growth 2025-2030 (%)
Data Table on Canada - Year-over-year growth 2025-2030 (%)

12.3.3 Mexico - Market size and forecast 2025-2030

Chart on Mexico - Market size and forecast 2025-2030 ($ million)
Data Table on Mexico - Market size and forecast 2025-2030 ($ million)
Chart on Mexico - Year-over-year growth 2025-2030 (%)
Data Table on Mexico - Year-over-year growth 2025-2030 (%)

12.4 Europe - Market size and forecast 2025-2030

Chart on Europe - Market size and forecast 2025-2030 ($ million)
Data Table on Europe - Market size and forecast 2025-2030 ($ million)
Chart on Europe - Year-over-year growth 2025-2030 (%)
Data Table on Europe - Year-over-year growth 2025-2030 (%)
Chart on Regional Comparison - Europe
Data Table on Regional Comparison - Europe

12.4.1 Germany - Market size and forecast 2025-2030

Chart on Germany - Market size and forecast 2025-2030 ($ million)
Data Table on Germany - Market size and forecast 2025-2030 ($ million)
Chart on Germany - Year-over-year growth 2025-2030 (%)
Data Table on Germany - Year-over-year growth 2025-2030 (%)

12.4.2 UK - Market size and forecast 2025-2030

Chart on UK - Market size and forecast 2025-2030 ($ million)
Data Table on UK - Market size and forecast 2025-2030 ($ million)
Chart on UK - Year-over-year growth 2025-2030 (%)
Data Table on UK - Year-over-year growth 2025-2030 (%)

12.4.3 France - Market size and forecast 2025-2030

Chart on France - Market size and forecast 2025-2030 ($ million)
Data Table on France - Market size and forecast 2025-2030 ($ million)
Chart on France - Year-over-year growth 2025-2030 (%)
Data Table on France - Year-over-year growth 2025-2030 (%)

12.4.4 Italy - Market size and forecast 2025-2030

Chart on Italy - Market size and forecast 2025-2030 ($ million)
Data Table on Italy - Market size and forecast 2025-2030 ($ million)
Chart on Italy - Year-over-year growth 2025-2030 (%)
Data Table on Italy - Year-over-year growth 2025-2030 (%)

12.4.5 Spain - Market size and forecast 2025-2030

Chart on Spain - Market size and forecast 2025-2030 ($ million)
Data Table on Spain - Market size and forecast 2025-2030 ($ million)
Chart on Spain - Year-over-year growth 2025-2030 (%)
Data Table on Spain - Year-over-year growth 2025-2030 (%)

12.4.6 The Netherlands - Market size and forecast 2025-2030

Chart on The Netherlands - Market size and forecast 2025-2030 ($ million)
Data Table on The Netherlands - Market size and forecast 2025-2030 ($ million)
Chart on The Netherlands - Year-over-year growth 2025-2030 (%)
Data Table on The Netherlands - Year-over-year growth 2025-2030 (%)

12.5 Asia - Market size and forecast 2025-2030

Chart on Asia - Market size and forecast 2025-2030 ($ million)
Data Table on Asia - Market size and forecast 2025-2030 ($ million)
Chart on Asia - Year-over-year growth 2025-2030 (%)
Data Table on Asia - Year-over-year growth 2025-2030 (%)
Chart on Regional Comparison - Asia
Data Table on Regional Comparison - Asia

12.5.1 China - Market size and forecast 2025-2030

Chart on China - Market size and forecast 2025-2030 ($ million)
Data Table on China - Market size and forecast 2025-2030 ($ million)
Chart on China - Year-over-year growth 2025-2030 (%)
Data Table on China - Year-over-year growth 2025-2030 (%)

12.5.2 Japan - Market size and forecast 2025-2030

Chart on Japan - Market size and forecast 2025-2030 ($ million)
Data Table on Japan - Market size and forecast 2025-2030 ($ million)
Chart on Japan - Year-over-year growth 2025-2030 (%)
Data Table on Japan - Year-over-year growth 2025-2030 (%)

12.5.3 India - Market size and forecast 2025-2030

Chart on India - Market size and forecast 2025-2030 ($ million)
Data Table on India - Market size and forecast 2025-2030 ($ million)
Chart on India - Year-over-year growth 2025-2030 (%)
Data Table on India - Year-over-year growth 2025-2030 (%)

12.5.4 South Korea - Market size and forecast 2025-2030

Chart on South Korea - Market size and forecast 2025-2030 ($ million)
Data Table on South Korea - Market size and forecast 2025-2030 ($ million)
Chart on South Korea - Year-over-year growth 2025-2030 (%)
Data Table on South Korea - Year-over-year growth 2025-2030 (%)

12.5.5 Indonesia - Market size and forecast 2025-2030

Chart on Indonesia - Market size and forecast 2025-2030 ($ million)
Data Table on Indonesia - Market size and forecast 2025-2030 ($ million)
Chart on Indonesia - Year-over-year growth 2025-2030 (%)
Data Table on Indonesia - Year-over-year growth 2025-2030 (%)

12.5.6 Thailand - Market size and forecast 2025-2030

Chart on Thailand - Market size and forecast 2025-2030 ($ million)
Data Table on Thailand - Market size and forecast 2025-2030 ($ million)
Chart on Thailand - Year-over-year growth 2025-2030 (%)
Data Table on Thailand - Year-over-year growth 2025-2030 (%)

12.6 Rest of World (ROW) - Market size and forecast 2025-2030

Chart on Rest of World (ROW) - Market size and forecast 2025-2030 ($ million)
Data Table on Rest of World (ROW) - Market size and forecast 2025-2030 ($ million)
Chart on Rest of World (ROW) - Year-over-year growth 2025-2030 (%)
Data Table on Rest of World (ROW) - Year-over-year growth 2025-2030 (%)
Chart on Regional Comparison - Rest of World (ROW)
Data Table on Regional Comparison - Rest of World (ROW)

12.6.1 Brazil - Market size and forecast 2025-2030

Chart on Brazil - Market size and forecast 2025-2030 ($ million)
Data Table on Brazil - Market size and forecast 2025-2030 ($ million)
Chart on Brazil - Year-over-year growth 2025-2030 (%)
Data Table on Brazil - Year-over-year growth 2025-2030 (%)

12.6.2 Argentina - Market size and forecast 2025-2030

Chart on Argentina - Market size and forecast 2025-2030 ($ million)
Data Table on Argentina - Market size and forecast 2025-2030 ($ million)
Chart on Argentina - Year-over-year growth 2025-2030 (%)
Data Table on Argentina - Year-over-year growth 2025-2030 (%)

12.6.3 South Africa - Market size and forecast 2025-2030

Chart on South Africa - Market size and forecast 2025-2030 ($ million)
Data Table on South Africa - Market size and forecast 2025-2030 ($ million)
Chart on South Africa - Year-over-year growth 2025-2030 (%)
Data Table on South Africa - Year-over-year growth 2025-2030 (%)

12.6.4 UAE - Market size and forecast 2025-2030

Chart on UAE - Market size and forecast 2025-2030 ($ million)
Data Table on UAE - Market size and forecast 2025-2030 ($ million)
Chart on UAE - Year-over-year growth 2025-2030 (%)
Data Table on UAE - Year-over-year growth 2025-2030 (%)

12.6.5 Saudi Arabia - Market size and forecast 2025-2030

Chart on Saudi Arabia - Market size and forecast 2025-2030 ($ million)
Data Table on Saudi Arabia - Market size and forecast 2025-2030 ($ million)
Chart on Saudi Arabia - Year-over-year growth 2025-2030 (%)
Data Table on Saudi Arabia - Year-over-year growth 2025-2030 (%)

12.6.6 Turkey - Market size and forecast 2025-2030

Chart on Turkey - Market size and forecast 2025-2030 ($ million)
Data Table on Turkey - Market size and forecast 2025-2030 ($ million)
Chart on Turkey - Year-over-year growth 2025-2030 (%)
Data Table on Turkey - Year-over-year growth 2025-2030 (%)

12.6.7 Colombia - Market size and forecast 2025-2030

Chart on Colombia - Market size and forecast 2025-2030 ($ million)
Data Table on Colombia - Market size and forecast 2025-2030 ($ million)
Chart on Colombia - Year-over-year growth 2025-2030 (%)
Data Table on Colombia - Year-over-year growth 2025-2030 (%)

12.6.8 Egypt - Market size and forecast 2025-2030

Chart on Egypt - Market size and forecast 2025-2030 ($ million)
Data Table on Egypt - Market size and forecast 2025-2030 ($ million)
Chart on Egypt - Year-over-year growth 2025-2030 (%)
Data Table on Egypt - Year-over-year growth 2025-2030 (%)

12.7 Market opportunity by geography

Market opportunity by geography ($ million)
Data Tables on Market opportunity by geography ($ million)

13. Drivers, Challenges, and Opportunity

13.1 Market drivers

Increasing prevalence of chronic systemic and dermatological diseases
Robust clinical pipelines and advancements in targeted biologic therapies
Strategic licensing agreements and high value acquisitions expanding global reach

13.2 Market challenges

High cost of advanced biologic therapies and stringent reimbursement policies
Underdiagnosis and lack of standardized diagnostic modalities
Complex health technology assessments and stringent regulatory pathways

13.3 Impact of drivers and challenges

Impact of drivers and challenges in 2025 and 2030

13.4 Market opportunities

Accelerated shift toward nonsteroidal topical innovations
Strategic expansion of targeted biologics into idiopathic and unexplained itch syndromes
Rising prominence of precision therapeutics for systemic and renal pruritus management

14. Competitive Landscape

14.1 Overview

14.2

Overview on criticality of inputs and factors of differentiation

14.3 Landscape disruption

Overview on factors of disruption

14.4 Industry risks

Impact of key risks on business

15. Competitive Analysis

15.1 Companies profiled

Companies covered

15.2 Company ranking index

15.3 Market positioning of companies

Matrix on companies position and classification

15.4 AbbVie Inc.

AbbVie Inc. - Overview
AbbVie Inc. - Business segments
AbbVie Inc. - Key news
AbbVie Inc. - Key offerings
AbbVie Inc. - Segment focus
SWOT

15.5 Almirall SA

Almirall SA - Overview
Almirall SA - Business segments
Almirall SA - Key offerings
Almirall SA - Segment focus
SWOT

15.6 Bausch Health Companies Inc.

Bausch Health Companies Inc. - Overview
Bausch Health Companies Inc. - Business segments
Bausch Health Companies Inc. - Key offerings
Bausch Health Companies Inc. - Segment focus
SWOT

15.7 Bristol Myers Squibb Co.

Bristol Myers Squibb Co. - Overview
Bristol Myers Squibb Co. - Product / Service
Bristol Myers Squibb Co. - Key news
Bristol Myers Squibb Co. - Key offerings
SWOT

15.8 CSL Ltd.

CSL Ltd. - Overview
CSL Ltd. - Business segments
CSL Ltd. - Key news
CSL Ltd. - Key offerings
CSL Ltd. - Segment focus
SWOT

15.9 Galderma Group AG

Galderma Group AG - Overview
Galderma Group AG - Business segments
Galderma Group AG - Key offerings
Galderma Group AG - Segment focus
SWOT

15.10 Incyte Corp.

Incyte Corp. - Overview
Incyte Corp. - Product / Service
Incyte Corp. - Key news
Incyte Corp. - Key offerings
SWOT

15.11 Kiniksa Pharmaceuticals Ltd.

Kiniksa Pharmaceuticals Ltd. - Overview
Kiniksa Pharmaceuticals Ltd. - Product / Service
Kiniksa Pharmaceuticals Ltd. - Key offerings
SWOT

15.12 Kissei Pharmaceutical Co. Ltd.

Kissei Pharmaceutical Co. Ltd. - Overview
Kissei Pharmaceutical Co. Ltd. - Business segments
Kissei Pharmaceutical Co. Ltd. - Key offerings
Kissei Pharmaceutical Co. Ltd. - Segment focus
SWOT

15.13 Pfizer Inc.

Pfizer Inc. - Overview
Pfizer Inc. - Business segments
Pfizer Inc. - Key news
Pfizer Inc. - Key offerings
Pfizer Inc. - Segment focus
SWOT

15.14 Regeneron Pharmaceuticals Inc.

Regeneron Pharmaceuticals Inc. - Overview
Regeneron Pharmaceuticals Inc. - Product / Service
Regeneron Pharmaceuticals Inc. - Key news
Regeneron Pharmaceuticals Inc. - Key offerings
SWOT

15.15 Sanofi SA

Sanofi SA - Overview
Sanofi SA - Business segments
Sanofi SA - Key news
Sanofi SA - Key offerings
Sanofi SA - Segment focus
SWOT

15.16 Taiho Pharmaceutical Co. Ltd.

Taiho Pharmaceutical Co. Ltd. - Overview
Taiho Pharmaceutical Co. Ltd. - Product / Service
Taiho Pharmaceutical Co. Ltd. - Key offerings
SWOT

15.17 Toray Industries Inc.

Toray Industries Inc. - Overview
Toray Industries Inc. - Business segments
Toray Industries Inc. - Key news
Toray Industries Inc. - Key offerings
Toray Industries Inc. - Segment focus
SWOT

15.18 Vanda Pharmaceuticals Inc.

Vanda Pharmaceuticals Inc. - Overview
Vanda Pharmaceuticals Inc. - Product / Service
Vanda Pharmaceuticals Inc. - Key news
Vanda Pharmaceuticals Inc. - Key offerings
SWOT

16. Appendix

16.1 Scope of the report

Market definition
Objectives
Notes and caveats

16.2 Inclusions and exclusions checklist

Inclusions checklist
Exclusions checklist

16.3 Currency conversion rates for US$

16.4 Research methodology

16.5 Data procurement

Information sources

16.6 Data validation

16.7 Validation techniques employed for market sizing

16.8 Data synthesis

16.9 360 degree market analysis

16.10 List of abbreviations

Research Methodology

Technavio presents a detailed picture of the market by way of study, synthesis, and summation of data from multiple sources. The analysts have presented the various facets of the market with a particular focus on identifying the key industry influencers. The data thus presented is comprehensive, reliable, and the result of extensive research, both primary and secondary.

INFORMATION SOURCES

Primary sources

  • Manufacturers and suppliers
  • Channel partners
  • Industry experts
  • Strategic decision makers

Secondary sources

  • Industry journals and periodicals
  • Government data
  • Financial reports of key industry players
  • Historical data
  • Press releases

DATA ANALYSIS

Data Synthesis

  • Collation of data
  • Estimation of key figures
  • Analysis of derived insights

Data Validation

  • Triangulation with data models
  • Reference against proprietary databases
  • Corroboration with industry experts

REPORT WRITING

Qualitative

  • Market drivers
  • Market challenges
  • Market trends
  • Five forces analysis

Quantitative

  • Market size and forecast
  • Market segmentation
  • Geographical insights
  • Competitive landscape

Interested in this report?

Get your sample now to see our research methodology and insights!

Download Now

Frequently Asked Questions

Pruritus Drugs market growth will increase by USD 6792.0 million during 2026-2030.

The Pruritus Drugs market is expected to grow at a CAGR of 7.2% during 2026-2030.

Pruritus Drugs market is segmented by Application (Hematologic pruritus, Oncological pruritus, Renal pruritus, Endocrine pruritus, Cholestatic pruritus) Route of administration (Oral, Topical, Injectable, Others) End-user (Hospitals, Homecare, Specialty Clinics, Others)

AbbVie Inc., Almirall SA, Bausch Health Companies Inc., Bristol Myers Squibb Co., CSL Ltd., Escient Pharmaceuticals, Galderma Group AG, Incyte Corp., Kiniksa Pharmaceuticals Ltd., Kissei Pharmaceutical Co. Ltd., LEO Pharma AS, Maruho Co. Ltd., Pfizer Inc., Regeneron Pharmaceuticals Inc., Sanofi SA, Taiho Pharmaceutical Co. Ltd., Toray Industries Inc., Tvardi Therapeutics Inc., Vanda Pharmaceuticals Inc. are a few of the key vendors in the Pruritus Drugs market.

North America will register the highest growth rate of 44.1% among the other regions. Therefore, the Pruritus Drugs market in North America is expected to garner significant business opportunities for the vendors during the forecast period.

US, Canada, Mexico, Germany, UK, France, Italy, Spain, The Netherlands, China, Japan, India, South Korea, Indonesia, Thailand, Brazil, Argentina, South Africa, UAE, Saudi Arabia, Turkey, Colombia, Egypt

  • Increasing prevalence of chronic systemic and dermatological diseases is the driving factor this market.

The Pruritus Drugs market vendors should focus on grabbing business opportunities from the Application segment as it accounted for the largest market share in the base year.
RIA - Research AI Assistant
Ask RIA