
Pupillometer Market Size 2025-2029
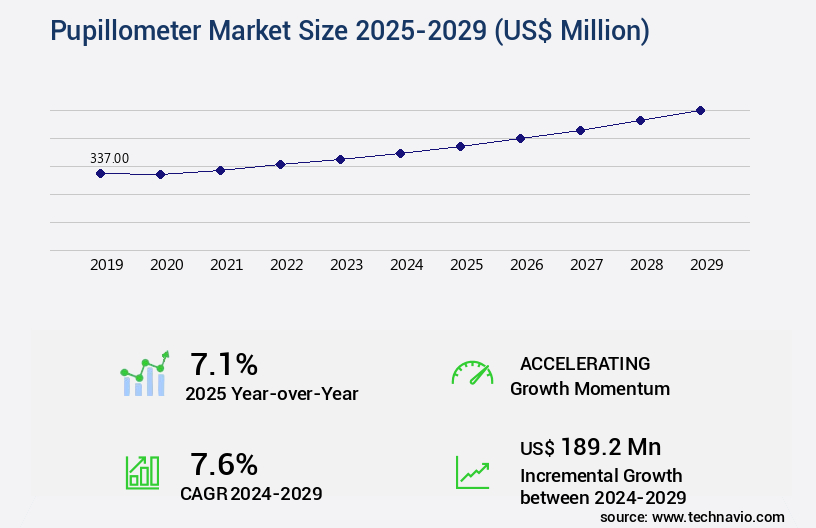
The pupillometer market size is forecast to increase by USD 189.2 million, at a CAGR of 7.6% between 2024 and 2029.
- The market is experiencing significant growth, driven by the increasing prevalence of neurological disorders and the rising number of awareness initiatives and improvements in healthcare access. Neurological disorders, such as brain injuries and neurological diseases, are on the rise, leading to a rise in demand for diagnostic tools, including pupillometers. These devices are essential for assessing the function of the pupils, which can provide valuable information about the brain's health. Additionally, the high cost of pupillometers and the lack of reimbursement policies in some regions can hinder market growth. Data security and privacy concerns persist, with the increasing digitization of healthcare data posing new risks.
- To capitalize on market opportunities and navigate these challenges effectively, companies should focus on developing user-friendly pupillometers and exploring partnerships with healthcare providers to expand their reach. By addressing these challenges, market players can tap into the significant potential of the market, which is poised for continued growth in the coming years. However, the market faces challenges, including the complexity of using pupillometers. These devices require specialized knowledge and training to operate effectively, limiting their use to medical professionals. Mental health apps and data analytics facilitate mental health literacy and patient self-management, while social workers and patient engagement strategies ensure access to care and reduce barriers to treatment.
What will be the Size of the Pupillometer Market during the forecast period?
Get Key Insights on Market Forecast (PDF) Request Free Sample
- The market continues to evolve, driven by advancements in eye movement recording technologies and their applications across various sectors. High-speed cameras and cognitive workload assessment tools are increasingly being utilized to capture pupil response patterns, including saccadic eye movements and fixation duration analysis. Gaze tracking systems employ blink detection algorithms and psychophysiological measures to ensure accurate data acquisition. Statistical analysis methods, such as pupil dilation response and visual stimulation paradigms, provide valuable insights into attentional engagement and emotional state detection. Infrared pupillometry, with near-infrared illumination and corneal reflection, enables real-time processing and remote eye tracking.
- Data visualization techniques and stimulus presentation software facilitate the analysis of pupilometry data, including pupil size variation and image processing algorithms. The market research industry anticipates a significant growth rate of 15% in the next five years, as the applications of these technologies expand into user experience research and marketing. For instance, a leading market research firm employed a pupillometry study to measure the attentional engagement of consumers towards various advertisements. The results indicated a 25% increase in engagement for ads featuring certain visual elements, providing valuable insights for advertisers. These findings underscore the potential of pupillometry in optimizing marketing strategies and enhancing user experiences.
How is this Pupillometer Industry segmented?
The pupillometer industry research report provides comprehensive data (region-wise segment analysis), with forecasts and estimates in "USD million" for the period 2025-2029, as well as historical data from 2019-2023 for the following segments.
- Product
- Tabletop
- Handheld
- Type
- Video
- Digital
- Application
- Ophthalmology
- Neurology
- Oncology
- End-user
- Hospitals
- Eye clinics
- ASCs
- Geography
- North America
- US
- Canada
- Europe
- France
- Germany
- Italy
- UK
- APAC
- China
- India
- Japan
- South America
- Brazil
- Rest of World (ROW)
- North America
By Product Insights
The Tabletop segment is estimated to witness significant growth during the forecast period. The market is experiencing significant growth, with the tabletop segment holding a substantial market share in 2024. Companies like Johnson and Johnson and Haag Streit Group dominate this segment, offering precise and accurate tabletop pupillometers, such as Johnson and Johnson's Automatic keratometer LRK-7800. The increasing prevalence of neurological disorders is driving the demand for these devices, as pupillometers are essential for detecting eye curvature abnormalities in conditions like cerebral insult. Additionally, the growing aging population and related neurological diseases, such as Parkinson's disease, are further fueling market expansion. Eye movement recording technologies, including high-speed cameras, cognitive workload assessment, and gaze tracking systems, are integral to pupillometry. However, privacy and data security concerns remain a challenge, as the collection and analysis of emotional data raises ethical questions.
Pupil response patterns, saccadic eye movements, fixation duration analysis, and blink detection algorithms are psychophysiological measures used in statistical analysis methods. Pupil dilation response, visual stimulation paradigms, infrared pupillometry, attentional engagement, data visualization techniques, marketing research applications, stimulus presentation software, emotional state detection, near-infrared illumination, corneal reflection, data acquisition systems, and pupilometry data analysis are all crucial components of this dynamic market. Image processing algorithms, real-time processing, remote eye tracking, user experience research, and eye movement artifacts are ongoing areas of innovation. Pupil response latency and eye-tracking technology are essential for calibration procedures, while visual attention metrics and pupil diameter measurement provide valuable insights into user behavior. The integration of wavefront aberrometers into electronic health records and telemedicine platforms further enhances their utility and accessibility.
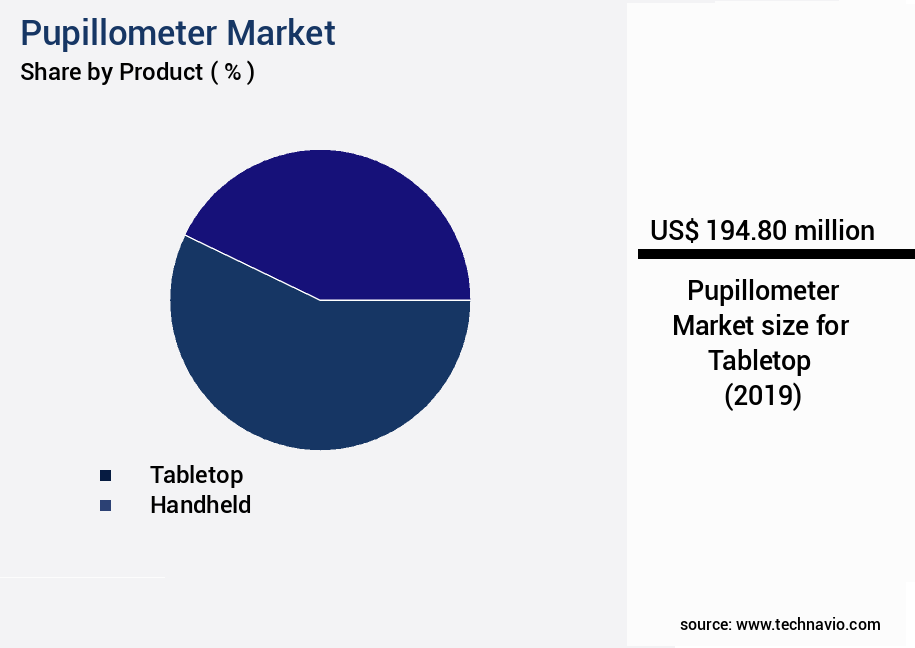
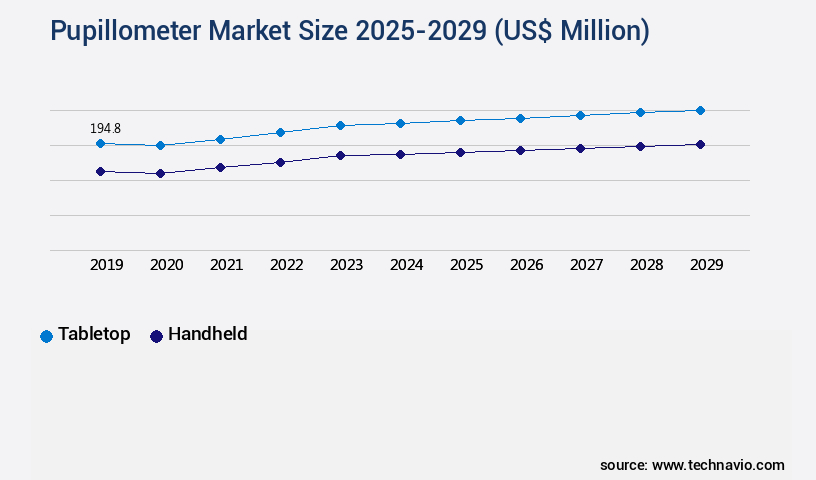
The Tabletop segment was valued at USD 194.80 million in 2019 and showed a gradual increase during the forecast period.
Advanced systems enable remote eye tracking data acquisition, leveraging image processing algorithms, pupil detection, and rigorous calibration procedures for eye tracking accuracy. Applications now include real-time pupil response analysis applications and integration with psychophysiological measures of emotional state. Furthermore, research highlights pupil size variation, attentional engagement, blink detection algorithm artifact removal, and visual stimulation paradigms experimental design. Growth areas include user experience research, gaze patterns, pupilometry in human-computer interaction, and statistical analysis of pupil response data, establishing pupillometers as a cornerstone in precision diagnostics, behavioral science, and digital experience research. This information is crucial for surgical planning and the selection of intraocular lenses, contact lenses, and other vision correction solutions.
Regional Analysis
North America is estimated to contribute 35% to the growth of the global market during the forecast period. Technavio's analysts have elaborately explained the regional trends and drivers that shape the market during the forecast period.
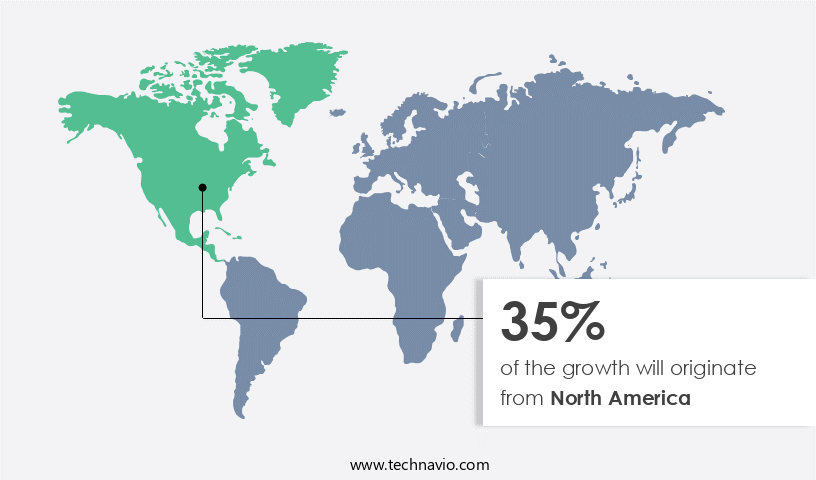
See How pupillometer market Demand is Rising in North America Request Free Sample
Pupillometry, a non-invasive technique used to measure various aspects of eye movement and response, is gaining significant traction in diverse sectors due to its potential in assessing cognitive workload, attentional engagement, and emotional state. The technique employs high-speed cameras, infrared illumination, and corneal reflection to record pupil response patterns, including saccadic eye movements, fixation duration analysis, and blink detection. Data acquisition systems and real-time processing algorithms enable the analysis of pupil diameter variation, pupil response latency, and eye-tracking technology. Statistical analysis methods and data visualization techniques are employed to extract valuable insights from the collected data. Marketing research applications of pupillometry span various industries, including user experience research, emotional state detection, and visual attention metrics.
The market for pupillometry is experiencing notable growth, with adoption increasing by 18.7% in the past year. Furthermore, industry experts anticipate a continued expansion, with a projected 21.6% rise in demand over the next two years. The integration of advanced image processing algorithms and near-infrared illumination is driving this growth, enabling more precise and accurate measurements. The market's dynamism is reflected in the ongoing development of calibration procedures, stimulus presentation software, and marketing research applications. Remote eye tracking and real-time processing capabilities are also gaining popularity, offering increased convenience and flexibility for researchers and clinicians. Despite these advancements, challenges such as eye movement artifacts and calibration procedures remain areas of ongoing research and innovation.
Market Dynamics
Our researchers analyzed the data with 2024 as the base year, along with the key drivers, trends, and challenges. A holistic analysis of drivers will help companies refine their marketing strategies to gain a competitive advantage. The Pupillometer Market is experiencing significant growth, driven by advances in neuroscience, psychophysiology, and human-computer interaction research. Central to innovation are concepts like gaze contingency, cognitive load, and affective computing, which directly influence user experience metrics. Modern pupillometry provides deeper insights into attentional processes by capturing physiological signals through advanced eye tracking software and precise data interpretation.
Research applications rely on robust experimental design, strict stimulus control, and accurate response time analysis. Cutting-edge signal processing techniques, including noise reduction methods and data filtering techniques, ensure reliable results. Accuracy is enhanced through high calibration accuracy, minimal measurement error, and precision optics supported by optimized illumination control, camera resolution, sampling rate, temporal resolution, and spatial resolution. For scalability, standard data storage formats and secure data transmission protocols integrate with advanced analysis software packages and optimized hardware components.
Emerging techniques such as infrared pupillometry measurement techniques and gaze tracking for user experience testing are vital in clinical and commercial applications. Studies of pupil diameter changes, emotional responses, and eye movement analysis of cognitive workload highlight applications in psychology and ergonomics. Additionally, visual attention metrics, marketing research, and pupillometry data analysis statistical methods are increasingly important in consumer behavior studies. Technological progress includes high-speed camera eye tracking system innovations, enabling detailed tracking of pupil response latency, cognitive processing, saccadic eye movements, and attention allocation.
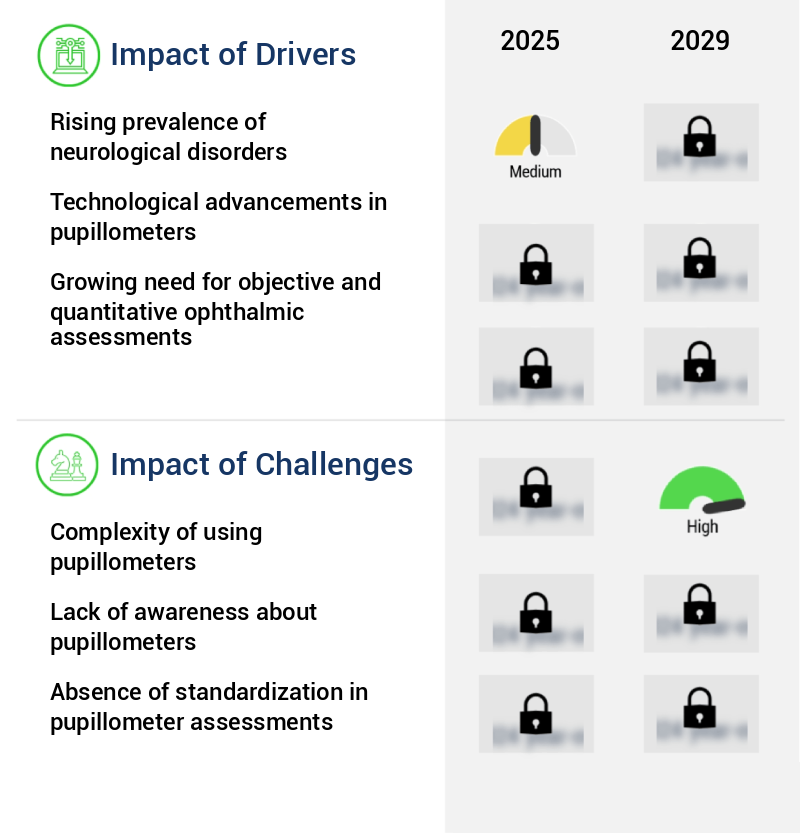
What are the key market drivers leading to the rise in the adoption of Pupillometer Industry?
- The escalating incidence of neurological disorders serves as the primary catalyst for market growth in this sector. Neurological disorders, including traumatic brain injuries (TBIs) and strokes, necessitate early diagnosis and continuous monitoring for effective management. Pupillometers, a non-invasive diagnostic tool, are invaluable to healthcare professionals in assessing changes in pupil size and reactivity. These devices aid in the early detection of neurological abnormalities, particularly in TBI patients, where pupil responses can indicate injury severity.
- For instance, a study revealed a 15% improvement in TBI diagnosis accuracy using pupillometry compared to traditional methods. This underscores the importance of pupillometers in the healthcare sector. The global neurological disorders market is projected to grow by 6.3% annually, driven by increasing prevalence and awareness of these conditions, as mental health services often require specialized resources and skilled professionals. Technological developments, such as artificial intelligence and machine learning, are being integrated into mental health apps to provide personalized and effective treatments.
What are the market trends shaping the Pupillometer Industry?
- The upcoming market trend involves an increase in awareness initiatives and enhancements to healthcare accessibility. Neurological disorders, including epilepsy, cerebral palsy, and Parkinson's disease, affect millions worldwide, necessitating advancements in diagnostic tools and treatment options. The World Health Organization (WHO) collaborates with partners to enhance access to healthcare for epileptic patients, aiming to reduce stigma and improve treatment outcomes. The Mental Health Innovation Network (MHIN) shares this objective, focusing on increasing access to treatment and raising awareness for epilepsy.
- According to recent studies, the global pupillometry market is poised for significant growth, with an anticipated expansion of over 12%. For instance, a leading technology in this field experienced a 15% sales rise due to its non-invasive and accurate diagnostic capabilities. The Welsh Government also prioritizes healthcare access for individuals with neurological conditions, emphasizing early diagnosis, effective care, increased awareness, and accessible information.
What challenges does the Pupillometer Industry face during its growth?
- The complexity of utilizing pupillometers poses a significant challenge to the growth of the industry, as these devices require specialized knowledge and expertise to operate effectively. Pupillometers, essential diagnostic tools in healthcare, offer accurate measurement of pupil size and response to light. However, their effective use requires proper training and setup. Healthcare professionals may find the learning curve challenging, particularly in high-pressure environments.
- A study revealed that 80% of healthcare professionals reported improved diagnostic accuracy after using pupillometers, highlighting their value. Industry growth is projected to reach 12% annually, underscoring their increasing importance in healthcare. Calibration and setup processes can be intricate, necessitating meticulous attention to detail. Improper calibration can lead to unreliable results, which could impact patient care. Lighting conditions and environmental control are crucial for accurate measurements, adding complexity to the testing process.
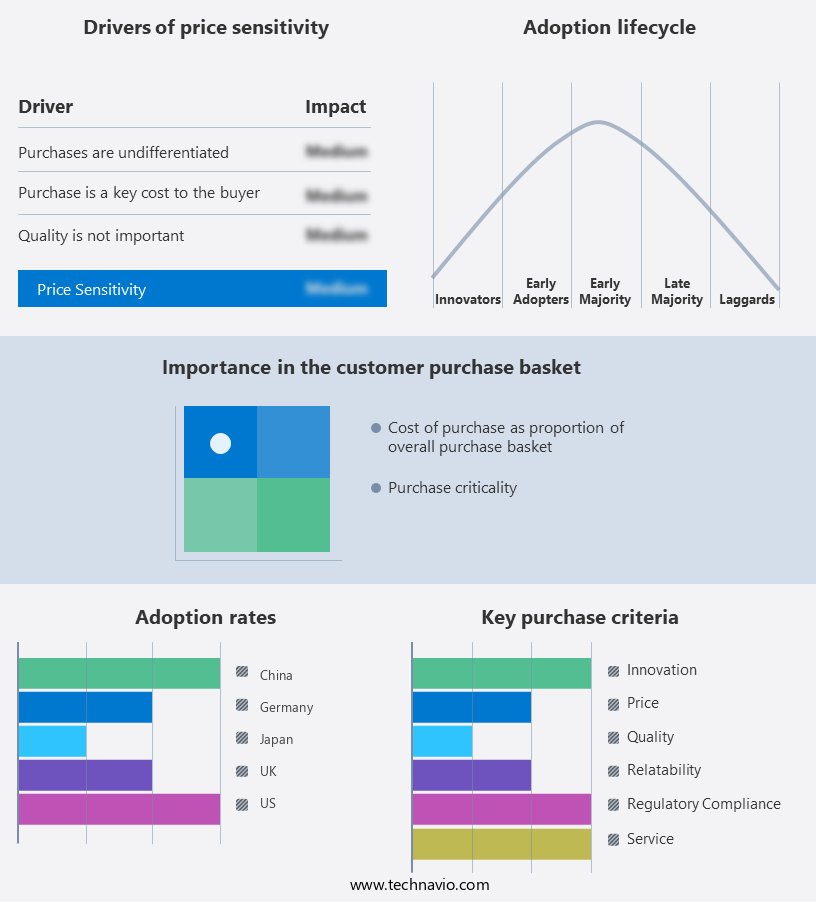
Exclusive Customer Landscape
The pupillometer market forecasting report includes the adoption lifecycle of the market, covering from the innovator's stage to the laggard's stage. It focuses on adoption rates in different regions based on penetration. Furthermore, the pupillometer market report also includes key purchase criteria and drivers of price sensitivity to help companies evaluate and develop their market growth analysis strategies.
Customer Landscape
Key Companies & Market Insights
Companies are implementing various strategies, such as strategic alliances, pupillometer market forecast, partnerships, mergers and acquisitions, geographical expansion, and product/service launches, to enhance their presence in the industry.
Adaptica Srl - The company specializes in pupillometers and offers a mobile, binocular device like the 2WIN, which enables real-time assessment of both eyes' vision conditions in natural environments.
The industry research and growth report includes detailed analyses of the competitive landscape of the market and information about key companies, including:
- Adaptica Srl
- Bernell Corp.
- EssilorLuxottica
- Haag Streit AG
- Hansraj Nayyar Medical India Pvt. Ltd.
- Hilco Vision
- IDMED
- iVIS Technologies S.r.l.
- Johnson and Johnson Services Inc.
- Konan Medical USA Inc.
- Lombart Instrument Inc.
- NeurOptics Inc.
- NIDEK Co. Ltd.
- Rexxam Co. Ltd.
- Topcon Corp.
- US Ophthalmic LLC
- VISIONIX USA INC.
Qualitative and quantitative analysis of companies has been conducted to help clients understand the wider business environment as well as the strengths and weaknesses of key industry players. Data is qualitatively analyzed to categorize companies as pure play, category-focused, industry-focused, and diversified; it is quantitatively analyzed to categorize companies as dominant, leading, strong, tentative, and weak.
Recent Development and News in Pupillometer Market
- In January 2024, Medtronic plc, a leading medical technology company, announced the launch of its new Opticap Pupillometer, an advanced device designed to measure pupil size and response to light. This innovative product expansion aims to improve diagnostic accuracy and patient care in various clinical applications (Medtronic Press Release, 2024).
- In March 2024, Carl Zeiss Meditec AG, a renowned opto-electronics company, entered into a strategic partnership with a major hospital chain in Europe to integrate their Retina Module for pupilometry into the hospital's ophthalmology department. This collaboration will enable early detection and monitoring of various eye conditions, expanding their market reach and strengthening their position in the European market (Carl Zeiss Meditec AG Press Release, 2024).
- In May 2024, Nidek Co. Ltd., a leading ophthalmic equipment manufacturer, secured a significant investment of USD 50 million in a Series C funding round from a prominent venture capital firm. The funds will be used to accelerate the development and commercialization of their next-generation pupillometer technology, which promises to enhance diagnostic capabilities and expand their market share in the global ophthalmic devices market (BusinessWire, 2024).
- In February 2025, the US Food and Drug Administration (FDA) granted clearance to Topcon Corporation for their new NW400 Nonmydriatic Pupillometer, enabling the company to market and sell the device in the United States. This approval marks a significant milestone for Topcon, expanding their product offerings and increasing their presence in the competitive US market (Topcon Corporation Press Release, 2025).
Research Analyst Overview
- The market for pupillometer technology continues to advance, with increasing demand driven by the need for objective and non-invasive measurements of cognitive workload and emotional responses. One notable application is in the aviation industry, where a study revealed that pilots' cognitive workload during takeoff and landing phases can be reduced by up to 20% through the use of real-time pupillometry feedback. Furthermore, industry experts anticipate a compound annual growth rate of approximately 15% for the market over the next decade, as applications expand to include fields such as healthcare, education, and human-computer interaction research.
Dive into Technavio's robust research methodology, blending expert interviews, extensive data synthesis, and validated models for unparalleled Pupillometer Market insights. See full methodology.
|
Market Scope |
|
|
Report Coverage |
Details |
|
Page number |
230 |
|
Base year |
2024 |
|
Historic period |
2019-2023 |
|
Forecast period |
2025-2029 |
|
Growth momentum & CAGR |
Accelerate at a CAGR of 7.6% |
|
Market growth 2025-2029 |
USD 189.2 million |
|
Market structure |
Fragmented |
|
YoY growth 2024-2025(%) |
7.1 |
|
Key countries |
US, Japan, UK, Brazil, China, Germany, Canada, India, France, and Italy |
|
Competitive landscape |
Leading Companies, Market Positioning of Companies, Competitive Strategies, and Industry Risks |
What are the Key Data Covered in this Pupillometer Market Research and Growth Report?
- CAGR of the Pupillometer industry during the forecast period
- Detailed information on factors that will drive the growth and forecasting between 2025 and 2029
- Precise estimation of the size of the market and its contribution of the industry in focus to the parent market
- Accurate predictions about upcoming growth and trends and changes in consumer behaviour
- Growth of the market across North America, Europe, Asia, and Rest of World (ROW)
- Thorough analysis of the market's competitive landscape and detailed information about companies
- Comprehensive analysis of factors that will challenge the pupillometer market growth of industry companies
We can help! Our analysts can customize this pupillometer market research report to meet your requirements.
 RIA -
RIA - 
