Purified Terephthalic Acid (PTA) Market Analysis, Size, and Forecast 2026-2030: APAC (China, India, and Japan), North America (US, Mexico, and Canada), Europe (Germany, UK, and France), South America (Brazil and Argentina), Middle East and Africa (Saudi Arabia, UAE, and South Africa), and Rest of World (ROW)

Purified Terephthalic Acid (PTA) Market Analysis, Size, and Forecast 2026-2030:
APAC (China, India, and Japan), North America (US, Mexico, and Canada), Europe (Germany, UK, and France), South America (Brazil and Argentina), Middle East and Africa (Saudi Arabia, UAE, and South Africa), and Rest of World (ROW)

Published: Apr 2026 306 Pages SKU: IRTNTR75022

Market Overview at a Glance

$19.73 B
Market Opportunity
5.3%
CAGR 2025 - 2030
59%
APAC Growth
$39.99 B
Polyester fiber segment 2024

Purified Terephthalic Acid (PTA) Market Size 2026-2030

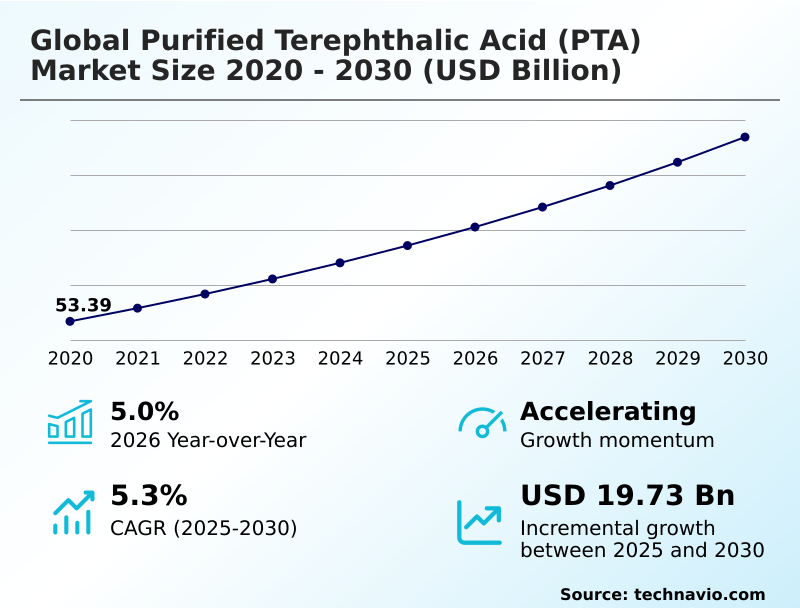
The purified terephthalic acid (pta) market size is valued to increase by USD 19.73 billion, at a CAGR of 5.3% from 2025 to 2030. Increasing demand for polyester fibers in textile industry will drive the purified terephthalic acid (pta) market.

Major Market Trends & Insights

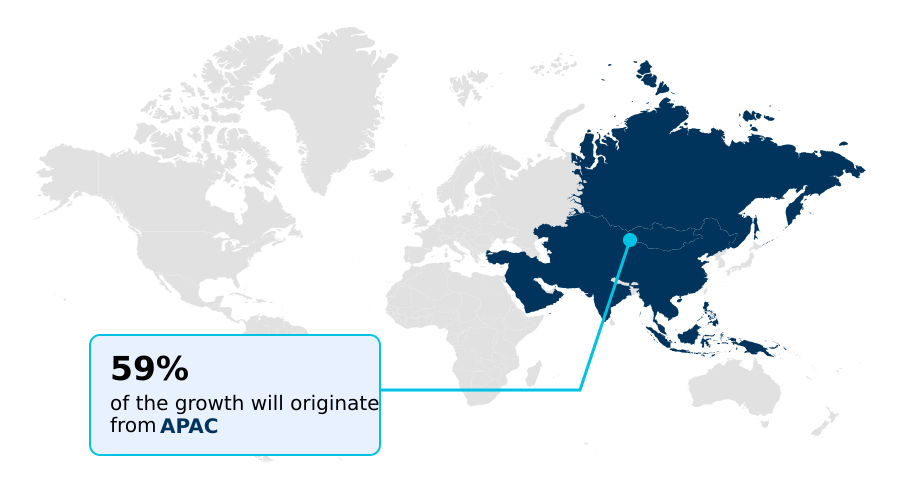
  • APAC dominated the market and accounted for a 59% growth during the forecast period.
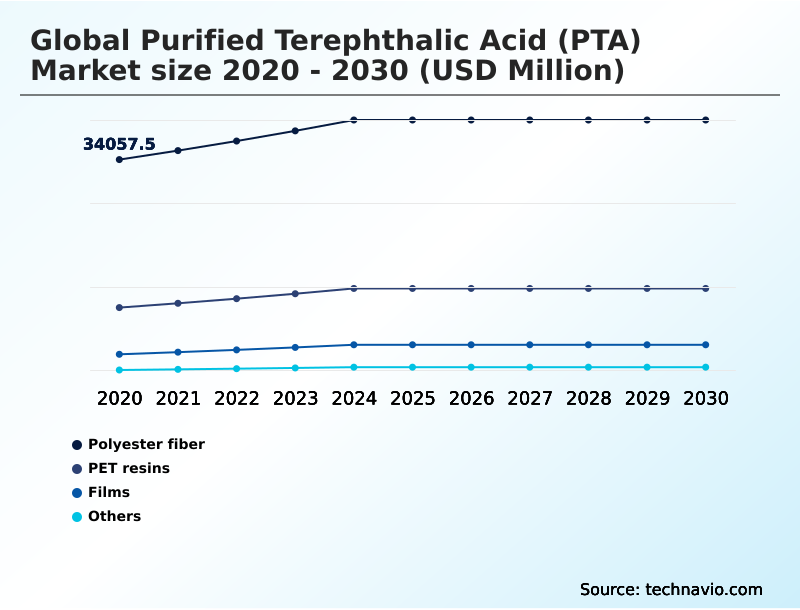
  • By Application - Polyester fiber segment was valued at USD 39.99 billion in 2024
  • By End-user - Textile segment accounted for the largest market revenue share in 2024

Market Size & Forecast

  • Market Opportunities: USD 33.51 billion
  • Market Future Opportunities: USD 19.73 billion
  • CAGR from 2025 to 2030 : 5.3%

Market Summary

  • The Purified Terephthalic Acid (PTA) market is defined by its essential role as a precursor for polyester polymers, including polyethylene terephthalate (PET) and polybutylene terephthalate. Its trajectory is linked to demand from the textile and packaging industries, which rely on polyester staple fibers and PET resins.
  • A significant trend is the push toward a circular economy, with a focus on chemical recycling and the development of bio-based PTA to reduce dependence on fossil fuels. However, producers face the persistent challenge of paraxylene price volatility, driven by geopolitical instability and fluctuations in the crude oil market.
  • In response, a key business scenario involves leveraging digital twin technology for process simulation. This allows manufacturers to optimize paraxylene oxidation and improve heat recovery from exothermic energy generation, reducing operational costs and enhancing resilience against market shocks. This strategic adoption of Industry 4.0 principles is becoming critical for maintaining profitability.
  • The market is also shaped by stringent environmental regulations, forcing investments in advanced oxidation technologies and more efficient catalyst systems to minimize emissions and secure a competitive advantage in an evolving industrial landscape.

What will be the Size of the Purified Terephthalic Acid (PTA) Market during the forecast period?

Get Key Insights on Market Forecast (PDF) Request Free Sample

How is the Purified Terephthalic Acid (PTA) Market Segmented?

The purified terephthalic acid (pta) industry research report provides comprehensive data (region-wise segment analysis), with forecasts and estimates in "USD million" for the period 2026-2030, as well as historical data from 2020-2024 for the following segments.

  • Application
    • Polyester fiber
    • PET resins
    • Films
    • Others
  • End-user
    • Textile
    • PET bottles
    • Packaging
  • Technology
    • PX oxidation
    • Bio-based PTA
    • Chemical recycling-based PTA
  • Geography
    • APAC
      • China
      • India
      • Japan
    • North America
      • US
      • Mexico
      • Canada
    • Europe
      • Germany
      • UK
      • France
    • South America
      • Brazil
      • Argentina
    • Middle East and Africa
      • Saudi Arabia
      • UAE
      • South Africa
    • Rest of World (ROW)

By Application Insights

The polyester fiber segment is estimated to witness significant growth during the forecast period.

The polyester fiber segment is foundational, involving the **polyester polymer synthesis** through a **condensation polymerization** reaction between a **high-purity crystalline compound** and **monoethylene glycol**.

This process yields fibers with high **thermal stability** and **high tensile strength**, crucial for both apparel and technical textiles that require features like **moisture-wicking properties**.

The industry is pivoting toward **sustainable polymer solutions** and **closed-loop manufacturing** to meet stricter environmental mandates. This shift is accelerated by advancements in **chemical recycling**, which enables **monomer recovery** from **recycled feedstock**.

This **circular economy integration** is redefining production, with new processes demonstrating over 90% efficiency in converting post-consumer textiles back into valuable raw materials, highlighting a strategic move toward resource security.

Request Free Sample

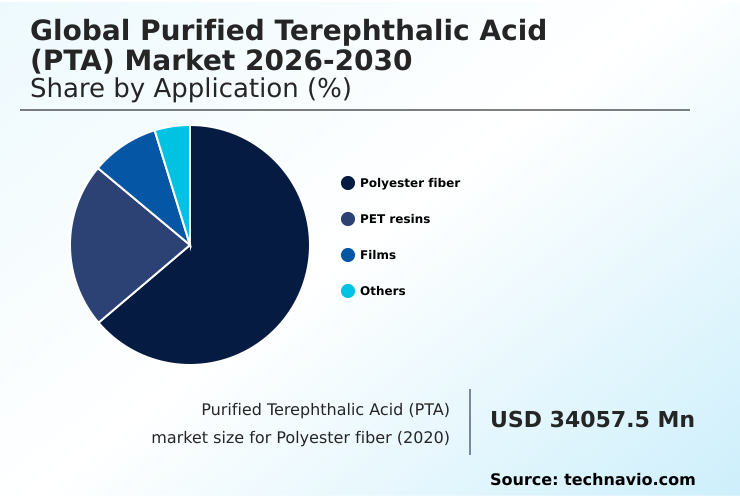
The Polyester fiber segment was valued at USD 39.99 billion in 2024 and showed a gradual increase during the forecast period.

Request Free Sample

Regional Analysis

APAC is estimated to contribute 59% to the growth of the global market during the forecast period.Technavio’s analysts have elaborately explained the regional trends and drivers that shape the market during the forecast period.

See How Purified Terephthalic Acid (PTA) Market Demand is Rising in APAC Request Free Sample

The global geographic landscape is characterized by a strategic division of labor, with APAC dominating high-volume production of **filament yarns** and standard **polymer-grade PTA** through **liquid-phase oxidation**. This region leverages massive, vertically integrated industrial parks to achieve economies of scale.

In contrast, North America and Europe are pivoting toward high-value applications, such as **high-tenacity industrial yarns** and materials for **polybutylene terephthalate** compounds. These mature markets are early adopters of **digital twin technology** and **AI-driven process optimization**.

For instance, AI-driven scheduling for **coordinated plant turnarounds** has reduced facility downtime by up to 20%.

Furthermore, the use of **blockchain traceability** is becoming a standard to validate sustainability claims, aligning with strict regulatory environments and consumer expectations for transparency in the supply chain.

Market Dynamics

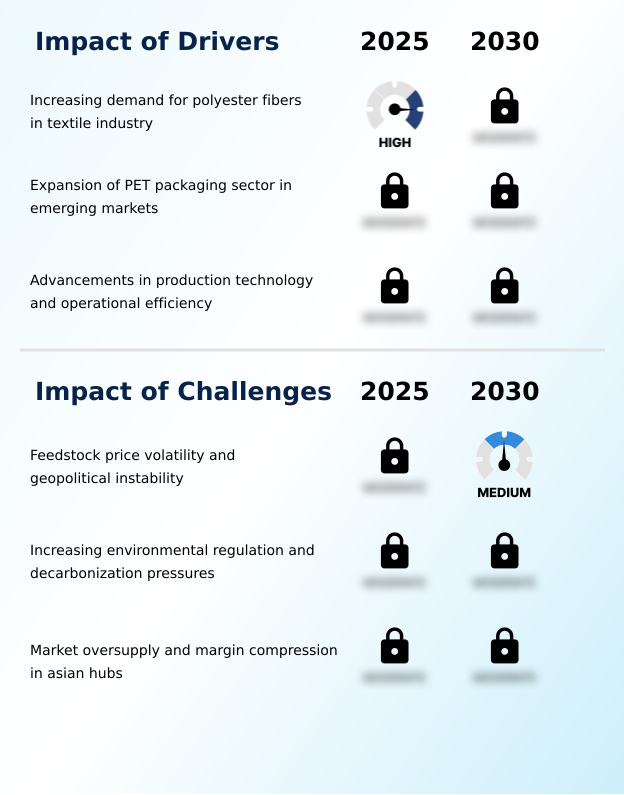
Our researchers analyzed the data with 2025 as the base year, along with the key drivers, trends, and challenges. A holistic analysis of drivers will help companies refine their marketing strategies to gain a competitive advantage.

  • Strategic decision-making in the Purified Terephthalic Acid (PTA) market is increasingly complex, balancing commodity scale with high-value specialization. A key focus is **optimizing paraxylene to PTA conversion efficiency** to counter volatile input costs. Concurrently, the industry is heavily invested in sustainability, exploring both **advancements in bio-based PTA production** and various **chemical recycling methods for post-consumer PET**.
  • The goal of creating **circular PTA from mixed plastic waste** is driving innovation, supported by digital tools like **digital twin for PTA plant simulation**, which allows for virtual process refinement. For downstream applications, developing **high-purity PTA for advanced polyester films** and specific **PTA grades for technical textile applications** offers margin uplift.
  • Firms specializing in **specialty PTA for automotive interior textiles** report margins that are consistently higher than those in standard segments, sometimes by a differential of over 10 percentage points. Managing **feedstock price volatility in PTA** remains a core challenge, addressed through **supply chain regionalization for PTA resilience** and the use of **AI for predictive maintenance in PTA plants**.
  • Furthermore, **reducing carbon footprint of PTA manufacturing** is a critical objective, influenced by the **impact of regulations on PTA plant operations**. This involves **improving catalyst performance in PX oxidation** and designing better **energy recovery systems in PTA production**.
  • For packaging, the focus is on **integrating recycled content into PET resins**, ensuring **bottle-grade PTA feedstock quality control**, and supporting the **lightweighting of PET bottles with advanced resins**. Finally, technologies like **blockchain for PTA supply chain traceability** are ensuring transparency for **PTA for high-barrier food packaging**.

What are the key market drivers leading to the rise in the adoption of Purified Terephthalic Acid (PTA) Industry?

  • The increasing demand for polyester fibers within the global textile industry serves as a key driver for market growth.

  • Market growth is fundamentally driven by robust demand from end-use industries and continuous process innovations. The surging consumption of **polyethylene terephthalate** for packaging, valued for its **shatter resistance** and use in **food-grade packaging resins**, provides a stable demand base.
  • This is complemented by advancements in manufacturing technology, where the optimization of **paraxylene oxidation** through **efficient catalyst systems** is a key focus. These systems are improving **paraxylene conversion yield** by up to 3%, directly enhancing profitability.
  • Furthermore, the adoption of **advanced process controls** and the implementation of **operational excellence programs** are mitigating the impact of **feedstock price volatility**.
  • In pursuit of greater resilience, many producers are establishing **regionalized supply chains** and exploring **near-shoring operations**, which reduce logistical costs by over 10% and improve **end-to-end supply chain transparency**.

What are the market trends shaping the Purified Terephthalic Acid (PTA) Industry?

  • A primary market trend is the acceleration of the circular economy, which is characterized by the increasing integration of recycled feedstocks into production value chains.

  • Key trends are reshaping the industry, with a strong focus on sustainability and technological innovation. The exploration of **bio-based PTA** from renewable sources like **biomass-derived isobutanol** is accelerating, driven by a market desire to move away from fossil fuel dependency.
  • Concurrently, advanced **depolymerization methods** such as **glycolysis** and **methanolysis** are enabling the chemical recycling of post-consumer waste into high-value raw materials. The use of specialized **PET-degrading enzymes** in these processes is a significant breakthrough, with pilot programs demonstrating monomer recovery rates exceeding 95%.
  • This shift toward circularity is creating new value streams from materials previously considered waste, such as **non-woven fabrics** and complex composites. These advancements are critical for producing next-generation materials like high-performance **biaxially oriented films** with superior **dielectric strength**, meeting the evolving demands of the electronics and packaging sectors.

What challenges does the Purified Terephthalic Acid (PTA) Industry face during its growth?

  • A key challenge affecting industry growth is the combination of feedstock price volatility and geopolitical instability.

  • The market faces significant structural challenges, led by intense **margin compression** and the need for stringent **feedstock security strategy**. The core production process, while efficient, generates significant **exothermic energy generation**, requiring costly **heat recovery systems** to manage.
  • Adherence to new environmental standards, such as the **carbon border adjustment mechanism**, is increasing operational expenditures by 5-10% for producers with less efficient **advanced oxidation technologies**. This regulatory pressure is compelling a shift toward cleaner alternatives like **bio-paraxylene**, derived from sources such as **biomass-derived isobutanol** through complex **dehydrocyclization reaction** pathways.
  • For companies with a **vertically integrated value chain**, these investments are manageable; however, standalone producers struggle to absorb the costs, impacting the supply of materials like **bottle-grade PTA feedstock** and **industrial-grade PTA**.

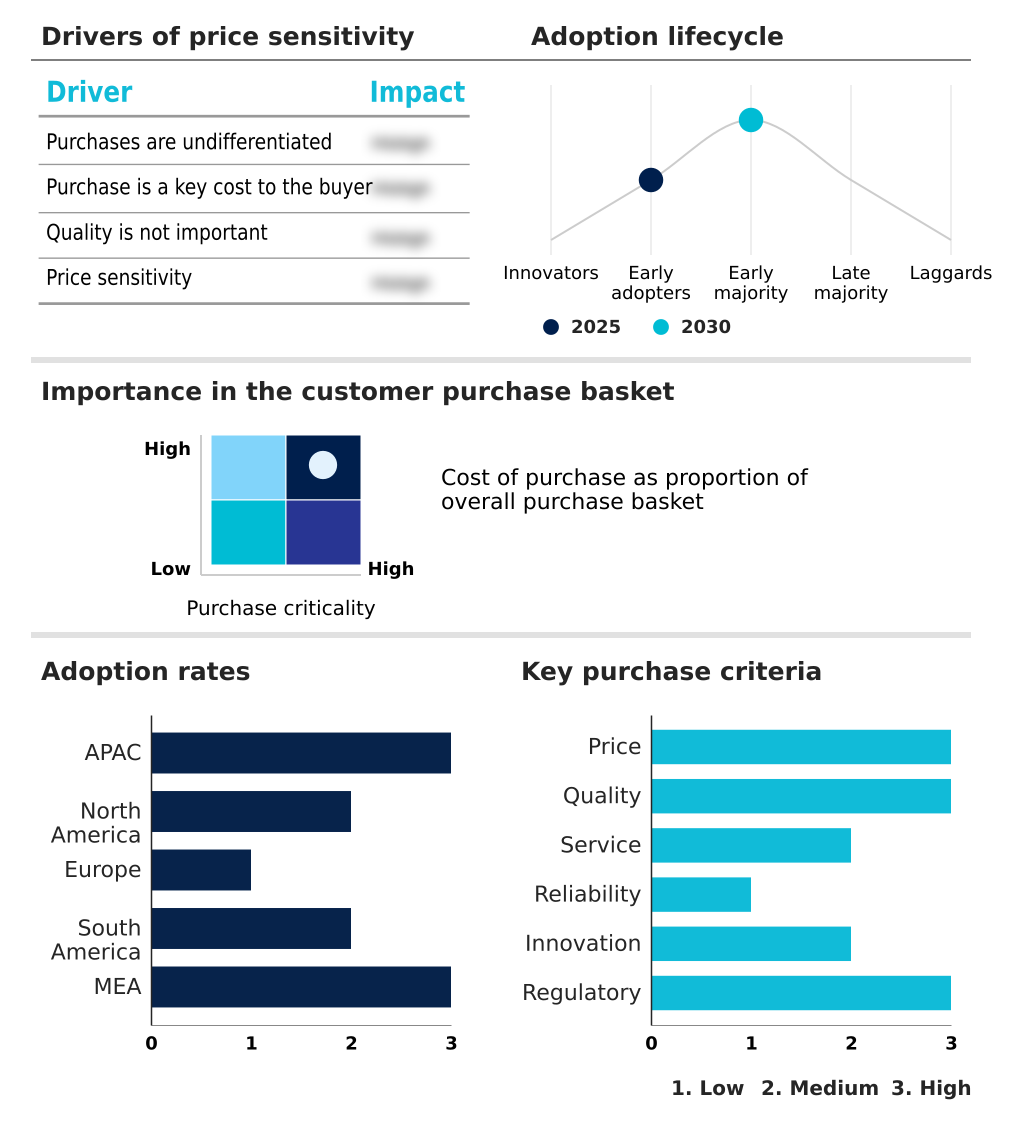
Exclusive Technavio Analysis on Customer Landscape

The purified terephthalic acid (pta) market forecasting report includes the adoption lifecycle of the market, covering from the innovator’s stage to the laggard’s stage. It focuses on adoption rates in different regions based on penetration. Furthermore, the purified terephthalic acid (pta) market report also includes key purchase criteria and drivers of price sensitivity to help companies evaluate and develop their market growth analysis strategies.

Customer Landscape of Purified Terephthalic Acid (PTA) Industry

Competitive Landscape

Companies are implementing various strategies, such as strategic alliances, purified terephthalic acid (pta) market forecast, partnerships, mergers and acquisitions, geographical expansion, and product/service launches, to enhance their presence in the industry.

Alpek SAB de CV - Analysts observe a competitive landscape defined by integrated petrochemical conglomerates specializing in industrial-grade PTA, polymer-grade PTA, and other polyester intermediates for diverse global applications.

The industry research and growth report includes detailed analyses of the competitive landscape of the market and information about key companies, including:

  • Alpek SAB de CV
  • Formosa Chemicals and Fibre Corp
  • Hanwha Impact Corp
  • Hengli Petrochemical Co. Ltd
  • Hengyi Petrochemical Co. Ltd.
  • Indian Oil Corp. Ltd.
  • Indorama Ventures Public Co.
  • INEOS Group Holdings S.A.
  • Lotte Chemical Corp.
  • MCPI Pvt Ltd
  • Mitsui Chemicals Inc.
  • PTT Global Chemical Public Co.
  • Reliance Industries Ltd.
  • Saudi Basic Industries
  • Sinopec Shanghai Co. Ltd.
  • SK geo centric Co Ltd
  • SOCAR Turkiye Enerji A.S.
  • Taekwang Industrial Co. Ltd.
  • The Mitsubishi Chemical Group
  • Tongkun Group Co. Ltd.

Qualitative and quantitative analysis of companies has been conducted to help clients understand the wider business environment as well as the strengths and weaknesses of key industry players. Data is qualitatively analyzed to categorize companies as pure play, category-focused, industry-focused, and diversified; it is quantitatively analyzed to categorize companies as dominant, leading, strong, tentative, and weak.

Recent Development and News in Purified terephthalic acid (pta) market

  • In April, 2025, Indorama Ventures concluded the installation of a new purification stage at its plant in Poland, designed to enhance product color and purity standards for the high-end cosmetic packaging sector.
  • In March, 2025, Reliance Industries in India finalized the commissioning of a significant expansion project at its Dahej facility, which markedly increases the domestic availability of the acid to support the country's burgeoning textile sector.
  • In March, 2025, OQ in Oman announced that its aromatics complex reached a record for operational efficiency following the successful testing of a new digital control system that optimizes feedstock ratios.
  • In February, 2025, Alpek Polyester announced the successful completion of a comprehensive technological upgrade at its site in South Carolina, integrating advanced filtration systems to improve output quality for specialized film applications.

Dive into Technavio’s robust research methodology, blending expert interviews, extensive data synthesis, and validated models for unparalleled Purified Terephthalic Acid (PTA) Market insights. See full methodology.

Market Scope
Page number 306
Base year 2025
Historic period 2020-2024
Forecast period 2026-2030
Growth momentum & CAGR Accelerate at a CAGR of 5.3%
Market growth 2026-2030 USD 19728.5 million
Market structure Fragmented
YoY growth 2025-2026(%) 5.0%
Key countries China, India, Japan, South Korea, Indonesia, Australia, US, Mexico, Canada, Germany, UK, France, Italy, Spain, The Netherlands, Brazil, Argentina, Chile, Saudi Arabia, UAE, South Africa, Turkey and Israel
Competitive landscape Leading Companies, Market Positioning of Companies, Competitive Strategies, and Industry Risks

Request Free Sample

Research Analyst Overview

  • The Purified Terephthalic Acid (PTA) market operates at the intersection of commodity chemical manufacturing and advanced material science. Core production relies on the **liquid-phase oxidation** of paraxylene to create a **high-purity crystalline compound**, which serves as the essential building block for **polyester polymer synthesis**.
  • This process yields precursors for **polyethylene terephthalate (PET)** and **polybutylene terephthalate**, which are then transformed into **polyester staple fibers**, **filament yarns**, and **PET resins**. Boardroom-level strategy is increasingly focused on navigating the dichotomy between achieving **mega-site economies of scale** and investing in high-margin niches.
  • For instance, the demand for materials with exceptional **thermal stability** and **shatter resistance** in electronics and automotive sectors is driving the development of specialized grades. Producers focusing on these high-purity applications are achieving outputs with less than 10 ppm of contaminants like **4-carboxybenzaldehyde**, a critical metric for advanced **biaxially oriented films**.
  • This pursuit of quality requires **efficient catalyst systems** and superior **heat recovery systems** to remain cost-competitive while meeting stringent specifications for applications demanding high **dielectric strength**.

What are the Key Data Covered in this Purified Terephthalic Acid (PTA) Market Research and Growth Report?

  • What is the expected growth of the Purified Terephthalic Acid (PTA) Market between 2026 and 2030?

    • USD 19.73 billion, at a CAGR of 5.3%

  • What segmentation does the market report cover?

    • The report is segmented by Application (Polyester fiber, PET resins, Films, and Others), End-user (Textile, PET bottles, and Packaging), Technology (PX oxidation, Bio-based PTA, and Chemical recycling-based PTA) and Geography (APAC, North America, Europe, South America, Middle East and Africa)

  • Which regions are analyzed in the report?

    • APAC, North America, Europe, South America and Middle East and Africa

  • What are the key growth drivers and market challenges?

    • Increasing demand for polyester fibers in textile industry, Feedstock price volatility and geopolitical instability

  • Who are the major players in the Purified Terephthalic Acid (PTA) Market?

    • Alpek SAB de CV, Formosa Chemicals and Fibre Corp, Hanwha Impact Corp, Hengli Petrochemical Co. Ltd, Hengyi Petrochemical Co. Ltd., Indian Oil Corp. Ltd., Indorama Ventures Public Co., INEOS Group Holdings S.A., Lotte Chemical Corp., MCPI Pvt Ltd, Mitsui Chemicals Inc., PTT Global Chemical Public Co., Reliance Industries Ltd., Saudi Basic Industries, Sinopec Shanghai Co. Ltd., SK geo centric Co Ltd, SOCAR Turkiye Enerji A.S., Taekwang Industrial Co. Ltd., The Mitsubishi Chemical Group and Tongkun Group Co. Ltd.

Market Research Insights

  • Market dynamics are increasingly shaped by a strategic pivot toward sustainability and operational resilience. The adoption of advanced process controls and operational excellence programs is enabling producers to mitigate the effects of feedstock price volatility. Firms leveraging end-to-end supply chain transparency are achieving up to 15% improvement in logistical efficiency.
  • Concurrently, the push for a circular economy is driving innovation, with new chemical recycling methods achieving over 90% monomer recovery rates. This transition is supported by the exploration of near-shoring operations and the development of regionalized supply chains to enhance feedstock security.
  • As environmental pressures mount, forward-thinking companies are proactively preparing for regulations like the carbon border adjustment mechanism, positioning themselves for long-term competitive advantage in a market where sustainability is becoming a key differentiator.

We can help! Our analysts can customize this purified terephthalic acid (pta) market research report to meet your requirements.

Get in touch

1. Executive Summary

1.1 Market overview

Executive Summary - Chart on Market Overview
Executive Summary - Data Table on Market Overview
Executive Summary - Chart on Global Market Characteristics
Executive Summary - Chart on Market by Geography
Executive Summary - Chart on Market Segmentation by Application
Executive Summary - Chart on Market Segmentation by End-user
Executive Summary - Chart on Market Segmentation by Technology
Executive Summary - Chart on Incremental Growth
Executive Summary - Data Table on Incremental Growth
Executive Summary - Chart on Company Market Positioning

2. Technavio Analysis

2.1 Analysis of price sensitivity, lifecycle, customer purchase basket, adoption rates, and purchase criteria

2.2 Criticality of inputs and Factors of differentiation

Chart on Overview on criticality of inputs and factors of differentiation

2.3 Factors of disruption

Chart on Overview on factors of disruption

2.4 Impact of drivers and challenges

Chart on Impact of drivers and challenges in 2025 and 2030

3. Market Landscape

3.1 Market ecosystem

Chart on Parent Market
Data Table on - Parent Market

3.2 Market characteristics

Chart on Market characteristics analysis

3.3 Value chain analysis

Chart on Value chain analysis

4. Market Sizing

4.1 Market definition

Data Table on Offerings of companies included in the market definition

4.2 Market segment analysis

Market segments

4.3 Market size 2025

4.4 Market outlook: Forecast for 2025-2030

Chart on Global - Market size and forecast 2025-2030 ($ million)
Data Table on Global - Market size and forecast 2025-2030 ($ million)
Chart on Global Market: Year-over-year growth 2025-2030 (%)
Data Table on Global Market: Year-over-year growth 2025-2030 (%)

5. Historic Market Size

5.1 Global Purified Terephthalic Acid (PTA) Market 2020 - 2024

Historic Market Size - Data Table on Global Purified Terephthalic Acid (PTA) Market 2020 - 2024 ($ million)

5.2 Application segment analysis 2020 - 2024

Historic Market Size - Application Segment 2020 - 2024 ($ million)

5.3 End-user segment analysis 2020 - 2024

Historic Market Size - End-user Segment 2020 - 2024 ($ million)

5.4 Technology segment analysis 2020 - 2024

Historic Market Size - Technology Segment 2020 - 2024 ($ million)

5.5 Geography segment analysis 2020 - 2024

Historic Market Size - Geography Segment 2020 - 2024 ($ million)

5.6 Country segment analysis 2020 - 2024

Historic Market Size - Country Segment 2020 - 2024 ($ million)

6. Qualitative Analysis

6.1 Impact of AI on global purified terephthalic acid (PTA) market

6.2 Impact of geopolitical conflicts on global purified terephthalic acid (PTA) market

7. Five Forces Analysis

7.1 Five forces summary

Five forces analysis - Comparison between 2025 and 2030

7.2 Bargaining power of buyers

Bargaining power of buyers - Impact of key factors 2025 and 2030

7.3 Bargaining power of suppliers

Bargaining power of suppliers - Impact of key factors in 2025 and 2030

7.4 Threat of new entrants

Threat of new entrants - Impact of key factors in 2025 and 2030

7.5 Threat of substitutes

Threat of substitutes - Impact of key factors in 2025 and 2030

7.6 Threat of rivalry

Threat of rivalry - Impact of key factors in 2025 and 2030

7.7 Market condition

Chart on Market condition - Five forces 2025 and 2030

8. Market Segmentation by Application

8.1 Market segments

Chart on Application - Market share 2025-2030 (%)
Data Table on Application - Market share 2025-2030 (%)

8.2 Comparison by Application

Chart on Comparison by Application
Data Table on Comparison by Application

8.3 Polyester fiber - Market size and forecast 2025-2030

Chart on Polyester fiber - Market size and forecast 2025-2030 ($ million)
Data Table on Polyester fiber - Market size and forecast 2025-2030 ($ million)
Chart on Polyester fiber - Year-over-year growth 2025-2030 (%)
Data Table on Polyester fiber - Year-over-year growth 2025-2030 (%)

8.4 PET resins - Market size and forecast 2025-2030

Chart on PET resins - Market size and forecast 2025-2030 ($ million)
Data Table on PET resins - Market size and forecast 2025-2030 ($ million)
Chart on PET resins - Year-over-year growth 2025-2030 (%)
Data Table on PET resins - Year-over-year growth 2025-2030 (%)

8.5 Films - Market size and forecast 2025-2030

Chart on Films - Market size and forecast 2025-2030 ($ million)
Data Table on Films - Market size and forecast 2025-2030 ($ million)
Chart on Films - Year-over-year growth 2025-2030 (%)
Data Table on Films - Year-over-year growth 2025-2030 (%)

8.6 Others - Market size and forecast 2025-2030

Chart on Others - Market size and forecast 2025-2030 ($ million)
Data Table on Others - Market size and forecast 2025-2030 ($ million)
Chart on Others - Year-over-year growth 2025-2030 (%)
Data Table on Others - Year-over-year growth 2025-2030 (%)

8.7 Market opportunity by Application

Market opportunity by Application ($ million)
Data Table on Market opportunity by Application ($ million)

9. Market Segmentation by End-user

9.1 Market segments

Chart on End-user - Market share 2025-2030 (%)
Data Table on End-user - Market share 2025-2030 (%)

9.2 Comparison by End-user

Chart on Comparison by End-user
Data Table on Comparison by End-user

9.3 Textile - Market size and forecast 2025-2030

Chart on Textile - Market size and forecast 2025-2030 ($ million)
Data Table on Textile - Market size and forecast 2025-2030 ($ million)
Chart on Textile - Year-over-year growth 2025-2030 (%)
Data Table on Textile - Year-over-year growth 2025-2030 (%)

9.4 PET bottles - Market size and forecast 2025-2030

Chart on PET bottles - Market size and forecast 2025-2030 ($ million)
Data Table on PET bottles - Market size and forecast 2025-2030 ($ million)
Chart on PET bottles - Year-over-year growth 2025-2030 (%)
Data Table on PET bottles - Year-over-year growth 2025-2030 (%)

9.5 Packaging - Market size and forecast 2025-2030

Chart on Packaging - Market size and forecast 2025-2030 ($ million)
Data Table on Packaging - Market size and forecast 2025-2030 ($ million)
Chart on Packaging - Year-over-year growth 2025-2030 (%)
Data Table on Packaging - Year-over-year growth 2025-2030 (%)

9.6 Market opportunity by End-user

Market opportunity by End-user ($ million)
Data Table on Market opportunity by End-user ($ million)

10. Market Segmentation by Technology

10.1 Market segments

Chart on Technology - Market share 2025-2030 (%)
Data Table on Technology - Market share 2025-2030 (%)

10.2 Comparison by Technology

Chart on Comparison by Technology
Data Table on Comparison by Technology

10.3 PX oxidation - Market size and forecast 2025-2030

Chart on PX oxidation - Market size and forecast 2025-2030 ($ million)
Data Table on PX oxidation - Market size and forecast 2025-2030 ($ million)
Chart on PX oxidation - Year-over-year growth 2025-2030 (%)
Data Table on PX oxidation - Year-over-year growth 2025-2030 (%)

10.4 Bio-based PTA - Market size and forecast 2025-2030

Chart on Bio-based PTA - Market size and forecast 2025-2030 ($ million)
Data Table on Bio-based PTA - Market size and forecast 2025-2030 ($ million)
Chart on Bio-based PTA - Year-over-year growth 2025-2030 (%)
Data Table on Bio-based PTA - Year-over-year growth 2025-2030 (%)

10.5 Chemical recycling-based PTA - Market size and forecast 2025-2030

Chart on Chemical recycling-based PTA - Market size and forecast 2025-2030 ($ million)
Data Table on Chemical recycling-based PTA - Market size and forecast 2025-2030 ($ million)
Chart on Chemical recycling-based PTA - Year-over-year growth 2025-2030 (%)
Data Table on Chemical recycling-based PTA - Year-over-year growth 2025-2030 (%)

10.6 Market opportunity by Technology

Market opportunity by Technology ($ million)
Data Table on Market opportunity by Technology ($ million)

11. Customer Landscape

11.1 Customer landscape overview

Analysis of price sensitivity, lifecycle, customer purchase basket, adoption rates, and purchase criteria

12. Geographic Landscape

12.1 Geographic segmentation

Chart on Market share by geography 2025-2030 (%)
Data Table on Market share by geography 2025-2030 (%)

12.2 Geographic comparison

Chart on Geographic comparison
Data Table on Geographic comparison

12.3 APAC - Market size and forecast 2025-2030

Chart on APAC - Market size and forecast 2025-2030 ($ million)
Data Table on APAC - Market size and forecast 2025-2030 ($ million)
Chart on APAC - Year-over-year growth 2025-2030 (%)
Data Table on APAC - Year-over-year growth 2025-2030 (%)
Chart on Regional Comparison - APAC
Data Table on Regional Comparison - APAC

12.3.1 China - Market size and forecast 2025-2030

Chart on China - Market size and forecast 2025-2030 ($ million)
Data Table on China - Market size and forecast 2025-2030 ($ million)
Chart on China - Year-over-year growth 2025-2030 (%)
Data Table on China - Year-over-year growth 2025-2030 (%)

12.3.2 India - Market size and forecast 2025-2030

Chart on India - Market size and forecast 2025-2030 ($ million)
Data Table on India - Market size and forecast 2025-2030 ($ million)
Chart on India - Year-over-year growth 2025-2030 (%)
Data Table on India - Year-over-year growth 2025-2030 (%)

12.3.3 Japan - Market size and forecast 2025-2030

Chart on Japan - Market size and forecast 2025-2030 ($ million)
Data Table on Japan - Market size and forecast 2025-2030 ($ million)
Chart on Japan - Year-over-year growth 2025-2030 (%)
Data Table on Japan - Year-over-year growth 2025-2030 (%)

12.3.4 South Korea - Market size and forecast 2025-2030

Chart on South Korea - Market size and forecast 2025-2030 ($ million)
Data Table on South Korea - Market size and forecast 2025-2030 ($ million)
Chart on South Korea - Year-over-year growth 2025-2030 (%)
Data Table on South Korea - Year-over-year growth 2025-2030 (%)

12.3.5 Indonesia - Market size and forecast 2025-2030

Chart on Indonesia - Market size and forecast 2025-2030 ($ million)
Data Table on Indonesia - Market size and forecast 2025-2030 ($ million)
Chart on Indonesia - Year-over-year growth 2025-2030 (%)
Data Table on Indonesia - Year-over-year growth 2025-2030 (%)

12.3.6 Australia - Market size and forecast 2025-2030

Chart on Australia - Market size and forecast 2025-2030 ($ million)
Data Table on Australia - Market size and forecast 2025-2030 ($ million)
Chart on Australia - Year-over-year growth 2025-2030 (%)
Data Table on Australia - Year-over-year growth 2025-2030 (%)

12.4 North America - Market size and forecast 2025-2030

Chart on North America - Market size and forecast 2025-2030 ($ million)
Data Table on North America - Market size and forecast 2025-2030 ($ million)
Chart on North America - Year-over-year growth 2025-2030 (%)
Data Table on North America - Year-over-year growth 2025-2030 (%)
Chart on Regional Comparison - North America
Data Table on Regional Comparison - North America

12.4.1 US - Market size and forecast 2025-2030

Chart on US - Market size and forecast 2025-2030 ($ million)
Data Table on US - Market size and forecast 2025-2030 ($ million)
Chart on US - Year-over-year growth 2025-2030 (%)
Data Table on US - Year-over-year growth 2025-2030 (%)

12.4.2 Mexico - Market size and forecast 2025-2030

Chart on Mexico - Market size and forecast 2025-2030 ($ million)
Data Table on Mexico - Market size and forecast 2025-2030 ($ million)
Chart on Mexico - Year-over-year growth 2025-2030 (%)
Data Table on Mexico - Year-over-year growth 2025-2030 (%)

12.4.3 Canada - Market size and forecast 2025-2030

Chart on Canada - Market size and forecast 2025-2030 ($ million)
Data Table on Canada - Market size and forecast 2025-2030 ($ million)
Chart on Canada - Year-over-year growth 2025-2030 (%)
Data Table on Canada - Year-over-year growth 2025-2030 (%)

12.5 Europe - Market size and forecast 2025-2030

Chart on Europe - Market size and forecast 2025-2030 ($ million)
Data Table on Europe - Market size and forecast 2025-2030 ($ million)
Chart on Europe - Year-over-year growth 2025-2030 (%)
Data Table on Europe - Year-over-year growth 2025-2030 (%)
Chart on Regional Comparison - Europe
Data Table on Regional Comparison - Europe

12.5.1 Germany - Market size and forecast 2025-2030

Chart on Germany - Market size and forecast 2025-2030 ($ million)
Data Table on Germany - Market size and forecast 2025-2030 ($ million)
Chart on Germany - Year-over-year growth 2025-2030 (%)
Data Table on Germany - Year-over-year growth 2025-2030 (%)

12.5.2 UK - Market size and forecast 2025-2030

Chart on UK - Market size and forecast 2025-2030 ($ million)
Data Table on UK - Market size and forecast 2025-2030 ($ million)
Chart on UK - Year-over-year growth 2025-2030 (%)
Data Table on UK - Year-over-year growth 2025-2030 (%)

12.5.3 France - Market size and forecast 2025-2030

Chart on France - Market size and forecast 2025-2030 ($ million)
Data Table on France - Market size and forecast 2025-2030 ($ million)
Chart on France - Year-over-year growth 2025-2030 (%)
Data Table on France - Year-over-year growth 2025-2030 (%)

12.5.4 Italy - Market size and forecast 2025-2030

Chart on Italy - Market size and forecast 2025-2030 ($ million)
Data Table on Italy - Market size and forecast 2025-2030 ($ million)
Chart on Italy - Year-over-year growth 2025-2030 (%)
Data Table on Italy - Year-over-year growth 2025-2030 (%)

12.5.5 Spain - Market size and forecast 2025-2030

Chart on Spain - Market size and forecast 2025-2030 ($ million)
Data Table on Spain - Market size and forecast 2025-2030 ($ million)
Chart on Spain - Year-over-year growth 2025-2030 (%)
Data Table on Spain - Year-over-year growth 2025-2030 (%)

12.5.6 The Netherlands - Market size and forecast 2025-2030

Chart on The Netherlands - Market size and forecast 2025-2030 ($ million)
Data Table on The Netherlands - Market size and forecast 2025-2030 ($ million)
Chart on The Netherlands - Year-over-year growth 2025-2030 (%)
Data Table on The Netherlands - Year-over-year growth 2025-2030 (%)

12.6 South America - Market size and forecast 2025-2030

Chart on South America - Market size and forecast 2025-2030 ($ million)
Data Table on South America - Market size and forecast 2025-2030 ($ million)
Chart on South America - Year-over-year growth 2025-2030 (%)
Data Table on South America - Year-over-year growth 2025-2030 (%)
Chart on Regional Comparison - South America
Data Table on Regional Comparison - South America

12.6.1 Brazil - Market size and forecast 2025-2030

Chart on Brazil - Market size and forecast 2025-2030 ($ million)
Data Table on Brazil - Market size and forecast 2025-2030 ($ million)
Chart on Brazil - Year-over-year growth 2025-2030 (%)
Data Table on Brazil - Year-over-year growth 2025-2030 (%)

12.6.2 Argentina - Market size and forecast 2025-2030

Chart on Argentina - Market size and forecast 2025-2030 ($ million)
Data Table on Argentina - Market size and forecast 2025-2030 ($ million)
Chart on Argentina - Year-over-year growth 2025-2030 (%)
Data Table on Argentina - Year-over-year growth 2025-2030 (%)

12.6.3 Chile - Market size and forecast 2025-2030

Chart on Chile - Market size and forecast 2025-2030 ($ million)
Data Table on Chile - Market size and forecast 2025-2030 ($ million)
Chart on Chile - Year-over-year growth 2025-2030 (%)
Data Table on Chile - Year-over-year growth 2025-2030 (%)

12.7 Middle East and Africa - Market size and forecast 2025-2030

Chart on Middle East and Africa - Market size and forecast 2025-2030 ($ million)
Data Table on Middle East and Africa - Market size and forecast 2025-2030 ($ million)
Chart on Middle East and Africa - Year-over-year growth 2025-2030 (%)
Data Table on Middle East and Africa - Year-over-year growth 2025-2030 (%)
Chart on Regional Comparison - Middle East and Africa
Data Table on Regional Comparison - Middle East and Africa

12.7.1 Saudi Arabia - Market size and forecast 2025-2030

Chart on Saudi Arabia - Market size and forecast 2025-2030 ($ million)
Data Table on Saudi Arabia - Market size and forecast 2025-2030 ($ million)
Chart on Saudi Arabia - Year-over-year growth 2025-2030 (%)
Data Table on Saudi Arabia - Year-over-year growth 2025-2030 (%)

12.7.2 UAE - Market size and forecast 2025-2030

Chart on UAE - Market size and forecast 2025-2030 ($ million)
Data Table on UAE - Market size and forecast 2025-2030 ($ million)
Chart on UAE - Year-over-year growth 2025-2030 (%)
Data Table on UAE - Year-over-year growth 2025-2030 (%)

12.7.3 South Africa - Market size and forecast 2025-2030

Chart on South Africa - Market size and forecast 2025-2030 ($ million)
Data Table on South Africa - Market size and forecast 2025-2030 ($ million)
Chart on South Africa - Year-over-year growth 2025-2030 (%)
Data Table on South Africa - Year-over-year growth 2025-2030 (%)

12.7.4 Turkey - Market size and forecast 2025-2030

Chart on Turkey - Market size and forecast 2025-2030 ($ million)
Data Table on Turkey - Market size and forecast 2025-2030 ($ million)
Chart on Turkey - Year-over-year growth 2025-2030 (%)
Data Table on Turkey - Year-over-year growth 2025-2030 (%)

12.7.5 Israel - Market size and forecast 2025-2030

Chart on Israel - Market size and forecast 2025-2030 ($ million)
Data Table on Israel - Market size and forecast 2025-2030 ($ million)
Chart on Israel - Year-over-year growth 2025-2030 (%)
Data Table on Israel - Year-over-year growth 2025-2030 (%)

12.8 Market opportunity by geography

Market opportunity by geography ($ million)
Data Tables on Market opportunity by geography ($ million)

13. Drivers, Challenges, and Opportunity

13.1 Market drivers

Increasing demand for polyester fibers in textile industry
Expansion of PET packaging sector in emerging markets
Advancements in production technology and operational efficiency

13.2 Market challenges

Feedstock price volatility and geopolitical instability
Increasing environmental regulation and decarbonization pressures
Market oversupply and margin compression in asian hubs

13.3 Impact of drivers and challenges

Impact of drivers and challenges in 2025 and 2030

13.4 Market opportunities

Acceleration of circular economy and recycled feedstock integration
Shift toward strategic sourcing and regionalization of supply chains
Rising adoption of digitalization and AI-driven process optimization

14. Competitive Landscape

14.1 Overview

14.2

Overview on criticality of inputs and factors of differentiation

14.3 Landscape disruption

Overview on factors of disruption

14.4 Industry risks

Impact of key risks on business

15. Competitive Analysis

15.1 Companies profiled

Companies covered

15.2 Company ranking index

15.3 Market positioning of companies

Matrix on companies position and classification

15.4 Alpek SAB de CV

Alpek SAB de CV - Overview
Alpek SAB de CV - Business segments
Alpek SAB de CV - Key offerings
Alpek SAB de CV - Segment focus
SWOT

15.5 Hengli Petrochemical Co. Ltd

Hengli Petrochemical Co. Ltd - Overview
Hengli Petrochemical Co. Ltd - Product / Service
Hengli Petrochemical Co. Ltd - Key offerings
SWOT

15.6 Indian Oil Corp. Ltd.

Indian Oil Corp. Ltd. - Overview
Indian Oil Corp. Ltd. - Business segments
Indian Oil Corp. Ltd. - Key offerings
Indian Oil Corp. Ltd. - Segment focus
SWOT

15.7 Indorama Ventures Public Co.

Indorama Ventures Public Co. - Overview
Indorama Ventures Public Co. - Business segments
Indorama Ventures Public Co. - Key offerings
Indorama Ventures Public Co. - Segment focus
SWOT

15.8 INEOS Group Holdings S.A.

INEOS Group Holdings S.A. - Overview
INEOS Group Holdings S.A. - Product / Service
INEOS Group Holdings S.A. - Key offerings
SWOT

15.9 Lotte Chemical Corp.

Lotte Chemical Corp. - Overview
Lotte Chemical Corp. - Business segments
Lotte Chemical Corp. - Key offerings
Lotte Chemical Corp. - Segment focus
SWOT

15.10 Mitsui Chemicals Inc.

Mitsui Chemicals Inc. - Overview
Mitsui Chemicals Inc. - Business segments
Mitsui Chemicals Inc. - Key offerings
Mitsui Chemicals Inc. - Segment focus
SWOT

15.11 PTT Global Chemical Public Co.

PTT Global Chemical Public Co. - Overview
PTT Global Chemical Public Co. - Business segments
PTT Global Chemical Public Co. - Key offerings
PTT Global Chemical Public Co. - Segment focus
SWOT

15.12 Reliance Industries Ltd.

Reliance Industries Ltd. - Overview
Reliance Industries Ltd. - Business segments
Reliance Industries Ltd. - Key offerings
Reliance Industries Ltd. - Segment focus
SWOT

15.13 Saudi Basic Industries

Saudi Basic Industries - Overview
Saudi Basic Industries - Business segments
Saudi Basic Industries - Key offerings
Saudi Basic Industries - Segment focus
SWOT

15.14 Sinopec Shanghai Co. Ltd.

Sinopec Shanghai Co. Ltd. - Overview
Sinopec Shanghai Co. Ltd. - Business segments
Sinopec Shanghai Co. Ltd. - Key offerings
Sinopec Shanghai Co. Ltd. - Segment focus
SWOT

15.15 SK geo centric Co Ltd

SK geo centric Co Ltd - Overview
SK geo centric Co Ltd - Product / Service
SK geo centric Co Ltd - Key offerings
SWOT

15.16 SOCAR Turkiye Enerji A.S.

SOCAR Turkiye Enerji A.S. - Overview
SOCAR Turkiye Enerji A.S. - Product / Service
SOCAR Turkiye Enerji A.S. - Key offerings
SWOT

15.17 Taekwang Industrial Co. Ltd.

Taekwang Industrial Co. Ltd. - Overview
Taekwang Industrial Co. Ltd. - Product / Service
Taekwang Industrial Co. Ltd. - Key offerings
SWOT

15.18 The Mitsubishi Chemical Group

The Mitsubishi Chemical Group - Overview
The Mitsubishi Chemical Group - Business segments
The Mitsubishi Chemical Group - Key news
The Mitsubishi Chemical Group - Key offerings
The Mitsubishi Chemical Group - Segment focus
SWOT

16. Appendix

16.1 Scope of the report

Market definition
Objectives
Notes and caveats

16.2 Inclusions and exclusions checklist

Inclusions checklist
Exclusions checklist

16.3 Currency conversion rates for US$

16.4 Research methodology

16.5 Data procurement

Information sources

16.6 Data validation

16.7 Validation techniques employed for market sizing

16.8 Data synthesis

16.9 360 degree market analysis

16.10 List of abbreviations

Research Methodology

Technavio presents a detailed picture of the market by way of study, synthesis, and summation of data from multiple sources. The analysts have presented the various facets of the market with a particular focus on identifying the key industry influencers. The data thus presented is comprehensive, reliable, and the result of extensive research, both primary and secondary.

INFORMATION SOURCES

Primary sources

  • Manufacturers and suppliers
  • Channel partners
  • Industry experts
  • Strategic decision makers

Secondary sources

  • Industry journals and periodicals
  • Government data
  • Financial reports of key industry players
  • Historical data
  • Press releases

DATA ANALYSIS

Data Synthesis

  • Collation of data
  • Estimation of key figures
  • Analysis of derived insights

Data Validation

  • Triangulation with data models
  • Reference against proprietary databases
  • Corroboration with industry experts

REPORT WRITING

Qualitative

  • Market drivers
  • Market challenges
  • Market trends
  • Five forces analysis

Quantitative

  • Market size and forecast
  • Market segmentation
  • Geographical insights
  • Competitive landscape

Interested in this report?

Get your sample now to see our research methodology and insights!

Download Now

Frequently Asked Questions

Purified Terephthalic Acid (PTA) market growth will increase by USD 19728.5 million during 2026-2030.

The Purified Terephthalic Acid (PTA) market is expected to grow at a CAGR of 5.3% during 2026-2030.

Purified Terephthalic Acid (PTA) market is segmented by Application (Polyester fiber, PET resins, Films, Others) End-user (Textile, PET bottles, Packaging) Technology (PX oxidation, Bio-based PTA, Chemical recycling-based PTA)

Alpek SAB de CV, Formosa Chemicals and Fibre Corp, Hanwha Impact Corp, Hengli Petrochemical Co. Ltd, Hengyi Petrochemical Co. Ltd., Indian Oil Corp. Ltd., Indorama Ventures Public Co., INEOS Group Holdings S.A., Lotte Chemical Corp., MCPI Pvt Ltd, Mitsui Chemicals Inc., PTT Global Chemical Public Co., Reliance Industries Ltd., Saudi Basic Industries, Sinopec Shanghai Co. Ltd., SK geo centric Co Ltd, SOCAR Turkiye Enerji A.S., Taekwang Industrial Co. Ltd., The Mitsubishi Chemical Group, Tongkun Group Co. Ltd. are a few of the key vendors in the Purified Terephthalic Acid (PTA) market.

APAC will register the highest growth rate of 59% among the other regions. Therefore, the Purified Terephthalic Acid (PTA) market in APAC is expected to garner significant business opportunities for the vendors during the forecast period.

China, India, Japan, South Korea, Indonesia, Australia, US, Mexico, Canada, Germany, UK, France, Italy, Spain, The Netherlands, Brazil, Argentina, Chile, Saudi Arabia, UAE, South Africa, Turkey, Israel

  • Increasing demand for polyester fibers in textile industry is the driving factor this market.

The Purified Terephthalic Acid (PTA) market vendors should focus on grabbing business opportunities from the Application segment as it accounted for the largest market share in the base year.
RIA - Research AI Assistant
Ask RIA