Quantum Computing For AI Market Analysis, Size, and Forecast 2026-2030: North America (US, Canada, and Mexico), APAC (China, Japan, and South Korea), Europe (Germany, UK, and France), South America (Brazil and Argentina), Middle East and Africa (Saudi Arabia, UAE, and South Africa), and Rest of World (ROW)

Quantum Computing For AI Market Analysis, Size, and Forecast 2026-2030:
North America (US, Canada, and Mexico), APAC (China, Japan, and South Korea), Europe (Germany, UK, and France), South America (Brazil and Argentina), Middle East and Africa (Saudi Arabia, UAE, and South Africa), and Rest of World (ROW)

Published: Apr 2026 314 Pages SKU: IRTNTR80659

Market Overview at a Glance

$728.6 Mn
Market Opportunity
33.9%
CAGR 2025 - 2030
37.5%
North America Growth
$82.7 Mn
Superconducting qubits segment 2024

Quantum Computing For AI Market Size 2026-2030

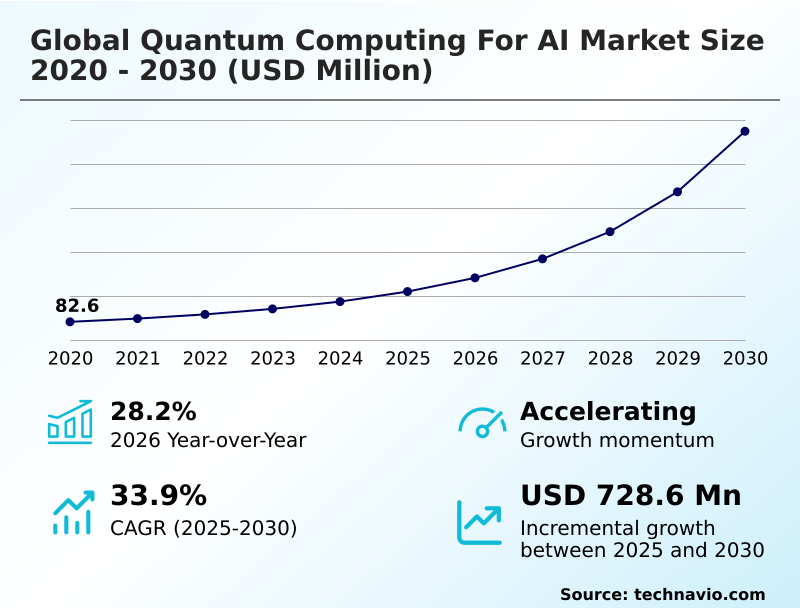
The quantum computing for ai market size is valued to increase by USD 728.6 million, at a CAGR of 33.9% from 2025 to 2030. Exponential growth in AI model complexity and training demands will drive the quantum computing for ai market.

Major Market Trends & Insights

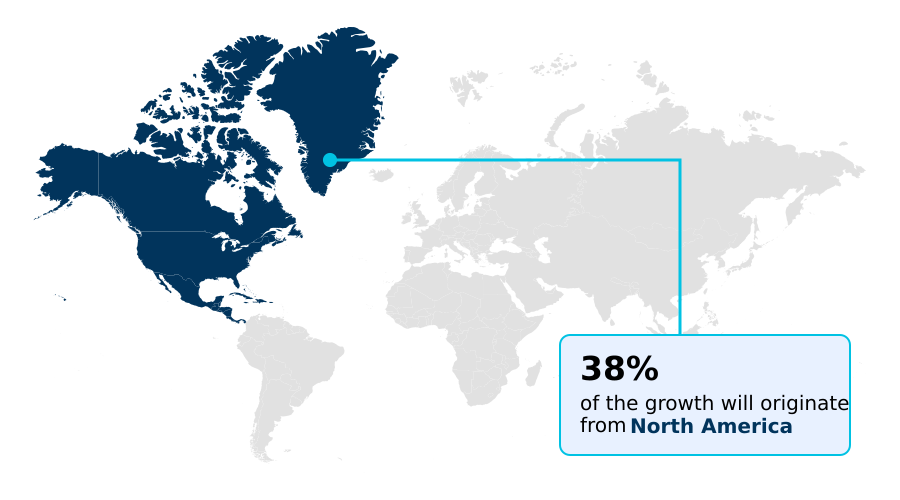
  • North America dominated the market and accounted for a 37.5% growth during the forecast period.
  • By Technology - Superconducting qubits segment was valued at USD 82.7 million in 2024
  • By Deployment - On-premises segment accounted for the largest market revenue share in 2024

Market Size & Forecast

  • Market Opportunities: USD 866.2 million
  • Market Future Opportunities: USD 728.6 million
  • CAGR from 2025 to 2030 : 33.9%

Market Summary

  • The quantum computing for AI market represents a convergence of quantum information science and machine learning, created to overcome the limitations of classical computing. This field uses the principles of superposition and entanglement to accelerate complex multidimensional calculations, enhancing pattern recognition and optimizing immense datasets.
  • A primary driver is the need to reduce the time and energy required for deep learning tasks that strain traditional high-performance computing resources. For instance, in financial services, quantum-enhanced models can analyze thousands of real-time variables to perform risk modeling with a precision that classical systems cannot match, improving portfolio outcomes.
  • This technology provides a foundational platform for next-generation intelligence, offering a transformative tool for innovation. The development of hybrid quantum-classical systems is a key focus, allowing businesses to solve previously intractable problems in areas such as generative chemistry and logistics optimization.
  • As data processing demands intensify, this market provides a strategic advantage for a data-centric global economy, pushing the boundaries of computational science and enterprise capabilities.

What will be the Size of the Quantum Computing For AI Market during the forecast period?

Get Key Insights on Market Forecast (PDF) Get Free Sample

How is the Quantum Computing For AI Market Segmented?

The quantum computing for ai industry research report provides comprehensive data (region-wise segment analysis), with forecasts and estimates in "USD million" for the period 2026-2030, as well as historical data from 2020-2024 for the following segments.
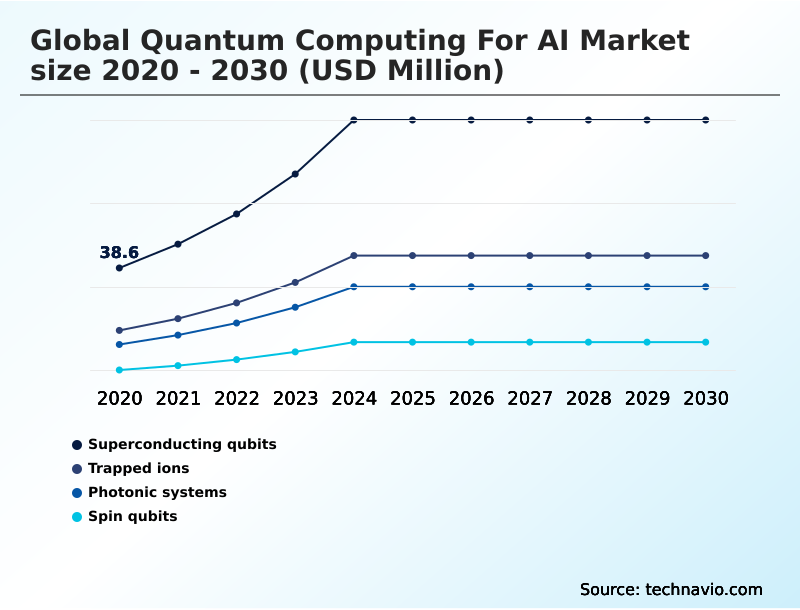
  • Technology
    • Superconducting qubits
    • Trapped ions
    • Photonic systems
    • Spin qubits
  • Deployment
    • On-premises
    • Cloud-based
  • End-user
    • Healthcare and life sciences
    • BFSI
    • Automotive and aerospace
    • Defense and security
    • Energy
  • Geography
    • North America
      • US
      • Canada
      • Mexico
    • APAC
      • China
      • Japan
      • South Korea
    • Europe
      • Germany
      • UK
      • France
    • South America
      • Brazil
      • Argentina
    • Middle East and Africa
      • Saudi Arabia
      • UAE
      • South Africa
    • Rest of World (ROW)

By Technology Insights

The superconducting qubits segment is estimated to witness significant growth during the forecast period.

The quantum computing for AI market is advancing through diverse hardware modalities, each with distinct operational characteristics.

A critical focus is on developing a quantum-native algorithm, supported by a robust quantum software development kit, to harness the full potential of these systems.

Key technologies include those based on the quantum fourier transform and grover's algorithm, which are foundational for quantum-enhanced AI. Significant quantum AI research is also dedicated to improving the variational quantum eigensolver for optimization tasks.

Advances in quantum random access memory and the precise execution of a quantum gate are essential for increasing qubit coherence time.

This progress is enabling firms to achieve a 15% increase in quantum sensing fidelity, directly impacting the precision of complex simulations.

Get Free Sample

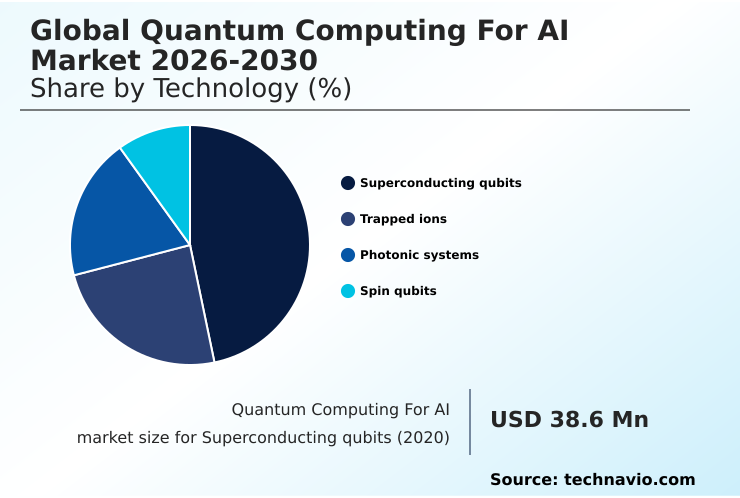
The Superconducting qubits segment was valued at USD 82.7 million in 2024 and showed a gradual increase during the forecast period.

Get Free Sample

Regional Analysis

North America is estimated to contribute 37.5% to the growth of the global market during the forecast period.Technavio’s analysts have elaborately explained the regional trends and drivers that shape the market during the forecast period.

See How Quantum Computing For AI Market Demand is Rising in North America Get Free Sample

The geographic landscape is defined by North America's leadership and rapid expansion in APAC. North America, accounting for 37.47% of incremental growth, benefits from a mature ecosystem combining private investment with government initiatives.

This has spurred advancements in quantum simulation and quantum machine learning. Firms in this region leverage quantum-inspired optimization techniques, which have shown up to a 20% improvement in logistics planning.

Meanwhile, APAC is the fastest-growing region, driven by national strategies in countries like China and Japan focused on achieving quantum advantage. The focus here is on developing both hardware, such as silicon-spin qubits, and software to achieve quantum supremacy.

This competitive dynamic is accelerating progress in areas like cryogenic control electronics and quantum-enhanced machine learning, fostering a global race for technological dominance and reshaping high-performance computing.

Market Dynamics

Our researchers analyzed the data with 2025 as the base year, along with the key drivers, trends, and challenges. A holistic analysis of drivers will help companies refine their marketing strategies to gain a competitive advantage.

  • The successful deployment of quantum computing in AI hinges on several interconnected technical milestones. Central to this is effective quantum machine learning library integration, which allows data scientists to leverage these new systems without deep expertise in quantum physics.
  • The refinement of hybrid classical-quantum algorithm design is critical for practical, near-term applications, enabling businesses to solve complex optimization problem solving tasks that are intractable for classical machines alone. To validate performance, standardized quantum processor performance benchmarking is essential, providing a clear measure of progress and guiding hardware improvements.
  • A key objective for many industries is AI model training time reduction, which promises to accelerate innovation cycles significantly. For applications in finance and logistics, the capability for real-time quantum data processing is a transformative goal. Concurrently, the development and quantum-resistant cryptography implementation are paramount for securing information in a post-quantum world.
  • Enterprises are also exploring large-scale neural network training for more sophisticated AI models. This requires advancements in quantum circuit design and synthesis, managed through a robust quantum hardware abstraction layer. These technologies are applied to tasks like quantum-enhanced predictive analytics modeling and quantum generative adversarial networks.
  • Progress in AI-driven quantum error mitigation, molecular simulation for drug discovery, and quantum financial risk modeling is notable. Furthermore, applying a quantum algorithm for logistics optimization, enhancing autonomous vehicle navigation systems, simulating quantum battery technology, and enabling advanced materials science discovery are all active areas of development.
  • The rollout of a quantum-safe communication network deployment shows a more than threefold increase in secure data transmission tests, highlighting the growing maturity of the ecosystem.

What are the key market drivers leading to the rise in the adoption of Quantum Computing For AI Industry?

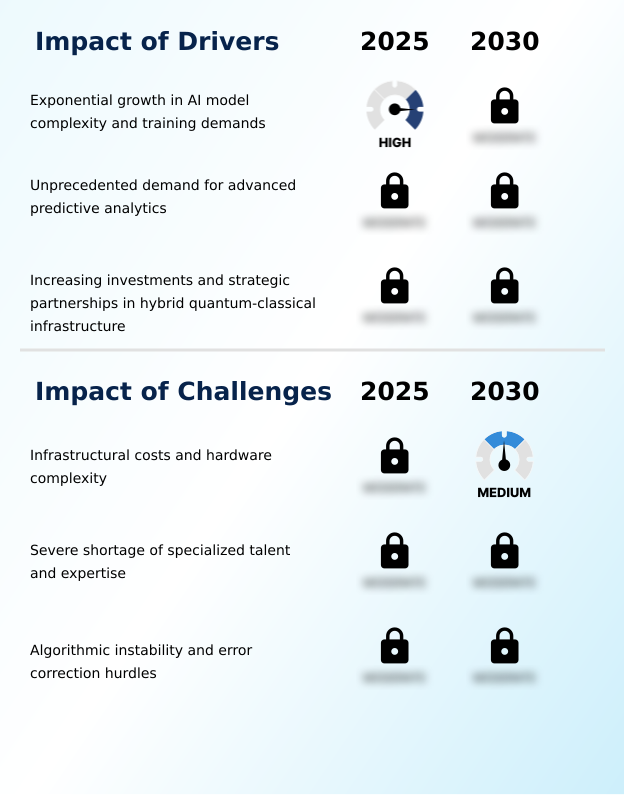
  • The exponential growth in AI model complexity and its associated training demands is a key driver for the market.

  • A primary driver for the market is the escalating demand from industries requiring sophisticated predictive modeling. The development of hybrid quantum-classical systems, delivered via quantum-as-a-service platforms, is making this technology more accessible.
  • This accessibility is fueled by specialized quantum middleware that simplifies the use of quantum support vector machines for deep learning network optimization. In logistics, this has led to a 20% improvement in global supply chain management efficiency.
  • However, qubit instability remains a challenge, pushing the industry toward noisy intermediate-scale quantum solutions that can still provide value. The goal of fault-tolerant quantum computing is driving a computational paradigm shift, encouraging the development of quantum-native machine learning.
  • This strategic shift is paving the way for applications in generative chemistry and the creation of quantum-centric supercomputing architectures.

What are the market trends shaping the Quantum Computing For AI Industry?

  • The exponential growth in machine learning workloads is creating a significant need for advanced computational paradigms. This requirement is emerging as a key upcoming trend shaping the market's trajectory.

  • The market is experiencing a significant trend driven by the increasing complexity of machine learning tasks, which pushes the limits of classical computing. This has spurred innovation across multiple hardware platforms, including superconducting qubits, trapped ions, photonic systems, and spin qubits. The development of advanced quantum error correction techniques is critical for enhancing the reliability of these systems.
  • As a result, quantum neural networks are becoming more viable for tackling complex computational workloads in high-dimensional data spaces. For instance, in the financial sector, these technologies are enabling algorithmic trading optimization with a 15% increase in strategy back-testing speed.
  • Similarly, for molecular interaction simulation in pharmaceuticals, the use of specialized quantum processing units has reduced calculation times by up to 30%, accelerating real-time risk assessments and early-stage drug discovery.

What challenges does the Quantum Computing For AI Industry face during its growth?

  • High infrastructural costs and significant hardware complexity present key challenges affecting the industry's growth.

  • Significant challenges persist, primarily related to hardware maturity and algorithmic stability. While the goal is quantum supremacy, current systems based on silicon-spin qubits and topological qubits are still prone to errors. This makes it difficult to achieve quantum advantage in practical applications like autonomous systems navigation. Developing a comprehensive quantum readiness strategy is therefore essential for enterprises.
  • The performance of quantum simulation and quantum annealing techniques is improving, with quantum-inspired optimization methods showing a 10% performance uplift on certain classical problems. However, the high cost of cryogenic control electronics remains a barrier.
  • The field of quantum machine learning faces hurdles in translating theoretical gains from a quantum algorithm into practical, quantum-enhanced machine learning workflows that consistently outperform classical methods by a significant margin, such as the 25% speedup seen in limited test cases.

Exclusive Technavio Analysis on Customer Landscape

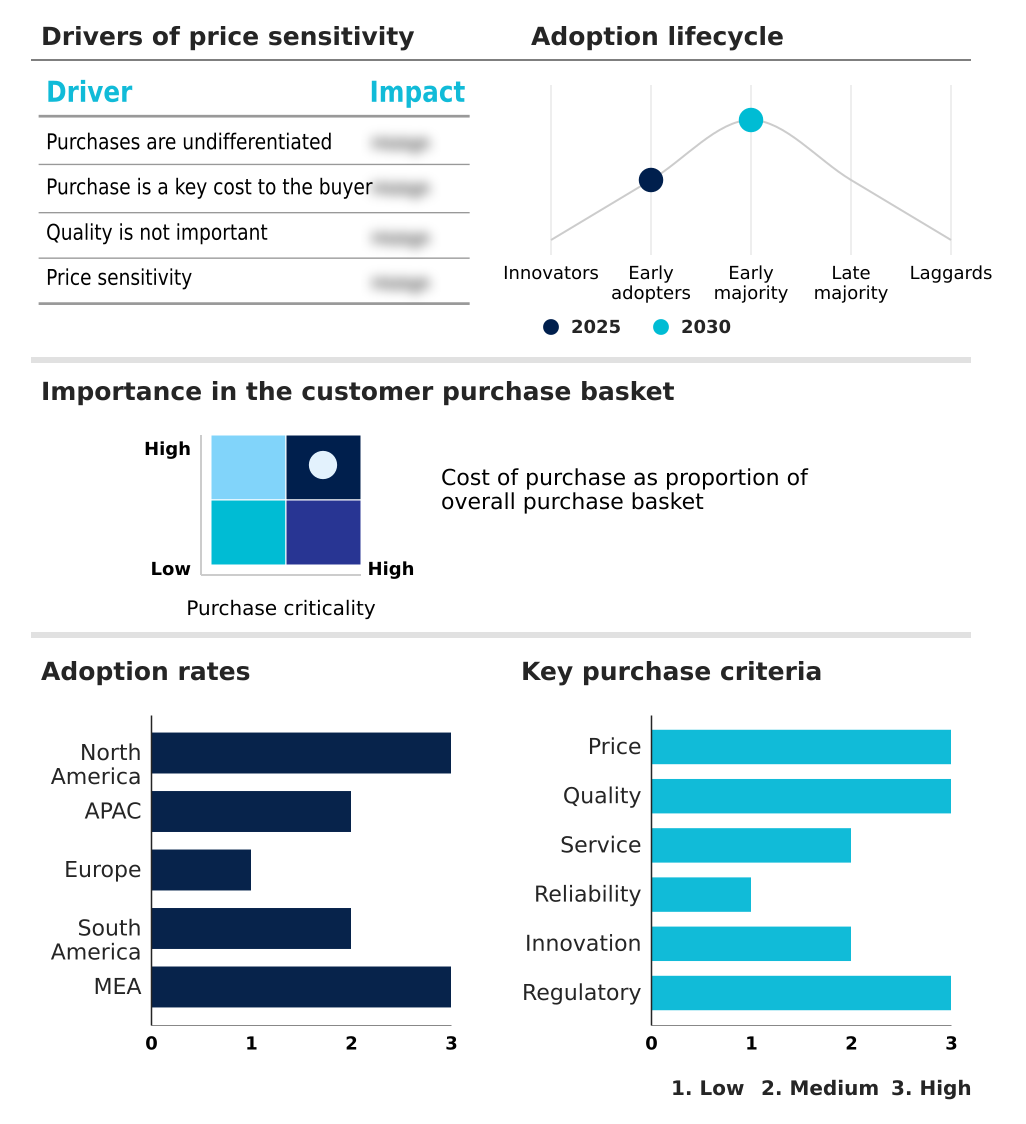
The quantum computing for ai market forecasting report includes the adoption lifecycle of the market, covering from the innovator’s stage to the laggard’s stage. It focuses on adoption rates in different regions based on penetration. Furthermore, the quantum computing for ai market report also includes key purchase criteria and drivers of price sensitivity to help companies evaluate and develop their market growth analysis strategies.

Customer Landscape of Quantum Computing For AI Industry

Competitive Landscape

Companies are implementing various strategies, such as strategic alliances, quantum computing for ai market forecast, partnerships, mergers and acquisitions, geographical expansion, and product/service launches, to enhance their presence in the industry.

Alibaba Group Holding Ltd. - Offerings include cloud-based quantum platforms and AI research solutions, enabling advanced enterprise modeling, complex computational analysis, and strategic research applications.

The industry research and growth report includes detailed analyses of the competitive landscape of the market and information about key companies, including:

  • Alibaba Group Holding Ltd.
  • Amazon Web Services Inc.
  • Atos SE
  • Baidu Inc.
  • Classiq Technologies
  • Fujitsu Ltd.
  • Google LLC
  • IBM Corp.
  • Intel Corp.
  • Microsoft Corp.
  • NEC Corp.
  • NVIDIA Corp.
  • Pasqal
  • PsiQuantum Corp.
  • QC Ware
  • QuEra Computing Inc.
  • Rigetti and Co. LLC
  • Tencent Holdings Ltd.
  • Toshiba Corp.
  • Xanadu Quantum Technologies Inc.

Qualitative and quantitative analysis of companies has been conducted to help clients understand the wider business environment as well as the strengths and weaknesses of key industry players. Data is qualitatively analyzed to categorize companies as pure play, category-focused, industry-focused, and diversified; it is quantitatively analyzed to categorize companies as dominant, leading, strong, tentative, and weak.

Recent Development and News in Quantum computing for ai market

  • In February 2025, Microsoft introduced its Majorana 1 quantum chip, leveraging a new Topological Core architecture to create more stable and error-resistant qubits.
  • In February 2025, Quantinuum announced a generative quantum AI framework designed to leverage unique quantum-generated data for training AI systems on complex commercial problems.
  • In February 2025, Socionext partnered with Google Quantum AI to develop next-generation quantum computing systems-on-chip, aiming for more powerful and scalable hardware.
  • In December 2024, Google introduced its next-generation quantum computing chip, Willow, which demonstrated a significant breakthrough in quantum error correction and computational performance.

Dive into Technavio’s robust research methodology, blending expert interviews, extensive data synthesis, and validated models for unparalleled Quantum Computing For AI Market insights. See full methodology.

Market Scope
Page number 314
Base year 2025
Historic period 2020-2024
Forecast period 2026-2030
Growth momentum & CAGR Accelerate at a CAGR of 33.9%
Market growth 2026-2030 USD 728.6 million
Market structure Fragmented
YoY growth 2025-2026(%) 28.2%
Key countries US, Canada, Mexico, China, Japan, South Korea, India, Australia, Indonesia, Germany, UK, France, Italy, Spain, The Netherlands, Brazil, Argentina, Chile, Saudi Arabia, UAE, South Africa, Israel and Turkey
Competitive landscape Leading Companies, Market Positioning of Companies, Competitive Strategies, and Industry Risks

Request Free Sample

Research Analyst Overview

  • The quantum computing for AI market is a landscape of intense innovation, where strategic boardroom decisions on technology adoption are becoming critical for long-term competitiveness. The development of a functional logical qubit from numerous physical qubits through advanced quantum error correction is a central focus.
  • The field is progressing beyond noisy intermediate-scale quantum systems toward fault-tolerant quantum computing, a shift necessary for achieving true quantum supremacy. Different hardware approaches are being pursued, including superconducting qubits, trapped ions, photonic systems, spin qubits, and topological qubits, each with unique tradeoffs in qubit fidelity.
  • The integration of quantum processing units and quantum coprocessors into hybrid quantum-classical architectures is now standard, often delivered through quantum-as-a-service platforms with specialized quantum middleware. This enables the use of quantum machine learning techniques like quantum neural networks and quantum support vector machines. Progress is measured by metrics such as quantum volume, while quantum state tomography validates system performance.
  • Foundational tools like the quantum fourier transform, grover's algorithm, and shor's algorithm are being incorporated into quantum algorithm development, supported by quantum random access memory and precise quantum gate operations. The industry's focus on quantum simulation and quantum annealing for optimization is delivering tangible results, with some users reporting a 25% improvement in solution accuracy for specific problems.
  • The development of the variational quantum eigensolver and other quantum-enhanced AI methods, alongside quantum key distribution and the neutral atom quantum computer, solidifies the technology's strategic importance.

What are the Key Data Covered in this Quantum Computing For AI Market Research and Growth Report?

  • What is the expected growth of the Quantum Computing For AI Market between 2026 and 2030?

    • USD 728.6 million, at a CAGR of 33.9%

  • What segmentation does the market report cover?

    • The report is segmented by Technology (Superconducting qubits, Trapped ions, Photonic systems, and Spin qubits), Deployment (On-premises, and Cloud-based), End-user (Healthcare and life sciences, BFSI, Automotive and aerospace, Defense and security, and Energy) and Geography (North America, APAC, Europe, South America, Middle East and Africa)

  • Which regions are analyzed in the report?

    • North America, APAC, Europe, South America and Middle East and Africa

  • What are the key growth drivers and market challenges?

    • Exponential growth in AI model complexity and training demands, Infrastructural costs and hardware complexity

  • Who are the major players in the Quantum Computing For AI Market?

    • Alibaba Group Holding Ltd., Amazon Web Services Inc., Atos SE, Baidu Inc., Classiq Technologies, Fujitsu Ltd., Google LLC, IBM Corp., Intel Corp., Microsoft Corp., NEC Corp., NVIDIA Corp., Pasqal, PsiQuantum Corp., QC Ware, QuEra Computing Inc., Rigetti and Co. LLC, Tencent Holdings Ltd., Toshiba Corp. and Xanadu Quantum Technologies Inc.

Market Research Insights

  • The market is shaped by a dynamic interplay between hardware innovation and algorithmic development. The push toward a computational paradigm shift is evident, with organizations adopting a quantum readiness strategy to prepare for future disruption. This evolution enables new applications in areas like generative chemistry and autonomous systems navigation.
  • The adoption of these technologies has led to a 25% improvement in the efficiency of certain optimization tasks. Furthermore, hybrid models have demonstrated the potential to reduce model training times by up to 40% in specific use cases, offering a significant competitive advantage.
  • As a result, companies are re-evaluating their long-term IT infrastructure investments to align with these emerging capabilities, with early adopters reporting a 15% better return on their advanced analytics projects.

We can help! Our analysts can customize this quantum computing for ai market research report to meet your requirements.

Get in touch

1. Executive Summary

1.1 Market overview

Executive Summary - Chart on Market Overview
Executive Summary - Data Table on Market Overview
Executive Summary - Chart on Global Market Characteristics
Executive Summary - Chart on Market by Geography
Executive Summary - Chart on Market Segmentation by Technology
Executive Summary - Chart on Market Segmentation by Deployment
Executive Summary - Chart on Market Segmentation by End-user
Executive Summary - Chart on Incremental Growth
Executive Summary - Data Table on Incremental Growth
Executive Summary - Chart on Company Market Positioning

2. Technavio Analysis

2.1 Analysis of price sensitivity, lifecycle, customer purchase basket, adoption rates, and purchase criteria

2.2 Criticality of inputs and Factors of differentiation

Chart on Overview on criticality of inputs and factors of differentiation

2.3 Factors of disruption

Chart on Overview on factors of disruption

2.4 Impact of drivers and challenges

Chart on Impact of drivers and challenges in 2025 and 2030

3. Market Landscape

3.1 Market ecosystem

Chart on Parent Market
Data Table on - Parent Market

3.2 Market characteristics

Chart on Market characteristics analysis

3.3 Value chain analysis

Chart on Value chain analysis

4. Market Sizing

4.1 Market definition

Data Table on Offerings of companies included in the market definition

4.2 Market segment analysis

Market segments

4.3 Market size 2025

4.4 Market outlook: Forecast for 2025-2030

Chart on Global - Market size and forecast 2025-2030 ($ million)
Data Table on Global - Market size and forecast 2025-2030 ($ million)
Chart on Global Market: Year-over-year growth 2025-2030 (%)
Data Table on Global Market: Year-over-year growth 2025-2030 (%)

5. Historic Market Size

5.1 Global Quantum Computing For AI Market 2020 - 2024

Historic Market Size - Data Table on Global Quantum Computing For AI Market 2020 - 2024 ($ million)

5.2 Technology segment analysis 2020 - 2024

Historic Market Size - Technology Segment 2020 - 2024 ($ million)

5.3 Deployment segment analysis 2020 - 2024

Historic Market Size - Deployment Segment 2020 - 2024 ($ million)

5.4 End-user segment analysis 2020 - 2024

Historic Market Size - End-user Segment 2020 - 2024 ($ million)

5.5 Geography segment analysis 2020 - 2024

Historic Market Size - Geography Segment 2020 - 2024 ($ million)

5.6 Country segment analysis 2020 - 2024

Historic Market Size - Country Segment 2020 - 2024 ($ million)

6. Qualitative Analysis

6.1 Impact of AI in Global Quantum Computing for AI Market

6.2 Impact of Geopolitical Conflict for Global Quantum Computing for AI Market

7. Five Forces Analysis

7.1 Five forces summary

Five forces analysis - Comparison between 2025 and 2030

7.2 Bargaining power of buyers

Bargaining power of buyers - Impact of key factors 2025 and 2030

7.3 Bargaining power of suppliers

Bargaining power of suppliers - Impact of key factors in 2025 and 2030

7.4 Threat of new entrants

Threat of new entrants - Impact of key factors in 2025 and 2030

7.5 Threat of substitutes

Threat of substitutes - Impact of key factors in 2025 and 2030

7.6 Threat of rivalry

Threat of rivalry - Impact of key factors in 2025 and 2030

7.7 Market condition

Chart on Market condition - Five forces 2025 and 2030

8. Market Segmentation by Technology

8.1 Market segments

Chart on Technology - Market share 2025-2030 (%)
Data Table on Technology - Market share 2025-2030 (%)

8.2 Comparison by Technology

Chart on Comparison by Technology
Data Table on Comparison by Technology

8.3 Superconducting qubits - Market size and forecast 2025-2030

Chart on Superconducting qubits - Market size and forecast 2025-2030 ($ million)
Data Table on Superconducting qubits - Market size and forecast 2025-2030 ($ million)
Chart on Superconducting qubits - Year-over-year growth 2025-2030 (%)
Data Table on Superconducting qubits - Year-over-year growth 2025-2030 (%)

8.4 Trapped ions - Market size and forecast 2025-2030

Chart on Trapped ions - Market size and forecast 2025-2030 ($ million)
Data Table on Trapped ions - Market size and forecast 2025-2030 ($ million)
Chart on Trapped ions - Year-over-year growth 2025-2030 (%)
Data Table on Trapped ions - Year-over-year growth 2025-2030 (%)

8.5 Photonic systems - Market size and forecast 2025-2030

Chart on Photonic systems - Market size and forecast 2025-2030 ($ million)
Data Table on Photonic systems - Market size and forecast 2025-2030 ($ million)
Chart on Photonic systems - Year-over-year growth 2025-2030 (%)
Data Table on Photonic systems - Year-over-year growth 2025-2030 (%)

8.6 Spin qubits - Market size and forecast 2025-2030

Chart on Spin qubits - Market size and forecast 2025-2030 ($ million)
Data Table on Spin qubits - Market size and forecast 2025-2030 ($ million)
Chart on Spin qubits - Year-over-year growth 2025-2030 (%)
Data Table on Spin qubits - Year-over-year growth 2025-2030 (%)

8.7 Market opportunity by Technology

Market opportunity by Technology ($ million)
Data Table on Market opportunity by Technology ($ million)

9. Market Segmentation by Deployment

9.1 Market segments

Chart on Deployment - Market share 2025-2030 (%)
Data Table on Deployment - Market share 2025-2030 (%)

9.2 Comparison by Deployment

Chart on Comparison by Deployment
Data Table on Comparison by Deployment

9.3 On-premises - Market size and forecast 2025-2030

Chart on On-premises - Market size and forecast 2025-2030 ($ million)
Data Table on On-premises - Market size and forecast 2025-2030 ($ million)
Chart on On-premises - Year-over-year growth 2025-2030 (%)
Data Table on On-premises - Year-over-year growth 2025-2030 (%)

9.4 Cloud-based - Market size and forecast 2025-2030

Chart on Cloud-based - Market size and forecast 2025-2030 ($ million)
Data Table on Cloud-based - Market size and forecast 2025-2030 ($ million)
Chart on Cloud-based - Year-over-year growth 2025-2030 (%)
Data Table on Cloud-based - Year-over-year growth 2025-2030 (%)

9.5 Market opportunity by Deployment

Market opportunity by Deployment ($ million)
Data Table on Market opportunity by Deployment ($ million)

10. Market Segmentation by End-user

10.1 Market segments

Chart on End-user - Market share 2025-2030 (%)
Data Table on End-user - Market share 2025-2030 (%)

10.2 Comparison by End-user

Chart on Comparison by End-user
Data Table on Comparison by End-user

10.3 Healthcare and life sciences - Market size and forecast 2025-2030

Chart on Healthcare and life sciences - Market size and forecast 2025-2030 ($ million)
Data Table on Healthcare and life sciences - Market size and forecast 2025-2030 ($ million)
Chart on Healthcare and life sciences - Year-over-year growth 2025-2030 (%)
Data Table on Healthcare and life sciences - Year-over-year growth 2025-2030 (%)

10.4 BFSI - Market size and forecast 2025-2030

Chart on BFSI - Market size and forecast 2025-2030 ($ million)
Data Table on BFSI - Market size and forecast 2025-2030 ($ million)
Chart on BFSI - Year-over-year growth 2025-2030 (%)
Data Table on BFSI - Year-over-year growth 2025-2030 (%)

10.5 Automotive and aerospace - Market size and forecast 2025-2030

Chart on Automotive and aerospace - Market size and forecast 2025-2030 ($ million)
Data Table on Automotive and aerospace - Market size and forecast 2025-2030 ($ million)
Chart on Automotive and aerospace - Year-over-year growth 2025-2030 (%)
Data Table on Automotive and aerospace - Year-over-year growth 2025-2030 (%)

10.6 Defense and security - Market size and forecast 2025-2030

Chart on Defense and security - Market size and forecast 2025-2030 ($ million)
Data Table on Defense and security - Market size and forecast 2025-2030 ($ million)
Chart on Defense and security - Year-over-year growth 2025-2030 (%)
Data Table on Defense and security - Year-over-year growth 2025-2030 (%)

10.7 Energy - Market size and forecast 2025-2030

Chart on Energy - Market size and forecast 2025-2030 ($ million)
Data Table on Energy - Market size and forecast 2025-2030 ($ million)
Chart on Energy - Year-over-year growth 2025-2030 (%)
Data Table on Energy - Year-over-year growth 2025-2030 (%)

10.8 Market opportunity by End-user

Market opportunity by End-user ($ million)
Data Table on Market opportunity by End-user ($ million)

11. Customer Landscape

11.1 Customer landscape overview

Analysis of price sensitivity, lifecycle, customer purchase basket, adoption rates, and purchase criteria

12. Geographic Landscape

12.1 Geographic segmentation

Chart on Market share by geography 2025-2030 (%)
Data Table on Market share by geography 2025-2030 (%)

12.2 Geographic comparison

Chart on Geographic comparison
Data Table on Geographic comparison

12.3 North America - Market size and forecast 2025-2030

Chart on North America - Market size and forecast 2025-2030 ($ million)
Data Table on North America - Market size and forecast 2025-2030 ($ million)
Chart on North America - Year-over-year growth 2025-2030 (%)
Data Table on North America - Year-over-year growth 2025-2030 (%)
Chart on Regional Comparison - North America
Data Table on Regional Comparison - North America

12.3.1 US - Market size and forecast 2025-2030

Chart on US - Market size and forecast 2025-2030 ($ million)
Data Table on US - Market size and forecast 2025-2030 ($ million)
Chart on US - Year-over-year growth 2025-2030 (%)
Data Table on US - Year-over-year growth 2025-2030 (%)

12.3.2 Canada - Market size and forecast 2025-2030

Chart on Canada - Market size and forecast 2025-2030 ($ million)
Data Table on Canada - Market size and forecast 2025-2030 ($ million)
Chart on Canada - Year-over-year growth 2025-2030 (%)
Data Table on Canada - Year-over-year growth 2025-2030 (%)

12.3.3 Mexico - Market size and forecast 2025-2030

Chart on Mexico - Market size and forecast 2025-2030 ($ million)
Data Table on Mexico - Market size and forecast 2025-2030 ($ million)
Chart on Mexico - Year-over-year growth 2025-2030 (%)
Data Table on Mexico - Year-over-year growth 2025-2030 (%)

12.4 APAC - Market size and forecast 2025-2030

Chart on APAC - Market size and forecast 2025-2030 ($ million)
Data Table on APAC - Market size and forecast 2025-2030 ($ million)
Chart on APAC - Year-over-year growth 2025-2030 (%)
Data Table on APAC - Year-over-year growth 2025-2030 (%)
Chart on Regional Comparison - APAC
Data Table on Regional Comparison - APAC

12.4.1 China - Market size and forecast 2025-2030

Chart on China - Market size and forecast 2025-2030 ($ million)
Data Table on China - Market size and forecast 2025-2030 ($ million)
Chart on China - Year-over-year growth 2025-2030 (%)
Data Table on China - Year-over-year growth 2025-2030 (%)

12.4.2 Japan - Market size and forecast 2025-2030

Chart on Japan - Market size and forecast 2025-2030 ($ million)
Data Table on Japan - Market size and forecast 2025-2030 ($ million)
Chart on Japan - Year-over-year growth 2025-2030 (%)
Data Table on Japan - Year-over-year growth 2025-2030 (%)

12.4.3 South Korea - Market size and forecast 2025-2030

Chart on South Korea - Market size and forecast 2025-2030 ($ million)
Data Table on South Korea - Market size and forecast 2025-2030 ($ million)
Chart on South Korea - Year-over-year growth 2025-2030 (%)
Data Table on South Korea - Year-over-year growth 2025-2030 (%)

12.4.4 India - Market size and forecast 2025-2030

Chart on India - Market size and forecast 2025-2030 ($ million)
Data Table on India - Market size and forecast 2025-2030 ($ million)
Chart on India - Year-over-year growth 2025-2030 (%)
Data Table on India - Year-over-year growth 2025-2030 (%)

12.4.5 Australia - Market size and forecast 2025-2030

Chart on Australia - Market size and forecast 2025-2030 ($ million)
Data Table on Australia - Market size and forecast 2025-2030 ($ million)
Chart on Australia - Year-over-year growth 2025-2030 (%)
Data Table on Australia - Year-over-year growth 2025-2030 (%)

12.4.6 Indonesia - Market size and forecast 2025-2030

Chart on Indonesia - Market size and forecast 2025-2030 ($ million)
Data Table on Indonesia - Market size and forecast 2025-2030 ($ million)
Chart on Indonesia - Year-over-year growth 2025-2030 (%)
Data Table on Indonesia - Year-over-year growth 2025-2030 (%)

12.5 Europe - Market size and forecast 2025-2030

Chart on Europe - Market size and forecast 2025-2030 ($ million)
Data Table on Europe - Market size and forecast 2025-2030 ($ million)
Chart on Europe - Year-over-year growth 2025-2030 (%)
Data Table on Europe - Year-over-year growth 2025-2030 (%)
Chart on Regional Comparison - Europe
Data Table on Regional Comparison - Europe

12.5.1 Germany - Market size and forecast 2025-2030

Chart on Germany - Market size and forecast 2025-2030 ($ million)
Data Table on Germany - Market size and forecast 2025-2030 ($ million)
Chart on Germany - Year-over-year growth 2025-2030 (%)
Data Table on Germany - Year-over-year growth 2025-2030 (%)

12.5.2 UK - Market size and forecast 2025-2030

Chart on UK - Market size and forecast 2025-2030 ($ million)
Data Table on UK - Market size and forecast 2025-2030 ($ million)
Chart on UK - Year-over-year growth 2025-2030 (%)
Data Table on UK - Year-over-year growth 2025-2030 (%)

12.5.3 France - Market size and forecast 2025-2030

Chart on France - Market size and forecast 2025-2030 ($ million)
Data Table on France - Market size and forecast 2025-2030 ($ million)
Chart on France - Year-over-year growth 2025-2030 (%)
Data Table on France - Year-over-year growth 2025-2030 (%)

12.5.4 Italy - Market size and forecast 2025-2030

Chart on Italy - Market size and forecast 2025-2030 ($ million)
Data Table on Italy - Market size and forecast 2025-2030 ($ million)
Chart on Italy - Year-over-year growth 2025-2030 (%)
Data Table on Italy - Year-over-year growth 2025-2030 (%)

12.5.5 Spain - Market size and forecast 2025-2030

Chart on Spain - Market size and forecast 2025-2030 ($ million)
Data Table on Spain - Market size and forecast 2025-2030 ($ million)
Chart on Spain - Year-over-year growth 2025-2030 (%)
Data Table on Spain - Year-over-year growth 2025-2030 (%)

12.5.6 The Netherlands - Market size and forecast 2025-2030

Chart on The Netherlands - Market size and forecast 2025-2030 ($ million)
Data Table on The Netherlands - Market size and forecast 2025-2030 ($ million)
Chart on The Netherlands - Year-over-year growth 2025-2030 (%)
Data Table on The Netherlands - Year-over-year growth 2025-2030 (%)

12.6 South America - Market size and forecast 2025-2030

Chart on South America - Market size and forecast 2025-2030 ($ million)
Data Table on South America - Market size and forecast 2025-2030 ($ million)
Chart on South America - Year-over-year growth 2025-2030 (%)
Data Table on South America - Year-over-year growth 2025-2030 (%)
Chart on Regional Comparison - South America
Data Table on Regional Comparison - South America

12.6.1 Brazil - Market size and forecast 2025-2030

Chart on Brazil - Market size and forecast 2025-2030 ($ million)
Data Table on Brazil - Market size and forecast 2025-2030 ($ million)
Chart on Brazil - Year-over-year growth 2025-2030 (%)
Data Table on Brazil - Year-over-year growth 2025-2030 (%)

12.6.2 Argentina - Market size and forecast 2025-2030

Chart on Argentina - Market size and forecast 2025-2030 ($ million)
Data Table on Argentina - Market size and forecast 2025-2030 ($ million)
Chart on Argentina - Year-over-year growth 2025-2030 (%)
Data Table on Argentina - Year-over-year growth 2025-2030 (%)

12.6.3 Chile - Market size and forecast 2025-2030

Chart on Chile - Market size and forecast 2025-2030 ($ million)
Data Table on Chile - Market size and forecast 2025-2030 ($ million)
Chart on Chile - Year-over-year growth 2025-2030 (%)
Data Table on Chile - Year-over-year growth 2025-2030 (%)

12.7 Middle East and Africa - Market size and forecast 2025-2030

Chart on Middle East and Africa - Market size and forecast 2025-2030 ($ million)
Data Table on Middle East and Africa - Market size and forecast 2025-2030 ($ million)
Chart on Middle East and Africa - Year-over-year growth 2025-2030 (%)
Data Table on Middle East and Africa - Year-over-year growth 2025-2030 (%)
Chart on Regional Comparison - Middle East and Africa
Data Table on Regional Comparison - Middle East and Africa

12.7.1 Saudi Arabia - Market size and forecast 2025-2030

Chart on Saudi Arabia - Market size and forecast 2025-2030 ($ million)
Data Table on Saudi Arabia - Market size and forecast 2025-2030 ($ million)
Chart on Saudi Arabia - Year-over-year growth 2025-2030 (%)
Data Table on Saudi Arabia - Year-over-year growth 2025-2030 (%)

12.7.2 UAE - Market size and forecast 2025-2030

Chart on UAE - Market size and forecast 2025-2030 ($ million)
Data Table on UAE - Market size and forecast 2025-2030 ($ million)
Chart on UAE - Year-over-year growth 2025-2030 (%)
Data Table on UAE - Year-over-year growth 2025-2030 (%)

12.7.3 South Africa - Market size and forecast 2025-2030

Chart on South Africa - Market size and forecast 2025-2030 ($ million)
Data Table on South Africa - Market size and forecast 2025-2030 ($ million)
Chart on South Africa - Year-over-year growth 2025-2030 (%)
Data Table on South Africa - Year-over-year growth 2025-2030 (%)

12.7.4 Israel - Market size and forecast 2025-2030

Chart on Israel - Market size and forecast 2025-2030 ($ million)
Data Table on Israel - Market size and forecast 2025-2030 ($ million)
Chart on Israel - Year-over-year growth 2025-2030 (%)
Data Table on Israel - Year-over-year growth 2025-2030 (%)

12.7.5 Turkey - Market size and forecast 2025-2030

Chart on Turkey - Market size and forecast 2025-2030 ($ million)
Data Table on Turkey - Market size and forecast 2025-2030 ($ million)
Chart on Turkey - Year-over-year growth 2025-2030 (%)
Data Table on Turkey - Year-over-year growth 2025-2030 (%)

12.8 Market opportunity by geography

Market opportunity by geography ($ million)
Data Tables on Market opportunity by geography ($ million)

13. Drivers, Challenges, and Opportunity

13.1 Market drivers

Exponential growth in AI model complexity and training demands
Unprecedented demand for advanced predictive analytics
Increasing investments and strategic partnerships in hybrid quantum-classical infrastructure

13.2 Market challenges

Infrastructural costs and hardware complexity
Severe shortage of specialized talent and expertise
Algorithmic instability and error correction hurdles

13.3 Impact of drivers and challenges

Impact of drivers and challenges in 2025 and 2030

13.4 Market opportunities

Exponential growth in ML workloads and need for advanced computational paradigms
Strategic synergies between government initiatives and private sector funding for quantum infrastructure
Innovations in hybrid algorithm development and quantum error correction methodologies

14. Competitive Landscape

14.1 Overview

14.2

Overview on criticality of inputs and factors of differentiation

14.3 Landscape disruption

Overview on factors of disruption

14.4 Industry risks

Impact of key risks on business

15. Competitive Analysis

15.1 Companies profiled

Companies covered

15.2 Company ranking index

15.3 Market positioning of companies

Matrix on companies position and classification

15.4 Alibaba Group Holding Ltd.

Alibaba Group Holding Ltd. - Overview
Alibaba Group Holding Ltd. - Business segments
Alibaba Group Holding Ltd. - Key offerings
Alibaba Group Holding Ltd. - Segment focus
SWOT

15.5 Amazon Web Services Inc.

Amazon Web Services Inc. - Overview
Amazon Web Services Inc. - Product / Service
Amazon Web Services Inc. - Key offerings
SWOT

15.6 Atos SE

Atos SE - Overview
Atos SE - Business segments
Atos SE - Key offerings
Atos SE - Segment focus
SWOT

15.7 Baidu Inc.

Baidu Inc. - Overview
Baidu Inc. - Business segments
Baidu Inc. - Key news
Baidu Inc. - Key offerings
Baidu Inc. - Segment focus
SWOT

15.8 Fujitsu Ltd.

Fujitsu Ltd. - Overview
Fujitsu Ltd. - Business segments
Fujitsu Ltd. - Key offerings
Fujitsu Ltd. - Segment focus
SWOT

15.9 Google LLC

Google LLC - Overview
Google LLC - Product / Service
Google LLC - Key offerings
SWOT

15.10 IBM Corp.

IBM Corp. - Overview
IBM Corp. - Business segments
IBM Corp. - Key news
IBM Corp. - Key offerings
IBM Corp. - Segment focus
SWOT

15.11 Intel Corp.

Intel Corp. - Overview
Intel Corp. - Business segments
Intel Corp. - Key news
Intel Corp. - Key offerings
Intel Corp. - Segment focus
SWOT

15.12 Microsoft Corp.

Microsoft Corp. - Overview
Microsoft Corp. - Business segments
Microsoft Corp. - Key news
Microsoft Corp. - Key offerings
Microsoft Corp. - Segment focus
SWOT

15.13 NEC Corp.

NEC Corp. - Overview
NEC Corp. - Business segments
NEC Corp. - Key offerings
NEC Corp. - Segment focus
SWOT

15.14 NVIDIA Corp.

NVIDIA Corp. - Overview
NVIDIA Corp. - Business segments
NVIDIA Corp. - Key news
NVIDIA Corp. - Key offerings
NVIDIA Corp. - Segment focus
SWOT

15.15 Rigetti and Co. LLC

Rigetti and Co. LLC - Overview
Rigetti and Co. LLC - Product / Service
Rigetti and Co. LLC - Key offerings
SWOT

15.16 Tencent Holdings Ltd.

Tencent Holdings Ltd. - Overview
Tencent Holdings Ltd. - Business segments
Tencent Holdings Ltd. - Key offerings
Tencent Holdings Ltd. - Segment focus
SWOT

15.17 Toshiba Corp.

Toshiba Corp. - Overview
Toshiba Corp. - Product / Service
Toshiba Corp. - Key offerings
SWOT

15.18 Xanadu Quantum Technologies Inc.

Xanadu Quantum Technologies Inc. - Overview
Xanadu Quantum Technologies Inc. - Product / Service
Xanadu Quantum Technologies Inc. - Key offerings
SWOT

16. Appendix

16.1 Scope of the report

Market definition
Objectives
Notes and caveats

16.2 Inclusions and exclusions checklist

Inclusions checklist
Exclusions checklist

16.3 Currency conversion rates for US$

16.4 Research methodology

16.5 Data procurement

Information sources

16.6 Data validation

16.7 Validation techniques employed for market sizing

16.8 Data synthesis

16.9 360 degree market analysis

16.10 List of abbreviations

Research Methodology

Technavio presents a detailed picture of the market by way of study, synthesis, and summation of data from multiple sources. The analysts have presented the various facets of the market with a particular focus on identifying the key industry influencers. The data thus presented is comprehensive, reliable, and the result of extensive research, both primary and secondary.

INFORMATION SOURCES

Primary sources

  • Manufacturers and suppliers
  • Channel partners
  • Industry experts
  • Strategic decision makers

Secondary sources

  • Industry journals and periodicals
  • Government data
  • Financial reports of key industry players
  • Historical data
  • Press releases

DATA ANALYSIS

Data Synthesis

  • Collation of data
  • Estimation of key figures
  • Analysis of derived insights

Data Validation

  • Triangulation with data models
  • Reference against proprietary databases
  • Corroboration with industry experts

REPORT WRITING

Qualitative

  • Market drivers
  • Market challenges
  • Market trends
  • Five forces analysis

Quantitative

  • Market size and forecast
  • Market segmentation
  • Geographical insights
  • Competitive landscape

Interested in this report?

Get your sample now to see our research methodology and insights!

Download Now

Frequently Asked Questions

Quantum Computing For AI market growth will increase by USD 728.6 million during 2026-2030.

The Quantum Computing For AI market is expected to grow at a CAGR of 33.9% during 2026-2030.

Quantum Computing For AI market is segmented by Technology (Superconducting qubits, Trapped ions, Photonic systems, Spin qubits) Deployment (On-premises, Cloud-based) End-user (Healthcare and life sciences, BFSI, Automotive and aerospace, Defense and security, Energy)

Alibaba Group Holding Ltd., Amazon Web Services Inc., Atos SE, Baidu Inc., Classiq Technologies, Fujitsu Ltd., Google LLC, IBM Corp., Intel Corp., Microsoft Corp., NEC Corp., NVIDIA Corp., Pasqal, PsiQuantum Corp., QC Ware, QuEra Computing Inc., Rigetti and Co. LLC, Tencent Holdings Ltd., Toshiba Corp., Xanadu Quantum Technologies Inc. are a few of the key vendors in the Quantum Computing For AI market.

North America will register the highest growth rate of 37.5% among the other regions. Therefore, the Quantum Computing For AI market in North America is expected to garner significant business opportunities for the vendors during the forecast period.

US, Canada, Mexico, China, Japan, South Korea, India, Australia, Indonesia, Germany, UK, France, Italy, Spain, The Netherlands, Brazil, Argentina, Chile, Saudi Arabia, UAE, South Africa, Israel, Turkey

  • Exponential growth in AI model complexity and training demands is the driving factor this market.

The Quantum Computing For AI market vendors should focus on grabbing business opportunities from the Technology segment as it accounted for the largest market share in the base year.
RIA - Research AI Assistant
Ask RIA