Supercomputer Market Size 2026-2030
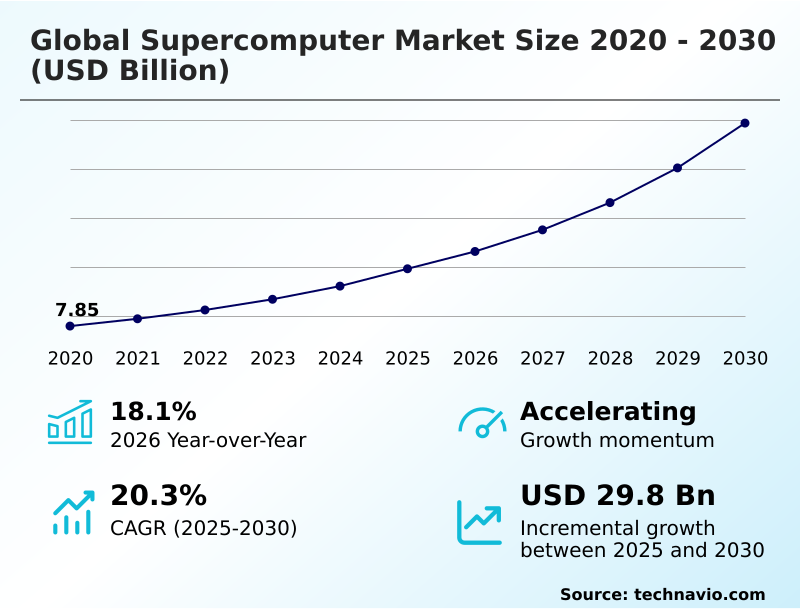
The supercomputer market size is valued to increase by USD 29.80 billion, at a CAGR of 20.3% from 2025 to 2030. Advancements in energy-efficient computing and sustainable infrastructure will drive the supercomputer market.
Major Market Trends & Insights
- APAC dominated the market and accounted for a 54.6% growth during the forecast period.
- By OS - Linux segment was valued at USD 14.81 billion in 2024
- By End-user - Government entities segment accounted for the largest market revenue share in 2024
Market Size & Forecast
- Market Opportunities: USD 41.52 billion
- Market Future Opportunities: USD 29.80 billion
- CAGR from 2025 to 2030 : 20.3%
Market Summary
- The supercomputer market is undergoing a significant transformation, moving beyond raw computational speed to emphasize specialized, application-optimized infrastructure. This evolution is driven by the convergence of traditional data-intensive tasks with the demands of generative intelligence and large language models. The development of high-throughput architecture, featuring high-bandwidth memory and advanced liquid cooling, is essential for achieving higher compute density.
- Concurrently, a strategic push toward technological sovereignty is reshaping the landscape, with nations investing in indigenous manufacturing and secure semiconductor supply chains to support their deep-tech ecosystems. For instance, in the pharmaceutical sector, these systems enable complex molecular interactions simulation, dramatically accelerating drug discovery timelines.
- This requires not only powerful AI accelerators but also sophisticated workload orchestration to manage both AI-integrated supercomputing and scientific simulation workloads.
- This shift underscores a move toward a post-exascale future where system value is defined by versatility, energy efficiency, and alignment with national strategic priorities, including the development of sovereign AI infrastructure and a skilled workforce capable of advanced parallel programming.
What will be the Size of the Supercomputer Market during the forecast period?
Get Key Insights on Market Forecast (PDF) Get Free Sample
How is the Supercomputer Market Segmented?
The supercomputer industry research report provides comprehensive data (region-wise segment analysis), with forecasts and estimates in "USD million" for the period 2026-2030, as well as historical data from 2020-2024 for the following segments.
- Os
- Linux
- UNIX
- Mixed
- Windows
- End-user
- Government entities
- Scientific research and academic institutions
- Commercial industries
- Processor type
- Intel
- IBM (Power)
- AMD
- Others
- Geography
- APAC
- Japan
- China
- South Korea
- North America
- US
- Canada
- Mexico
- Europe
- Germany
- France
- Italy
- South America
- Brazil
- Argentina
- Middle East and Africa
- Saudi Arabia
- UAE
- South Africa
- Rest of World (ROW)
- APAC
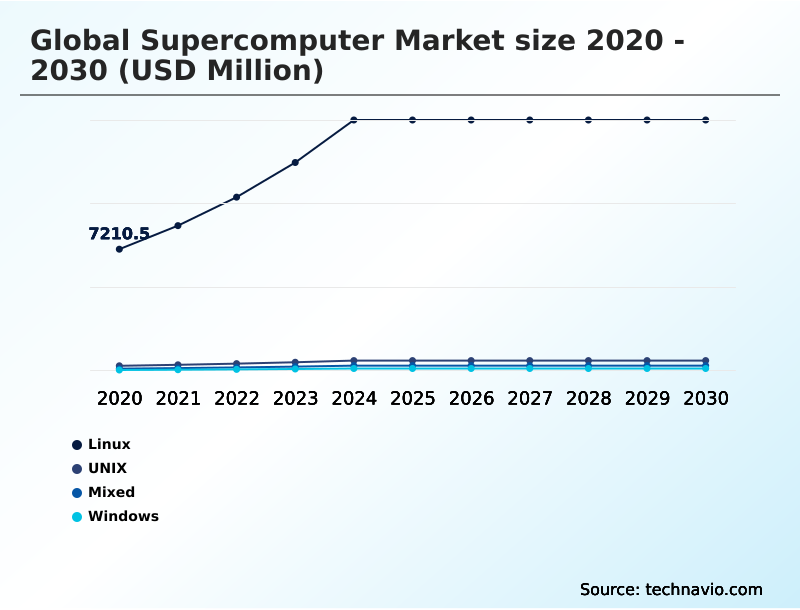
By OS Insights
The linux segment is estimated to witness significant growth during the forecast period.
The Linux segment remains dominant, providing the foundational open-source framework for the world's most powerful exascale-class systems. Its adaptability allows for deep hardware co-design and the creation of customized kernels for workload orchestration, which is critical for managing data-intensive tasks.
This flexibility enables the seamless integration of AI accelerators and supports the development of a domestic software stack essential for technological sovereignty. Modern high-performance computing stacks running on Linux are optimized for parallel programming and scientific simulation workloads.
These tailored environments have demonstrated an ability to reduce computational overhead by up to 15%, maximizing floating-point performance and enabling complex digital twin simulations. The architecture's inherent stability underpins mission-critical workloads across government and research sectors.
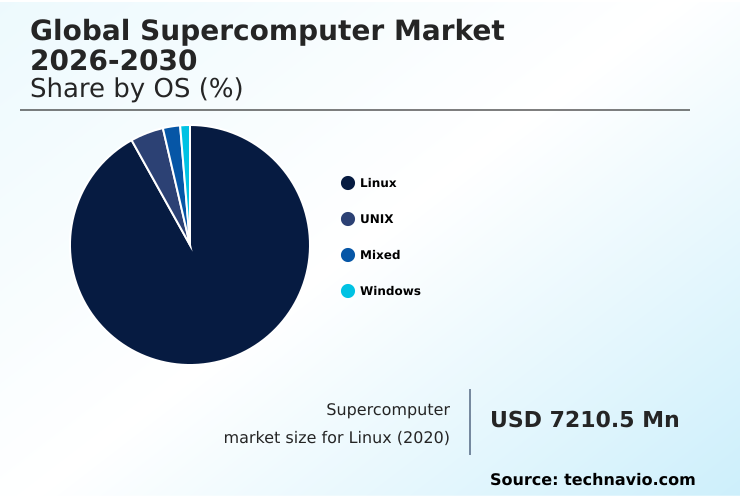
The Linux segment was valued at USD 14.81 billion in 2024 and showed a gradual increase during the forecast period.
Regional Analysis
APAC is estimated to contribute 54.6% to the growth of the global market during the forecast period.Technavio’s analysts have elaborately explained the regional trends and drivers that shape the market during the forecast period.
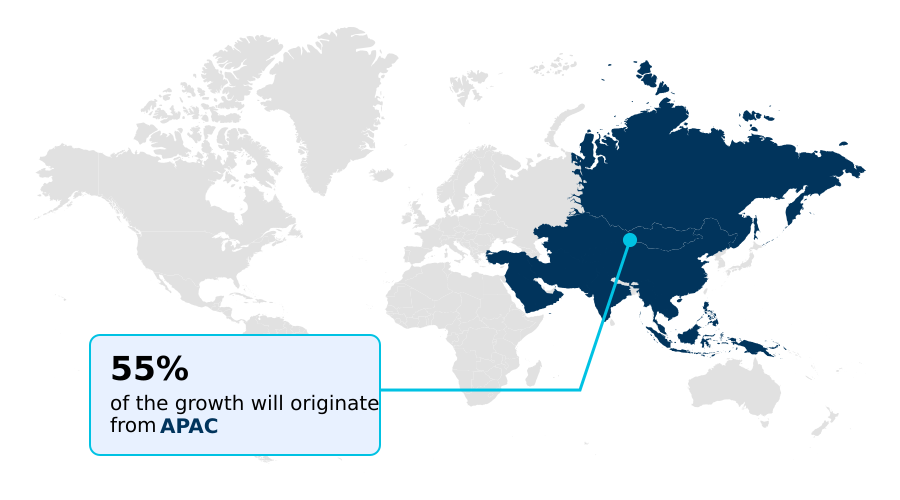
See How Supercomputer Market Demand is Rising in APAC Get Free Sample
The global landscape is defined by distinct regional strategies. In APAC, the focus is on a deep-tech ecosystem and achieving public-sector digital autonomy, with indigenous manufacturing of high-speed interconnects and system-on-a-chip components.
This region exhibits the highest growth momentum, outpacing North America by over 2 percentage points. North America continues to lead in deploying exascale architectures through public-private partnerships, prioritizing national security and AI gigafactories.
In Europe, the emphasis is on energy-efficient computing and cross-border collaborations, with mandates for heat reuse factor improvements driving carbon-neutral operations; some new facilities redirect over 90% of waste heat.
The Middle East and Africa is an emerging hub for high-density AI engines, leveraging vertical integration from power generation to cluster management to build a sovereign AI infrastructure.
Market Dynamics
Our researchers analyzed the data with 2025 as the base year, along with the key drivers, trends, and challenges. A holistic analysis of drivers will help companies refine their marketing strategies to gain a competitive advantage.
- The global supercomputer market 2026-2030 is navigating a complex interplay of technological advancement and geopolitical pressures. Key boardroom conversations center on supercomputer energy consumption and cooling, pushing for energy-efficient exascale system design.
- The geopolitical impact on semiconductor supply has made supercomputer supply chain resilience strategies a top priority, fueling the trend of sovereign AI and domestic infrastructure and the domestic manufacturing of HPC components to secure national research infrastructure. This drive aligns with national supercomputing mission goals. Technologically, the focus is on managing heterogeneous computing environments and achieving hybrid quantum-classical system integration.
- This is critical for advancing materials science and drug discovery. The performance of these systems is increasingly measured by their large language model training performance and their suitability for real-time analytics for financial modeling. For commercial applications, industrial digital twin simulation accuracy is paramount, with firms leveraging these capabilities reporting a twofold increase in predictive maintenance effectiveness.
- Addressing the talent shortage in parallel programming remains a persistent challenge, while hardware innovation continues with a focus on high-bandwidth memory for AI workloads, liquid cooling for compute density, and advanced packaging for system-on-a-chip designs. Ultimately, success depends on effective AI-native platform workload orchestration.
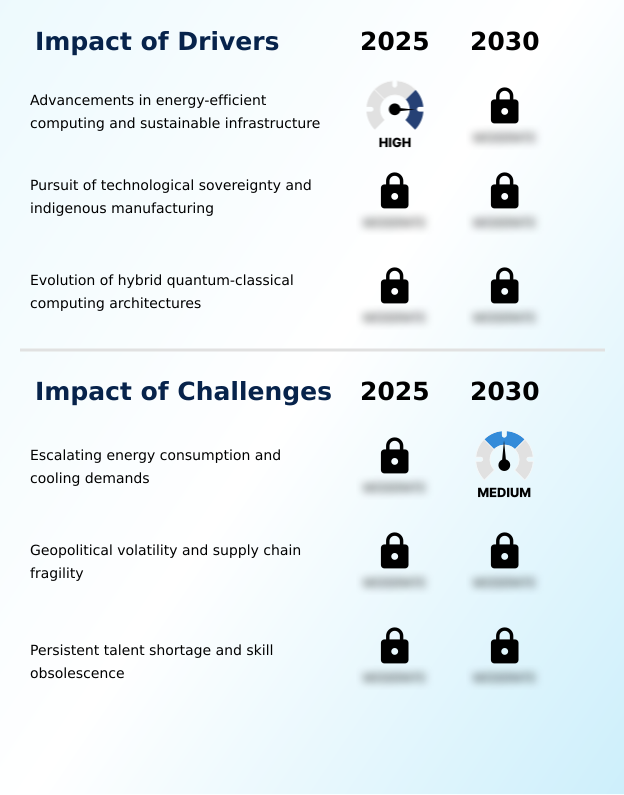
What are the key market drivers leading to the rise in the adoption of Supercomputer Industry?
- Advancements in energy-efficient computing and sustainable infrastructure are key drivers of market growth, enabling more powerful systems within manageable operational and environmental footprints.
- Market growth is propelled by advancements in both hardware efficiency and strategic national initiatives.
- The drive for energy-efficient computing is critical, as sustainable designs optimize performance-per-watt and can reduce operational costs, which account for up to 40% of a facility's total expenses.
- Green computing practices are now standard, with modern waste heat reuse factor metrics improving data center efficiency by over 15%.
- A second major driver is the pursuit of technological sovereignty, which stimulates investment in domestic software stacks and precision manufacturing equipment to create resilient deep-tech ecosystems.
- The third driver is the evolution of hybrid quantum-classical computing, which expands analytical capabilities for complex tasks like molecular interactions simulation, positioning supercomputers as versatile platforms for next-generation research.
What are the market trends shaping the Supercomputer Industry?
- The market is increasingly shaped by a transition toward sovereign AI. This involves the development of domestic high-performance computing infrastructure to ensure data security and reduce geopolitical dependencies.
- Key market trends reflect a strategic realignment toward specialized and secure high-performance computing. The primary trend is the shift to sovereign AI infrastructure, driven by the need for digital autonomy and secure data-driven transformations. This has led to a threefold increase in integration costs for multinational organizations navigating fragmented regulatory environments.
- Another significant trend is the convergence of AI-native platforms with traditional scientific needs, creating a high-density AI engine capable of handling both generative intelligence and complex physical simulations. This architectural redesign demands a tenfold increase in memory bandwidth.
- Finally, the emergence of hybrid quantum-classical computing is shaping the post-exascale future, with early systems demonstrating the ability to solve previously intractable problems in materials science, supported by hardware co-design.
What challenges does the Supercomputer Industry face during its growth?
- Escalating energy consumption and associated cooling demands represent a key challenge impacting industry growth and sustainability.
- The market faces significant operational and structural challenges. The primary constraint is the escalating power requirement of exascale systems, which consume dozens of megawatts and strain local grids, contributing to a 4% rise in national electricity consumption in some developed nations. This necessitates costly investments in advanced liquid cooling.
- A second challenge is geopolitical volatility, which creates supply chain fragility for critical components like semiconductors and disrupts cross-border collaborations. This instability forces organizations to diversify suppliers, increasing capital costs.
- Finally, a persistent skills shortage in advanced parallel programming and system administration leads to an estimated 20% underutilization of installed supercomputing capacity, limiting the return on hardware investments and slowing innovation.
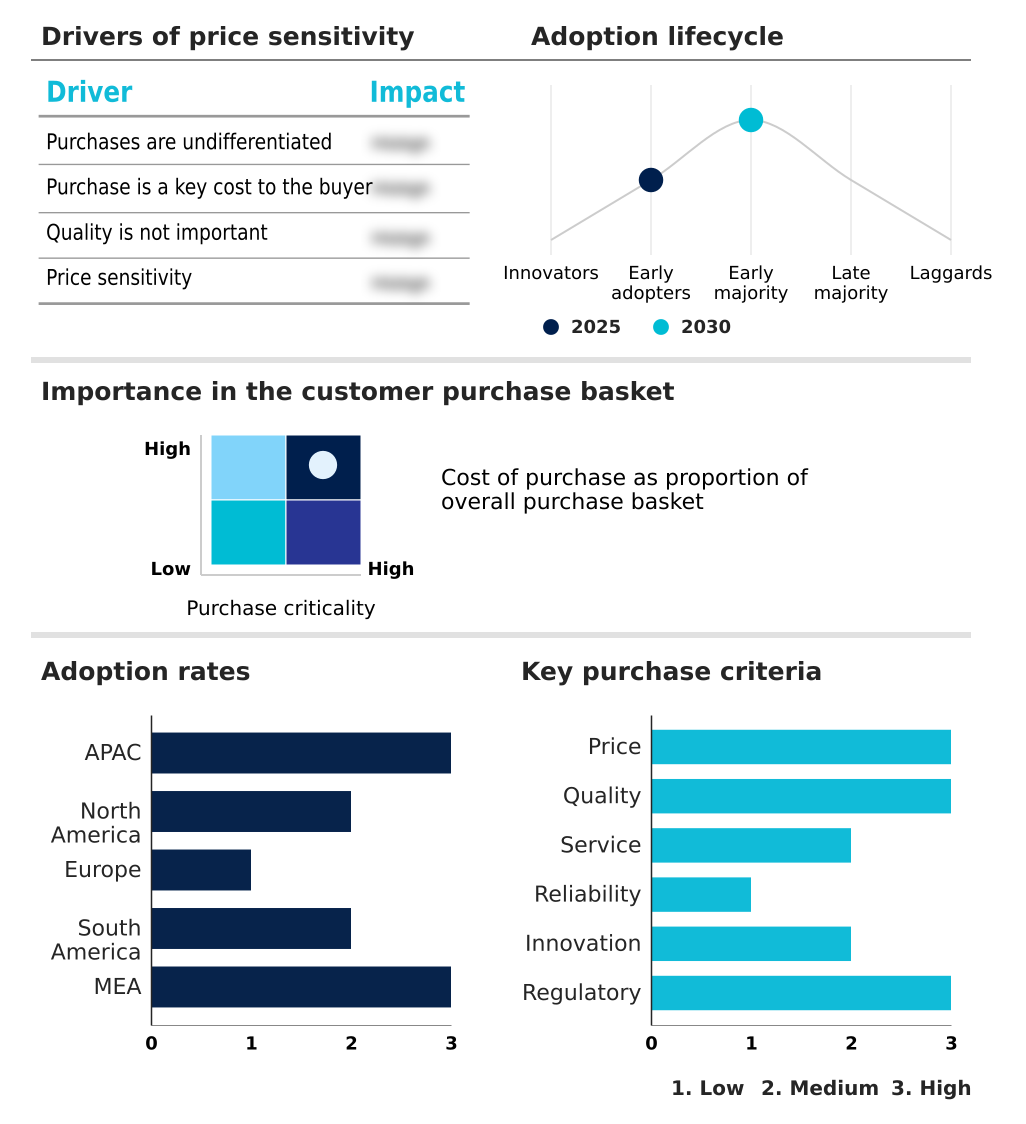
Exclusive Technavio Analysis on Customer Landscape
The supercomputer market forecasting report includes the adoption lifecycle of the market, covering from the innovator’s stage to the laggard’s stage. It focuses on adoption rates in different regions based on penetration. Furthermore, the supercomputer market report also includes key purchase criteria and drivers of price sensitivity to help companies evaluate and develop their market growth analysis strategies.
Customer Landscape of Supercomputer Industry
Competitive Landscape
Companies are implementing various strategies, such as strategic alliances, supercomputer market forecast, partnerships, mergers and acquisitions, geographical expansion, and product/service launches, to enhance their presence in the industry.
Advanced Micro Devices Inc. - Delivering advanced computing platforms and integrated hardware solutions engineered for large-scale AI, scientific simulation workloads, and exascale performance.
The industry research and growth report includes detailed analyses of the competitive landscape of the market and information about key companies, including:
- Advanced Micro Devices Inc.
- ASUSTeK Computer Inc.
- Cerebras
- Dell Technologies Inc.
- E4 Computer Engineering SpA
- EUROTECH Spa
- Eviden
- Fujitsu Ltd.
- Hewlett Packard Entp Co.
- Huawei Technologies Co. Ltd.
- IBM Corp.
- Intel Corp.
- Lenovo Group Ltd.
- Microsoft Corp.
- NEC Corp.
- NVIDIA Corp.
- Penguin Solutions Inc
- Super Micro Computer Inc.
- ZF Friedrichshafen AG
Qualitative and quantitative analysis of companies has been conducted to help clients understand the wider business environment as well as the strengths and weaknesses of key industry players. Data is qualitatively analyzed to categorize companies as pure play, category-focused, industry-focused, and diversified; it is quantitatively analyzed to categorize companies as dominant, leading, strong, tentative, and weak.
Recent Development and News in Supercomputer market
- In September, 2024, the PARAM Rudra series was made widely available to facilitate pioneering research in physics and cosmology.
- In May, 2025, the United States Department of Energy announced a significant contract for the development of the NERSC-10 system, which is scheduled for deployment in 2026.
- In October, 2025, Foxconn announced a strategic investment of nearly one and a half billion dollars for the procurement of equipment for a massive AI compute cluster and supercomputing center.
- In November, 2025, the University of Bristol launched Isambard-AI, recognized as the most powerful university-based supercomputer in the world, utilizing over five thousand NVIDIA superchips.
Dive into Technavio’s robust research methodology, blending expert interviews, extensive data synthesis, and validated models for unparalleled Supercomputer Market insights. See full methodology.
| Market Scope | |
|---|---|
| Page number | 310 |
| Base year | 2025 |
| Historic period | 2020-2024 |
| Forecast period | 2026-2030 |
| Growth momentum & CAGR | Accelerate at a CAGR of 20.3% |
| Market growth 2026-2030 | USD 29801.9 million |
| Market structure | Fragmented |
| YoY growth 2025-2026(%) | 18.1% |
| Key countries | Japan, China, South Korea, Taiwan, India, Singapore, US, Canada, Mexico, Germany, France, Italy, UK, Norway, Sweden, Brazil, Argentina, Chile, Saudi Arabia, UAE, South Africa, Israel and Turkey |
| Competitive landscape | Leading Companies, Market Positioning of Companies, Competitive Strategies, and Industry Risks |
Research Analyst Overview
- The supercomputer market's evolution is defined by the strategic convergence of AI-integrated supercomputing and traditional scientific workloads, compelling a shift in boardroom-level investment strategies. Decisions are no longer solely about procuring floating-point performance but about building a resilient, application-optimized infrastructure.
- The move toward indigenous manufacturing and establishing secure semiconductor supply chains is a direct response to geopolitical volatility, forcing a choice between global cloud reliance and the higher cost of technological sovereignty. This is evident in the development of custom processor architectures and high-performance computing stacks tailored for specific national interests.
- Architecturally, systems with multi-threaded throughput and on-chip acceleration are becoming standard. For instance, facilities using advanced liquid cooling technologies are achieving a 50% greater compute density within the same physical footprint.
- The integration of quantum processing units with exascale-class systems, along with the adoption of neural processing units and high-speed interconnects, marks a significant step toward a post-exascale future where versatility and efficiency define competitive advantage.
What are the Key Data Covered in this Supercomputer Market Research and Growth Report?
-
What is the expected growth of the Supercomputer Market between 2026 and 2030?
-
USD 29.80 billion, at a CAGR of 20.3%
-
-
What segmentation does the market report cover?
-
The report is segmented by OS (Linux, UNIX, Mixed, and Windows), End-user (Government entities, Scientific research and academic institutions, and Commercial industries), Processor Type (Intel, IBM (Power), AMD, and Others) and Geography (APAC, North America, Europe, South America, Middle East and Africa)
-
-
Which regions are analyzed in the report?
-
APAC, North America, Europe, South America and Middle East and Africa
-
-
What are the key growth drivers and market challenges?
-
Advancements in energy-efficient computing and sustainable infrastructure, Escalating energy consumption and cooling demands
-
-
Who are the major players in the Supercomputer Market?
-
Advanced Micro Devices Inc., ASUSTeK Computer Inc., Cerebras, Dell Technologies Inc., E4 Computer Engineering SpA, EUROTECH Spa, Eviden, Fujitsu Ltd., Hewlett Packard Entp Co., Huawei Technologies Co. Ltd., IBM Corp., Intel Corp., Lenovo Group Ltd., Microsoft Corp., NEC Corp., NVIDIA Corp., Penguin Solutions Inc, Super Micro Computer Inc. and ZF Friedrichshafen AG
-
Market Research Insights
- Market dynamics are increasingly influenced by the push for greater efficiency and specialization in high-performance computing. The adoption of AI-aware resource management frameworks has led to a 25% improvement in workload scheduling optimization, enabling facilities to better balance long-running scientific simulations with burst-intensive AI training.
- Furthermore, hybrid quantum-classical computing approaches are gaining traction, demonstrating up to a 40% speed-up on specific, mathematically intractable problems that are common in materials science and financial modeling. This shift toward heterogeneous architectures is a direct response to the need for more versatile systems.
- As organizations pursue carbon-neutral operations, the focus on green computing practices has intensified, with new sustainability metrics guiding the design of energy-efficient computing platforms. This ensures that the expansion of computational power aligns with both economic and environmental mandates.
We can help! Our analysts can customize this supercomputer market research report to meet your requirements.
 RIA -
RIA - 
