Racket Sports Equipment Market Analysis, Size, and Forecast 2026-2030: North America (US, Canada, and Mexico), APAC (China, India, and Indonesia), Europe (UK, Germany, and France), South America (Brazil, Argentina, and Colombia), Middle East and Africa (South Africa, Saudi Arabia, and UAE), and Rest of World (ROW)

Racket Sports Equipment Market Analysis, Size, and Forecast 2026-2030:
North America (US, Canada, and Mexico), APAC (China, India, and Indonesia), Europe (UK, Germany, and France), South America (Brazil, Argentina, and Colombia), Middle East and Africa (South Africa, Saudi Arabia, and UAE), and Rest of World (ROW)

Published: Mar 2026 289 Pages SKU: IRTNTR43732

Market Overview at a Glance

$1.88 B
Market Opportunity
3.3%
CAGR 2025 - 2030
33.7%
North America Growth
$7.69 B
Offline segment 2024

Racket Sports Equipment Market Size 2026-2030

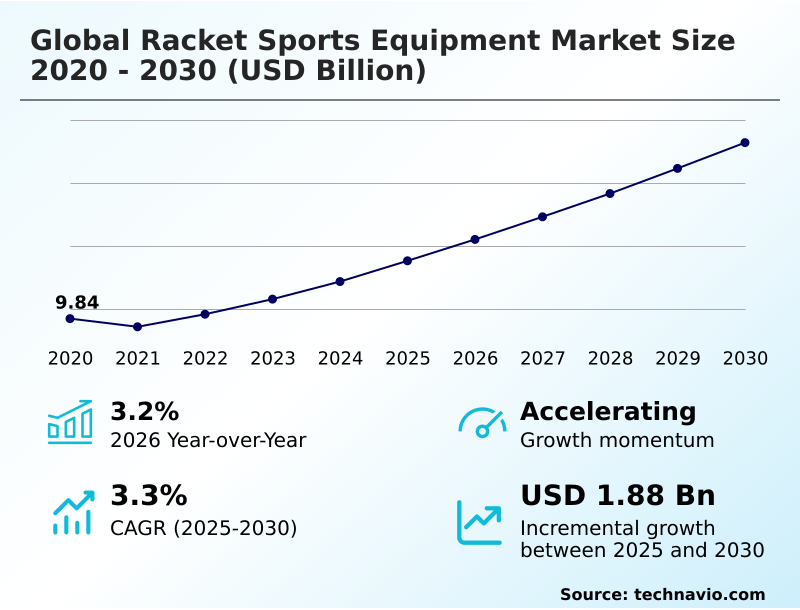
The racket sports equipment market size is valued to increase by USD 1.88 billion, at a CAGR of 3.3% from 2025 to 2030. Strategic of multi-sport facility construction and regional infrastructure investment will drive the racket sports equipment market.

Major Market Trends & Insights

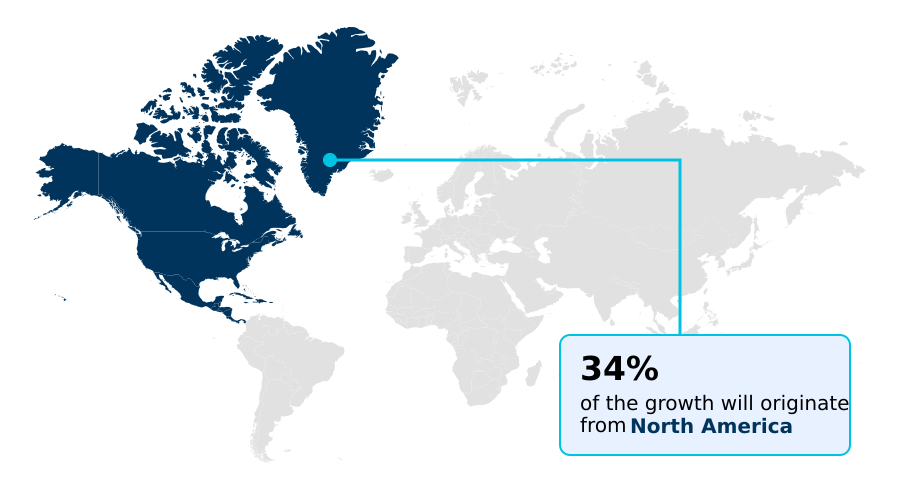
  • North America dominated the market and accounted for a 33.7% growth during the forecast period.
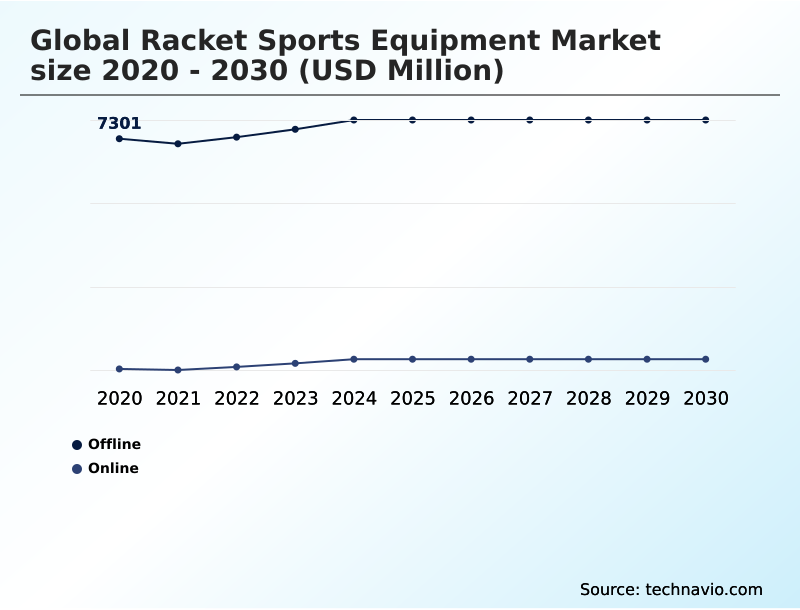
  • By Distribution Channel - Offline segment was valued at USD 7.69 billion in 2024
  • By Product - Tennis equipment segment accounted for the largest market revenue share in 2024

Market Size & Forecast

  • Market Opportunities: USD 2.80 billion
  • Market Future Opportunities: USD 1.88 billion
  • CAGR from 2025 to 2030 : 3.3%

Market Summary

  • The racket sports equipment market is undergoing dynamic expansion, driven by shifting consumer wellness priorities and significant advancements in material science. Innovations in carbon fiber composites enable the production of lighter, more durable rackets that enhance playability for both amateurs and professionals.
  • This trend is complemented by the rapid emergence of padel and pickleball, which diversifies the consumer base and accelerates equipment replacement cycles. For instance, manufacturers are now engineering specialized equipment to withstand varied climates and court surfaces, a complex logistical challenge requiring precise supply chain coordination.
  • Integrating smart performance analytics into equipment has also become a critical differentiator, offering players actionable data to improve their game. This evolution toward connected, high-performance gear, alongside a growing emphasis on sustainable manufacturing, underpins a sophisticated and resilient growth trajectory for the industry.
  • The market's expansion is not just about new products but about creating a holistic ecosystem that supports a broader, multi-generational audience focused on accessible, low-impact athletic activities.

What will be the Size of the Racket Sports Equipment Market during the forecast period?

Get Key Insights on Market Forecast (PDF) Request Free Sample

How is the Racket Sports Equipment Market Segmented?

The racket sports equipment industry research report provides comprehensive data (region-wise segment analysis), with forecasts and estimates in "USD million" for the period 2026-2030, as well as historical data from 2020-2024 for the following segments.

  • Distribution channel
    • Offline
    • Online
  • Product
    • Tennis equipment
    • Badminton equipment
    • Squash equipment
  • Type
    • Rackets
    • Balls or shuttlecocks
    • Apparel
    • Others
  • Geography
    • North America
      • US
      • Canada
      • Mexico
    • APAC
      • China
      • India
      • Indonesia
    • Europe
      • UK
      • Germany
      • France
    • South America
      • Brazil
      • Argentina
      • Colombia
    • Middle East and Africa
      • South Africa
      • Saudi Arabia
      • UAE
    • Rest of World (ROW)

By Distribution Channel Insights

The offline segment is estimated to witness significant growth during the forecast period.

The offline segment continues to anchor the racket sports equipment market, with physical retail environments providing indispensable value.

Consumers prioritize the tactile experience, allowing direct evaluation of an ergonomic grip design on a high-modulus graphite racket or the quality of synthetic gut strings.

The rise of experiential retail zones enhances this, offering services like professional stringing with co-polyester strings or textured filament strings and enabling on-demand customization.

Integrating an omnichannel retail experience with a strong direct-to-consumer sales model allows brands to showcase specialized court footwear and eco-friendly racket grips alongside low-compression balls.

Utilizing advanced inventory systems has been shown to eliminate nearly 100% of manual errors in component identification, ensuring customers receive precise product specifications and bolstering the appeal of in-person purchasing.

Request Free Sample

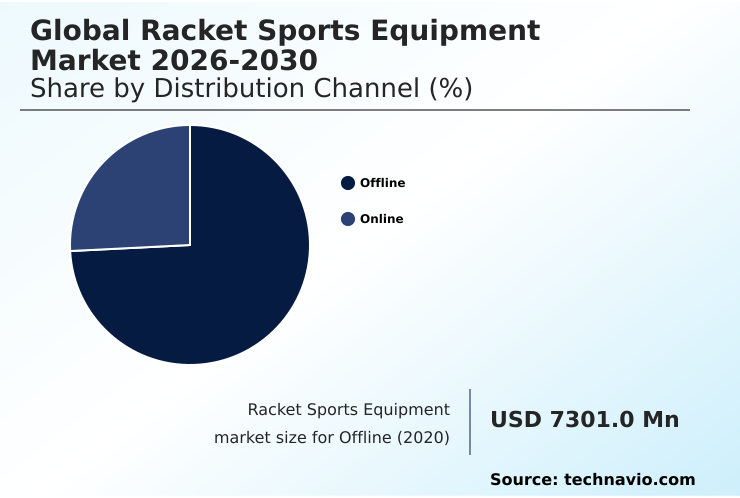
The Offline segment was valued at USD 7.69 billion in 2024 and showed a gradual increase during the forecast period.

Request Free Sample

Regional Analysis

North America is estimated to contribute 33.7% to the growth of the global market during the forecast period.Technavio’s analysts have elaborately explained the regional trends and drivers that shape the market during the forecast period.

See How Racket Sports Equipment Market Demand is Rising in North America Request Free Sample

The geographic landscape of the racket sports equipment market is diversifying, with North America poised to capture 33.7% of the market's incremental growth. In this region, the proliferation of climate-controlled sports hubs ensures year-round play, driving consistent demand.

APAC remains the fastest-growing region, where investments in green technology adoption for manufacturing are becoming a key differentiator. Firms leveraging regionalized production in APAC have reported a 15% reduction in supply chain costs.

In emerging markets in South America and the Middle East, there is a focus on developing high-altitude performance gear and installing professional-grade nets in new facilities.

The global push for sustainability is also driving initiatives around closed-loop recovery programs, reshaping how equipment is produced and managed across all key geographies.

Market Dynamics

Our researchers analyzed the data with 2025 as the base year, along with the key drivers, trends, and challenges. A holistic analysis of drivers will help companies refine their marketing strategies to gain a competitive advantage.

  • Understanding the nuances of the global racket sports equipment market requires a deep dive into specific technical and economic factors. The impact of tariffs on sports equipment prices is a critical consideration for global supply chain planning, influencing sourcing and manufacturing decisions. A detailed pickleball paddle core material comparison reveals how different composites affect playability and durability, guiding product development.
  • The industry is also pivoting toward green solutions, with a focus on sustainable materials in modern tennis rackets and the establishment of recycling processes for pressurized tennis balls. Technology integration is paramount, as evidenced by the demand for smart racket sensor data analysis software and the exploration of custom 3d-printed racket grip benefits.
  • For instance, brands offering on-demand customization options for grips have reported customer satisfaction scores nearly 25% higher than those offering standard models. In-depth technical knowledge is becoming a key purchase driver. Consumers now research the padel racket foam density impact on power and seek aerodynamic badminton racket frame design analysis.
  • The ideal junior tennis racket head weight, vibration dampening effectiveness in squash rackets, and official squash ball bounce level guide are no longer niche topics. Players are actively learning how to optimize racket balance with lead tape and study the performance of bio-circular carbon fiber rackets.
  • This educated consumer base scrutinizes everything from badminton shuttlecock flight stability factors to key advancements in racket string technology and the pickleball paddle surface texture for spin, forcing brands to innovate continuously across the entire product lifecycle.

What are the key market drivers leading to the rise in the adoption of Racket Sports Equipment Industry?

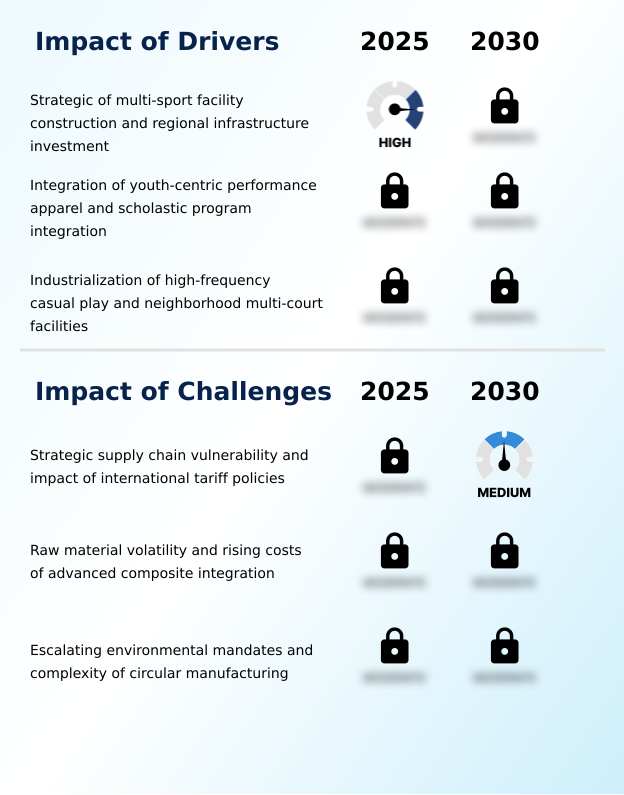
  • The strategic construction of multi-sport facilities, coupled with increased regional infrastructure investment, serves as a key driver for market growth.

  • Market growth is significantly driven by the expansion of accessible playing venues and diversification of the racket sports portfolio. The construction of multi-sport facility and community sports hubs fuels high-frequency casual play, increasing equipment turnover.
  • Incorporating racket sports into scholastic physical education programs creates a sustained pipeline of new players. In terms of equipment technology, paddles with honeycomb core materials are seeing adoption rates increase by 40% year-over-year in emerging sports.
  • Innovations in racquet design, including open-throat racquet design and closed-throat racquet design, cater to different play styles.
  • For badminton, the development of high-repulsion shuttlecocks using high-elasticity carbon and sonic flare system technology improves game speed, while advanced aerodynamic frame design enhances maneuverability, supporting growth across all skill levels, especially with new indoor court technologies.

What are the market trends shaping the Racket Sports Equipment Industry?

  • The integration of smart performance analytics represents a significant upcoming market trend, involving the embedding of sensors into equipment to provide players with data-driven performance insights.

  • Emerging trends are reshaping the market, with smart performance analytics becoming a key differentiator. The adoption of sensor-embedded equipment allows for a data-driven training regimen that was previously exclusive to professionals. This technological shift is supported by digital coaching platforms and is central to grassroots development programs targeting youth-centric performance equipment.
  • The move toward bespoke ergonomic solutions is accelerated by the additive manufacturing process, where 3d-printed customization creates a truly human-centered design. Using laser scanning technology to create a digital twin modeling of a player's hand allows for tailored grips, a process that has reduced player-reported discomfort by 30%.
  • This trend is complemented by a rise in athleisure apparel integration, blending on-court performance with off-court style.

What challenges does the Racket Sports Equipment Industry face during its growth?

  • Strategic supply chain vulnerabilities and the financial impact of evolving international tariff policies present a key challenge affecting the industry's growth trajectory.

  • The industry faces significant headwinds from supply chain vulnerability and raw material price volatility, particularly for aerospace-grade carbon fiber and other multi-material composites. A reliance on centralized composite material expertise in specific regions creates risk, prompting a strategic evaluation of regional micro-factories.
  • Implementing a circular manufacturing model is another major challenge, complicated by the difficulty of end-of-life recycling for products made with carbon fiber composites and specialized bio-based polymers. Adherence to sustainable manufacturing practices requires substantial investment in R&D to develop viable recycled textile blends and improve high-grade rubber production processes.
  • Firms investing in these green transitions have reported initial R&D overhead increases of up to 25%, a necessary cost to meet evolving environmental mandates and consumer expectations.

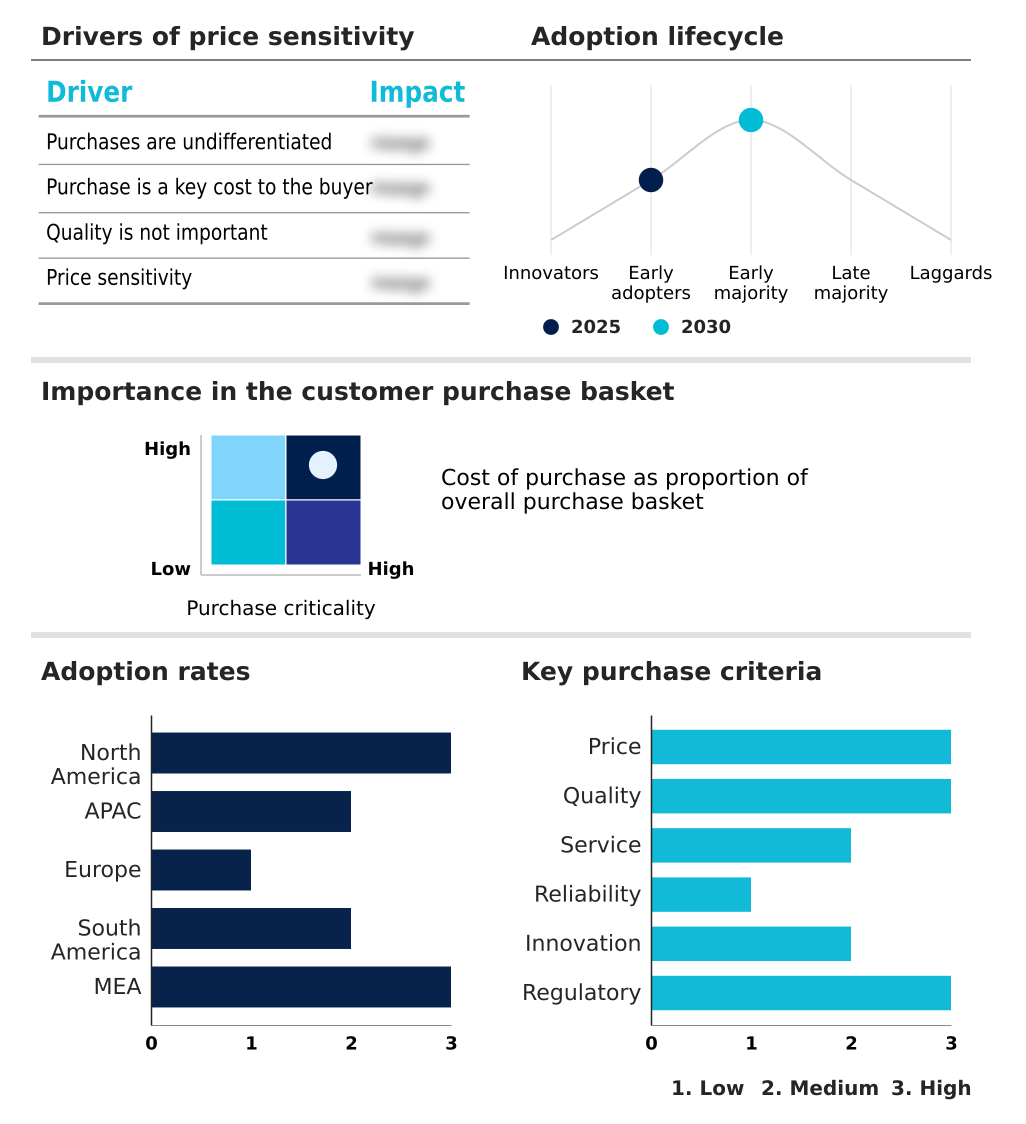
Exclusive Technavio Analysis on Customer Landscape

The racket sports equipment market forecasting report includes the adoption lifecycle of the market, covering from the innovator’s stage to the laggard’s stage. It focuses on adoption rates in different regions based on penetration. Furthermore, the racket sports equipment market report also includes key purchase criteria and drivers of price sensitivity to help companies evaluate and develop their market growth analysis strategies.

Customer Landscape of Racket Sports Equipment Industry

Competitive Landscape

Companies are implementing various strategies, such as strategic alliances, racket sports equipment market forecast, partnerships, mergers and acquisitions, geographical expansion, and product/service launches, to enhance their presence in the industry.

ABG Prince LLC - Specializes in a comprehensive range of tennis equipment, including high-performance rackets, advanced strings, and functional accessories designed for both competitive and recreational players.

The industry research and growth report includes detailed analyses of the competitive landscape of the market and information about key companies, including:

  • ABG Prince LLC
  • BABOLAT VS SAS
  • CORNILLEAU SAS
  • Dunlop Sports
  • Gamma Sports
  • Harrow Sports
  • HEAD Sport GmbH
  • JOOLA
  • Karakal Worldwide Ltd.
  • Li Ning Co. Ltd.
  • Mizuno Corp.
  • Selkirk Sport LLC
  • Solinco Sports
  • STIGA Sports AB
  • Tamasu Co. Ltd.
  • Tecnifibre
  • VICTOR Europe GmbH
  • Volkl Tennis
  • Wilson Sporting Goods Co.
  • Yonex Co. Ltd.

Qualitative and quantitative analysis of companies has been conducted to help clients understand the wider business environment as well as the strengths and weaknesses of key industry players. Data is qualitatively analyzed to categorize companies as pure play, category-focused, industry-focused, and diversified; it is quantitatively analyzed to categorize companies as dominant, leading, strong, tentative, and weak.

Recent Development and News in Racket sports equipment market

  • In May 2025, Decathlon announced a five-year investment plan to open one hundred new outlets across India, significantly expanding its physical retail footprint in a key growth market.
  • In April 2025, HEAD launched its limited-edition BOOM RAW tennis racquet, notable for its construction from bio-circular carbon fibers sourced from agricultural and forestry waste.
  • In March 2025, the European Squash Federation adopted the Squash Players App as its official platform for venue and performance data, signaling a major move toward digital integration.
  • In October 2024, Wilson Sporting Goods Co. introduced its 'CustomFit 3D' service, enabling players to order rackets with personalized 3D-printed grips based on hand-scan data.

Dive into Technavio’s robust research methodology, blending expert interviews, extensive data synthesis, and validated models for unparalleled Racket Sports Equipment Market insights. See full methodology.

Market Scope
Page number 289
Base year 2025
Historic period 2020-2024
Forecast period 2026-2030
Growth momentum & CAGR Accelerate at a CAGR of 3.3%
Market growth 2026-2030 USD 1879.5 million
Market structure Fragmented
YoY growth 2025-2026(%) 3.2%
Key countries US, Canada, Mexico, China, India, Indonesia, Japan, South Korea, Australia, UK, Germany, France, Spain, Italy, The Netherlands, Brazil, Argentina, Colombia, South Africa, Egypt, Saudi Arabia, UAE and Turkey
Competitive landscape Leading Companies, Market Positioning of Companies, Competitive Strategies, and Industry Risks

Request Free Sample

Research Analyst Overview

  • The racket sports equipment market is a nexus of material science innovation. The industry relies on deep composite material expertise to engineer products using carbon fiber composites, high-modulus graphite, and graphene-infused composites enhanced with nanomaterials.
  • Boardroom strategy now prioritizes additive manufacturing process for 3d-printed customization, a human-centered design using laser scanning technology and digital twin modeling for perfect ergonomic grip design. This results in a 20% reduction in prototyping timelines. Key technologies include vibration-dampening technology, auxetic 2.0 technology, and torsional stability enhancement.
  • Sustainability is driving use of bio-circular carbon fibers, bio-based polymers, and recycled textile blends. Competition for aerospace-grade carbon fiber and challenges in high-grade rubber production impact supply chains. Product lines feature aerodynamic frame design with high-elasticity carbon, honeycomb core materials, advanced foam cores, and modular weighting systems, with options for open-throat racquet design and closed-throat racquet design.
  • Sensor-embedded equipment providing smart performance analytics is mainstream, while consumables like high-repulsion shuttlecocks featuring sonic flare system tech, synthetic gut strings, co-polyester strings, and textured filament strings see constant innovation.

What are the Key Data Covered in this Racket Sports Equipment Market Research and Growth Report?

  • What is the expected growth of the Racket Sports Equipment Market between 2026 and 2030?

    • USD 1.88 billion, at a CAGR of 3.3%

  • What segmentation does the market report cover?

    • The report is segmented by Distribution Channel (Offline, and Online), Product (Tennis equipment, Badminton equipment, and Squash equipment), Type (Rackets, Balls or shuttlecocks, Apparel, and Others) and Geography (North America, APAC, Europe, South America, Middle East and Africa)

  • Which regions are analyzed in the report?

    • North America, APAC, Europe, South America and Middle East and Africa

  • What are the key growth drivers and market challenges?

    • Strategic of multi-sport facility construction and regional infrastructure investment, Strategic supply chain vulnerability and impact of international tariff policies

  • Who are the major players in the Racket Sports Equipment Market?

    • ABG Prince LLC, BABOLAT VS SAS, CORNILLEAU SAS, Dunlop Sports, Gamma Sports, Harrow Sports, HEAD Sport GmbH, JOOLA, Karakal Worldwide Ltd., Li Ning Co. Ltd., Mizuno Corp., Selkirk Sport LLC, Solinco Sports, STIGA Sports AB, Tamasu Co. Ltd., Tecnifibre, VICTOR Europe GmbH, Volkl Tennis, Wilson Sporting Goods Co. and Yonex Co. Ltd.

Market Research Insights

  • The racket sports equipment market is shaped by a confluence of evolving consumer behaviors and technological advancements. The pivot towards athleisure apparel integration reflects a broader lifestyle trend, while the success of the direct-to-consumer sales model has enabled brands to achieve customer acquisition cost reductions of up to 15%.
  • Forward-thinking companies are expanding their racket sports portfolio to capture emerging demographics. Strategic investment in multi-sport facility development and scholastic physical education programs is crucial for long-term growth.
  • Furthermore, the adoption of omnichannel retail experience strategies has been shown to increase customer lifetime value by over 20% compared to single-channel approaches, highlighting the importance of integrated digital and physical touchpoints for engaging today’s players.

We can help! Our analysts can customize this racket sports equipment market research report to meet your requirements.

Get in touch

1. Executive Summary

1.1 Market overview

Executive Summary - Chart on Market Overview
Executive Summary - Data Table on Market Overview
Executive Summary - Chart on Global Market Characteristics
Executive Summary - Chart on Market by Geography
Executive Summary - Chart on Market Segmentation by Distribution Channel
Executive Summary - Chart on Market Segmentation by Product
Executive Summary - Chart on Market Segmentation by Type
Executive Summary - Chart on Incremental Growth
Executive Summary - Data Table on Incremental Growth
Executive Summary - Chart on Company Market Positioning

2. Technavio Analysis

2.1 Analysis of price sensitivity, lifecycle, customer purchase basket, adoption rates, and purchase criteria

2.2 Criticality of inputs and Factors of differentiation

Chart on Overview on criticality of inputs and factors of differentiation

2.3 Factors of disruption

Chart on Overview on factors of disruption

2.4 Impact of drivers and challenges

Chart on Impact of drivers and challenges in 2025 and 2030

3. Market Landscape

3.1 Market ecosystem

Chart on Parent Market
Data Table on - Parent Market

3.2 Market characteristics

Chart on Market characteristics analysis

3.3 Value chain analysis

Chart on Value chain analysis

4. Market Sizing

4.1 Market definition

Data Table on Offerings of companies included in the market definition

4.2 Market segment analysis

Market segments

4.3 Market size 2025

4.4 Market outlook: Forecast for 2025-2030

Chart on Global - Market size and forecast 2025-2030 ($ million)
Data Table on Global - Market size and forecast 2025-2030 ($ million)
Chart on Global Market: Year-over-year growth 2025-2030 (%)
Data Table on Global Market: Year-over-year growth 2025-2030 (%)

5. Historic Market Size

5.1 Global Racket Sports Equipment Market 2020 - 2024

Historic Market Size - Data Table on Global Racket Sports Equipment Market 2020 - 2024 ($ million)

5.2 Distribution Channel segment analysis 2020 - 2024

Historic Market Size - Distribution Channel Segment 2020 - 2024 ($ million)

5.3 Product segment analysis 2020 - 2024

Historic Market Size - Product Segment 2020 - 2024 ($ million)

5.4 Type segment analysis 2020 - 2024

Historic Market Size - Type Segment 2020 - 2024 ($ million)

5.5 Geography segment analysis 2020 - 2024

Historic Market Size - Geography Segment 2020 - 2024 ($ million)

5.6 Country segment analysis 2020 - 2024

Historic Market Size - Country Segment 2020 - 2024 ($ million)

6. Qualitative Analysis

6.1 Impact of AI in global racket sports equipment market

7. Five Forces Analysis

7.1 Five forces summary

Five forces analysis - Comparison between 2025 and 2030

7.2 Bargaining power of buyers

Bargaining power of buyers - Impact of key factors 2025 and 2030

7.3 Bargaining power of suppliers

Bargaining power of suppliers - Impact of key factors in 2025 and 2030

7.4 Threat of new entrants

Threat of new entrants - Impact of key factors in 2025 and 2030

7.5 Threat of substitutes

Threat of substitutes - Impact of key factors in 2025 and 2030

7.6 Threat of rivalry

Threat of rivalry - Impact of key factors in 2025 and 2030

7.7 Market condition

Chart on Market condition - Five forces 2025 and 2030

8. Market Segmentation by Distribution Channel

8.1 Market segments

Chart on Distribution Channel - Market share 2025-2030 (%)
Data Table on Distribution Channel - Market share 2025-2030 (%)

8.2 Comparison by Distribution Channel

Chart on Comparison by Distribution Channel
Data Table on Comparison by Distribution Channel

8.3 Offline - Market size and forecast 2025-2030

Chart on Offline - Market size and forecast 2025-2030 ($ million)
Data Table on Offline - Market size and forecast 2025-2030 ($ million)
Chart on Offline - Year-over-year growth 2025-2030 (%)
Data Table on Offline - Year-over-year growth 2025-2030 (%)

8.4 Online - Market size and forecast 2025-2030

Chart on Online - Market size and forecast 2025-2030 ($ million)
Data Table on Online - Market size and forecast 2025-2030 ($ million)
Chart on Online - Year-over-year growth 2025-2030 (%)
Data Table on Online - Year-over-year growth 2025-2030 (%)

8.5 Market opportunity by Distribution Channel

Market opportunity by Distribution Channel ($ million)
Data Table on Market opportunity by Distribution Channel ($ million)

9. Market Segmentation by Product

9.1 Market segments

Chart on Product - Market share 2025-2030 (%)
Data Table on Product - Market share 2025-2030 (%)

9.2 Comparison by Product

Chart on Comparison by Product
Data Table on Comparison by Product

9.3 Tennis equipment - Market size and forecast 2025-2030

Chart on Tennis equipment - Market size and forecast 2025-2030 ($ million)
Data Table on Tennis equipment - Market size and forecast 2025-2030 ($ million)
Chart on Tennis equipment - Year-over-year growth 2025-2030 (%)
Data Table on Tennis equipment - Year-over-year growth 2025-2030 (%)

9.4 Badminton equipment - Market size and forecast 2025-2030

Chart on Badminton equipment - Market size and forecast 2025-2030 ($ million)
Data Table on Badminton equipment - Market size and forecast 2025-2030 ($ million)
Chart on Badminton equipment - Year-over-year growth 2025-2030 (%)
Data Table on Badminton equipment - Year-over-year growth 2025-2030 (%)

9.5 Squash equipment - Market size and forecast 2025-2030

Chart on Squash equipment - Market size and forecast 2025-2030 ($ million)
Data Table on Squash equipment - Market size and forecast 2025-2030 ($ million)
Chart on Squash equipment - Year-over-year growth 2025-2030 (%)
Data Table on Squash equipment - Year-over-year growth 2025-2030 (%)

9.6 Market opportunity by Product

Market opportunity by Product ($ million)
Data Table on Market opportunity by Product ($ million)

10. Market Segmentation by Type

10.1 Market segments

Chart on Type - Market share 2025-2030 (%)
Data Table on Type - Market share 2025-2030 (%)

10.2 Comparison by Type

Chart on Comparison by Type
Data Table on Comparison by Type

10.3 Rackets - Market size and forecast 2025-2030

Chart on Rackets - Market size and forecast 2025-2030 ($ million)
Data Table on Rackets - Market size and forecast 2025-2030 ($ million)
Chart on Rackets - Year-over-year growth 2025-2030 (%)
Data Table on Rackets - Year-over-year growth 2025-2030 (%)

10.4 Balls or shuttlecocks - Market size and forecast 2025-2030

Chart on Balls or shuttlecocks - Market size and forecast 2025-2030 ($ million)
Data Table on Balls or shuttlecocks - Market size and forecast 2025-2030 ($ million)
Chart on Balls or shuttlecocks - Year-over-year growth 2025-2030 (%)
Data Table on Balls or shuttlecocks - Year-over-year growth 2025-2030 (%)

10.5 Apparel - Market size and forecast 2025-2030

Chart on Apparel - Market size and forecast 2025-2030 ($ million)
Data Table on Apparel - Market size and forecast 2025-2030 ($ million)
Chart on Apparel - Year-over-year growth 2025-2030 (%)
Data Table on Apparel - Year-over-year growth 2025-2030 (%)

10.6 Others - Market size and forecast 2025-2030

Chart on Others - Market size and forecast 2025-2030 ($ million)
Data Table on Others - Market size and forecast 2025-2030 ($ million)
Chart on Others - Year-over-year growth 2025-2030 (%)
Data Table on Others - Year-over-year growth 2025-2030 (%)

10.7 Market opportunity by Type

Market opportunity by Type ($ million)
Data Table on Market opportunity by Type ($ million)

11. Customer Landscape

11.1 Customer landscape overview

Analysis of price sensitivity, lifecycle, customer purchase basket, adoption rates, and purchase criteria

12. Geographic Landscape

12.1 Geographic segmentation

Chart on Market share by geography 2025-2030 (%)
Data Table on Market share by geography 2025-2030 (%)

12.2 Geographic comparison

Chart on Geographic comparison
Data Table on Geographic comparison

12.3 North America - Market size and forecast 2025-2030

Chart on North America - Market size and forecast 2025-2030 ($ million)
Data Table on North America - Market size and forecast 2025-2030 ($ million)
Chart on North America - Year-over-year growth 2025-2030 (%)
Data Table on North America - Year-over-year growth 2025-2030 (%)
Chart on Regional Comparison - North America
Data Table on Regional Comparison - North America

12.3.1 US - Market size and forecast 2025-2030

Chart on US - Market size and forecast 2025-2030 ($ million)
Data Table on US - Market size and forecast 2025-2030 ($ million)
Chart on US - Year-over-year growth 2025-2030 (%)
Data Table on US - Year-over-year growth 2025-2030 (%)

12.3.2 Canada - Market size and forecast 2025-2030

Chart on Canada - Market size and forecast 2025-2030 ($ million)
Data Table on Canada - Market size and forecast 2025-2030 ($ million)
Chart on Canada - Year-over-year growth 2025-2030 (%)
Data Table on Canada - Year-over-year growth 2025-2030 (%)

12.3.3 Mexico - Market size and forecast 2025-2030

Chart on Mexico - Market size and forecast 2025-2030 ($ million)
Data Table on Mexico - Market size and forecast 2025-2030 ($ million)
Chart on Mexico - Year-over-year growth 2025-2030 (%)
Data Table on Mexico - Year-over-year growth 2025-2030 (%)

12.4 APAC - Market size and forecast 2025-2030

Chart on APAC - Market size and forecast 2025-2030 ($ million)
Data Table on APAC - Market size and forecast 2025-2030 ($ million)
Chart on APAC - Year-over-year growth 2025-2030 (%)
Data Table on APAC - Year-over-year growth 2025-2030 (%)
Chart on Regional Comparison - APAC
Data Table on Regional Comparison - APAC

12.4.1 China - Market size and forecast 2025-2030

Chart on China - Market size and forecast 2025-2030 ($ million)
Data Table on China - Market size and forecast 2025-2030 ($ million)
Chart on China - Year-over-year growth 2025-2030 (%)
Data Table on China - Year-over-year growth 2025-2030 (%)

12.4.2 India - Market size and forecast 2025-2030

Chart on India - Market size and forecast 2025-2030 ($ million)
Data Table on India - Market size and forecast 2025-2030 ($ million)
Chart on India - Year-over-year growth 2025-2030 (%)
Data Table on India - Year-over-year growth 2025-2030 (%)

12.4.3 Indonesia - Market size and forecast 2025-2030

Chart on Indonesia - Market size and forecast 2025-2030 ($ million)
Data Table on Indonesia - Market size and forecast 2025-2030 ($ million)
Chart on Indonesia - Year-over-year growth 2025-2030 (%)
Data Table on Indonesia - Year-over-year growth 2025-2030 (%)

12.4.4 Japan - Market size and forecast 2025-2030

Chart on Japan - Market size and forecast 2025-2030 ($ million)
Data Table on Japan - Market size and forecast 2025-2030 ($ million)
Chart on Japan - Year-over-year growth 2025-2030 (%)
Data Table on Japan - Year-over-year growth 2025-2030 (%)

12.4.5 South Korea - Market size and forecast 2025-2030

Chart on South Korea - Market size and forecast 2025-2030 ($ million)
Data Table on South Korea - Market size and forecast 2025-2030 ($ million)
Chart on South Korea - Year-over-year growth 2025-2030 (%)
Data Table on South Korea - Year-over-year growth 2025-2030 (%)

12.4.6 Australia - Market size and forecast 2025-2030

Chart on Australia - Market size and forecast 2025-2030 ($ million)
Data Table on Australia - Market size and forecast 2025-2030 ($ million)
Chart on Australia - Year-over-year growth 2025-2030 (%)
Data Table on Australia - Year-over-year growth 2025-2030 (%)

12.5 Europe - Market size and forecast 2025-2030

Chart on Europe - Market size and forecast 2025-2030 ($ million)
Data Table on Europe - Market size and forecast 2025-2030 ($ million)
Chart on Europe - Year-over-year growth 2025-2030 (%)
Data Table on Europe - Year-over-year growth 2025-2030 (%)
Chart on Regional Comparison - Europe
Data Table on Regional Comparison - Europe

12.5.1 UK - Market size and forecast 2025-2030

Chart on UK - Market size and forecast 2025-2030 ($ million)
Data Table on UK - Market size and forecast 2025-2030 ($ million)
Chart on UK - Year-over-year growth 2025-2030 (%)
Data Table on UK - Year-over-year growth 2025-2030 (%)

12.5.2 Germany - Market size and forecast 2025-2030

Chart on Germany - Market size and forecast 2025-2030 ($ million)
Data Table on Germany - Market size and forecast 2025-2030 ($ million)
Chart on Germany - Year-over-year growth 2025-2030 (%)
Data Table on Germany - Year-over-year growth 2025-2030 (%)

12.5.3 France - Market size and forecast 2025-2030

Chart on France - Market size and forecast 2025-2030 ($ million)
Data Table on France - Market size and forecast 2025-2030 ($ million)
Chart on France - Year-over-year growth 2025-2030 (%)
Data Table on France - Year-over-year growth 2025-2030 (%)

12.5.4 Spain - Market size and forecast 2025-2030

Chart on Spain - Market size and forecast 2025-2030 ($ million)
Data Table on Spain - Market size and forecast 2025-2030 ($ million)
Chart on Spain - Year-over-year growth 2025-2030 (%)
Data Table on Spain - Year-over-year growth 2025-2030 (%)

12.5.5 Italy - Market size and forecast 2025-2030

Chart on Italy - Market size and forecast 2025-2030 ($ million)
Data Table on Italy - Market size and forecast 2025-2030 ($ million)
Chart on Italy - Year-over-year growth 2025-2030 (%)
Data Table on Italy - Year-over-year growth 2025-2030 (%)

12.5.6 The Netherlands - Market size and forecast 2025-2030

Chart on The Netherlands - Market size and forecast 2025-2030 ($ million)
Data Table on The Netherlands - Market size and forecast 2025-2030 ($ million)
Chart on The Netherlands - Year-over-year growth 2025-2030 (%)
Data Table on The Netherlands - Year-over-year growth 2025-2030 (%)

12.6 South America - Market size and forecast 2025-2030

Chart on South America - Market size and forecast 2025-2030 ($ million)
Data Table on South America - Market size and forecast 2025-2030 ($ million)
Chart on South America - Year-over-year growth 2025-2030 (%)
Data Table on South America - Year-over-year growth 2025-2030 (%)
Chart on Regional Comparison - South America
Data Table on Regional Comparison - South America

12.6.1 Brazil - Market size and forecast 2025-2030

Chart on Brazil - Market size and forecast 2025-2030 ($ million)
Data Table on Brazil - Market size and forecast 2025-2030 ($ million)
Chart on Brazil - Year-over-year growth 2025-2030 (%)
Data Table on Brazil - Year-over-year growth 2025-2030 (%)

12.6.2 Argentina - Market size and forecast 2025-2030

Chart on Argentina - Market size and forecast 2025-2030 ($ million)
Data Table on Argentina - Market size and forecast 2025-2030 ($ million)
Chart on Argentina - Year-over-year growth 2025-2030 (%)
Data Table on Argentina - Year-over-year growth 2025-2030 (%)

12.6.3 Colombia - Market size and forecast 2025-2030

Chart on Colombia - Market size and forecast 2025-2030 ($ million)
Data Table on Colombia - Market size and forecast 2025-2030 ($ million)
Chart on Colombia - Year-over-year growth 2025-2030 (%)
Data Table on Colombia - Year-over-year growth 2025-2030 (%)

12.7 Middle East and Africa - Market size and forecast 2025-2030

Chart on Middle East and Africa - Market size and forecast 2025-2030 ($ million)
Data Table on Middle East and Africa - Market size and forecast 2025-2030 ($ million)
Chart on Middle East and Africa - Year-over-year growth 2025-2030 (%)
Data Table on Middle East and Africa - Year-over-year growth 2025-2030 (%)
Chart on Regional Comparison - Middle East and Africa
Data Table on Regional Comparison - Middle East and Africa

12.7.1 South Africa - Market size and forecast 2025-2030

Chart on South Africa - Market size and forecast 2025-2030 ($ million)
Data Table on South Africa - Market size and forecast 2025-2030 ($ million)
Chart on South Africa - Year-over-year growth 2025-2030 (%)
Data Table on South Africa - Year-over-year growth 2025-2030 (%)

12.7.2 Egypt - Market size and forecast 2025-2030

Chart on Egypt - Market size and forecast 2025-2030 ($ million)
Data Table on Egypt - Market size and forecast 2025-2030 ($ million)
Chart on Egypt - Year-over-year growth 2025-2030 (%)
Data Table on Egypt - Year-over-year growth 2025-2030 (%)

12.7.3 Saudi Arabia - Market size and forecast 2025-2030

Chart on Saudi Arabia - Market size and forecast 2025-2030 ($ million)
Data Table on Saudi Arabia - Market size and forecast 2025-2030 ($ million)
Chart on Saudi Arabia - Year-over-year growth 2025-2030 (%)
Data Table on Saudi Arabia - Year-over-year growth 2025-2030 (%)

12.7.4 UAE - Market size and forecast 2025-2030

Chart on UAE - Market size and forecast 2025-2030 ($ million)
Data Table on UAE - Market size and forecast 2025-2030 ($ million)
Chart on UAE - Year-over-year growth 2025-2030 (%)
Data Table on UAE - Year-over-year growth 2025-2030 (%)

12.7.5 Turkey - Market size and forecast 2025-2030

Chart on Turkey - Market size and forecast 2025-2030 ($ million)
Data Table on Turkey - Market size and forecast 2025-2030 ($ million)
Chart on Turkey - Year-over-year growth 2025-2030 (%)
Data Table on Turkey - Year-over-year growth 2025-2030 (%)

12.8 Market opportunity by geography

Market opportunity by geography ($ million)
Data Tables on Market opportunity by geography ($ million)

13. Drivers, Challenges, and Opportunity

13.1 Market drivers

Strategic of multi-sport facility construction and regional infrastructure investment
Integration of youth-centric performance apparel and scholastic program integration
Industrialization of high-frequency casual play and neighborhood multi-court facilities

13.2 Market challenges

Strategic supply chain vulnerability and impact of international tariff policies
Raw material volatility and rising costs of advanced composite integration
Escalating environmental mandates and complexity of circular manufacturing

13.3 Impact of drivers and challenges

Impact of drivers and challenges in 2025 and 2030

13.4 Market opportunities

Integration of smart performance analytics and sensor-embedded equipment
Strategic diversification into padel and pickleball ecosystems
Institutionalization of 3D-printed customization and bespoke ergonomics

14. Competitive Landscape

14.1 Overview

14.2

Overview on criticality of inputs and factors of differentiation

14.3 Landscape disruption

Overview on factors of disruption

14.4 Industry risks

Impact of key risks on business

15. Competitive Analysis

15.1 Companies profiled

Companies covered

15.2 Company ranking index

15.3 Market positioning of companies

Matrix on companies position and classification

15.4 ABG Prince LLC

ABG Prince LLC - Overview
ABG Prince LLC - Product / Service
ABG Prince LLC - Key offerings
SWOT

15.5 BABOLAT VS SAS

BABOLAT VS SAS - Overview
BABOLAT VS SAS - Product / Service
BABOLAT VS SAS - Key offerings
SWOT

15.6 Dunlop Sports

Dunlop Sports - Overview
Dunlop Sports - Product / Service
Dunlop Sports - Key offerings
SWOT

15.7 HEAD Sport GmbH

HEAD Sport GmbH - Overview
HEAD Sport GmbH - Product / Service
HEAD Sport GmbH - Key offerings
SWOT

15.8 JOOLA

JOOLA - Overview
JOOLA - Product / Service
JOOLA - Key offerings
SWOT

15.9 Li Ning Co. Ltd.

Li Ning Co. Ltd. - Overview
Li Ning Co. Ltd. - Product / Service
Li Ning Co. Ltd. - Key offerings
SWOT

15.10 Mizuno Corp.

Mizuno Corp. - Overview
Mizuno Corp. - Business segments
Mizuno Corp. - Key news
Mizuno Corp. - Key offerings
Mizuno Corp. - Segment focus
SWOT

15.11 Selkirk Sport LLC

Selkirk Sport LLC - Overview
Selkirk Sport LLC - Product / Service
Selkirk Sport LLC - Key offerings
SWOT

15.12 STIGA Sports AB

STIGA Sports AB - Overview
STIGA Sports AB - Product / Service
STIGA Sports AB - Key offerings
SWOT

15.13 Tamasu Co. Ltd.

Tamasu Co. Ltd. - Overview
Tamasu Co. Ltd. - Product / Service
Tamasu Co. Ltd. - Key offerings
SWOT

15.14 Tecnifibre

Tecnifibre - Overview
Tecnifibre - Product / Service
Tecnifibre - Key offerings
SWOT

15.15 VICTOR Europe GmbH

VICTOR Europe GmbH - Overview
VICTOR Europe GmbH - Product / Service
VICTOR Europe GmbH - Key offerings
SWOT

15.16 Volkl Tennis

Volkl Tennis - Overview
Volkl Tennis - Product / Service
Volkl Tennis - Key offerings
SWOT

15.17 Wilson Sporting Goods Co.

Wilson Sporting Goods Co. - Overview
Wilson Sporting Goods Co. - Product / Service
Wilson Sporting Goods Co. - Key offerings
SWOT

15.18 Yonex Co. Ltd.

Yonex Co. Ltd. - Overview
Yonex Co. Ltd. - Business segments
Yonex Co. Ltd. - Key offerings
Yonex Co. Ltd. - Segment focus
SWOT

16. Appendix

16.1 Scope of the report

Market definition
Objectives
Notes and caveats

16.2 Inclusions and exclusions checklist

Inclusions checklist
Exclusions checklist

16.3 Currency conversion rates for US$

16.4 Research methodology

16.5 Data procurement

Information sources

16.6 Data validation

16.7 Validation techniques employed for market sizing

16.8 Data synthesis

16.9 360 degree market analysis

16.10 List of abbreviations

Research Methodology

Technavio presents a detailed picture of the market by way of study, synthesis, and summation of data from multiple sources. The analysts have presented the various facets of the market with a particular focus on identifying the key industry influencers. The data thus presented is comprehensive, reliable, and the result of extensive research, both primary and secondary.

INFORMATION SOURCES

Primary sources

  • Manufacturers and suppliers
  • Channel partners
  • Industry experts
  • Strategic decision makers

Secondary sources

  • Industry journals and periodicals
  • Government data
  • Financial reports of key industry players
  • Historical data
  • Press releases

DATA ANALYSIS

Data Synthesis

  • Collation of data
  • Estimation of key figures
  • Analysis of derived insights

Data Validation

  • Triangulation with data models
  • Reference against proprietary databases
  • Corroboration with industry experts

REPORT WRITING

Qualitative

  • Market drivers
  • Market challenges
  • Market trends
  • Five forces analysis

Quantitative

  • Market size and forecast
  • Market segmentation
  • Geographical insights
  • Competitive landscape

Interested in this report?

Get your sample now to see our research methodology and insights!

Download Now

Frequently Asked Questions

Racket Sports Equipment market growth will increase by USD 1879.5 million during 2026-2030.

The Racket Sports Equipment market is expected to grow at a CAGR of 3.3% during 2026-2030.

Racket Sports Equipment market is segmented by Distribution channel (Offline, Online) Product (Tennis equipment, Badminton equipment, Squash equipment) Type (Rackets, Balls or shuttlecocks, Apparel, Others)

ABG Prince LLC, BABOLAT VS SAS, CORNILLEAU SAS, Dunlop Sports, Gamma Sports, Harrow Sports, HEAD Sport GmbH, JOOLA, Karakal Worldwide Ltd., Li Ning Co. Ltd., Mizuno Corp., Selkirk Sport LLC, Solinco Sports, STIGA Sports AB, Tamasu Co. Ltd., Tecnifibre, VICTOR Europe GmbH, Volkl Tennis, Wilson Sporting Goods Co., Yonex Co. Ltd. are a few of the key vendors in the Racket Sports Equipment market.

North America will register the highest growth rate of 33.7% among the other regions. Therefore, the Racket Sports Equipment market in North America is expected to garner significant business opportunities for the vendors during the forecast period.

US, Canada, Mexico, China, India, Indonesia, Japan, South Korea, Australia, UK, Germany, France, Spain, Italy, The Netherlands, Brazil, Argentina, Colombia, South Africa, Egypt, Saudi Arabia, UAE, Turkey

  • Strategic of multi-sport facility construction and regional infrastructure investment is the driving factor this market.

The Racket Sports Equipment market vendors should focus on grabbing business opportunities from the Distribution channel segment as it accounted for the largest market share in the base year.