RAID Controller Card Market Size 2025-2029
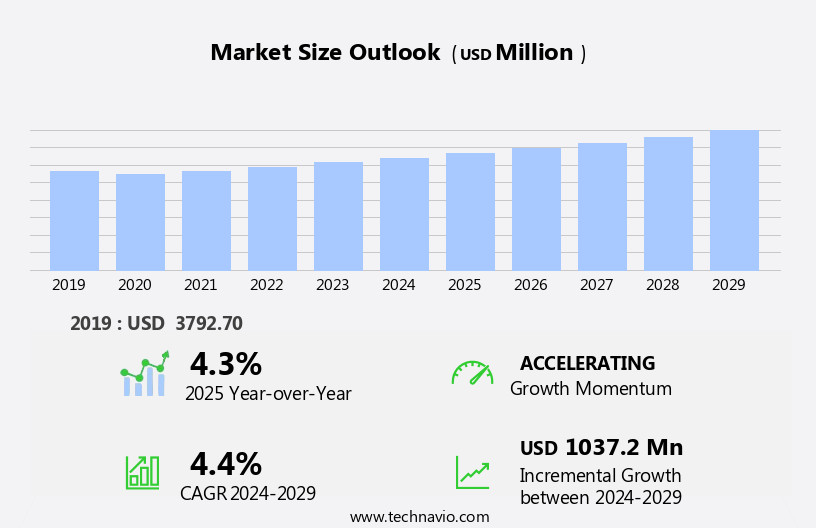
The RAID controller card market size is forecast to increase by USD 1.04 billion at a CAGR of 4.4% between 2024 and 2029.
- The market is experiencing significant growth, driven by the increasing adoption of cloud computing and the shift towards solid-state drives (SSDs) in data centers. Cloud computing's widespread use is leading to the consolidation of data centers, resulting in the need for more efficient and reliable storage solutions. RAID controller cards offer high-performance, fault-tolerant storage solutions, making them an ideal choice for data center operators. Additionally, the adoption of SSDs is on the rise due to their faster data access speeds and longer lifespan compared to traditional hard disk drives. This trend is further fueling the demand for RAID controller cards, as they provide optimal performance for SSDs.
- Companies seeking to capitalize on these market opportunities should focus on offering cost-effective, high-performance RAID controller solutions to meet the growing demand from cloud service providers and data center operators. However, challenges such as increasing competition and the need for continuous innovation to keep up with technological advancements remain significant obstacles for market participants. To navigate these challenges effectively, companies must invest in research and development and build strategic partnerships to stay ahead of the competition. Overall, the market presents significant growth opportunities for companies that can provide innovative, cost-effective solutions to meet the evolving needs of cloud service providers and data center operators.
What will be the Size of the RAID Controller Card Market during the forecast period?

Request Free Sample
- The market encompasses hardware components that manage and facilitate data storage operations, specifically focusing on RAID (Redundant Array of Independent Disks) infrastructure. These controllers, also referred to as storage controllers or disk array controllers, utilize various drive type protocols and interface architectures to manage and virtualize drives, providing functions such as data protection, redundancy characteristics, and native cache. The market's size is significant, driven by the increasing demand for high-performance, reliable, and scalable storage solutions. Hardware-based RAID controllers, including standalone and host bus adapter (HBA) variants, are essential components in maintaining data availability and ensuring data usability. Key trends include the integration of RAM cache, virtualizing drives, and support for various RAID levels.
- The number of drives and ports in a single controller continues to increase, offering improved data protection and uptime. Specialized software solutions further enhance the functionality of RAID controllers, enabling features like backups and data usability. Despite advancements, challenges remain, such as data loss due to drive failure and the need for data protection strategies. The market is expected to continue evolving, with a focus on enhancing data protection, improving performance, and supporting larger disk drives.
How is this RAID Controller Card Industry segmented?
The raid controller card industry research report provides comprehensive data (region-wise segment analysis), with forecasts and estimates in "USD million" for the period 2025-2029, as well as historical data from 2019-2023 for the following segments.
- End-user
- Small enterprises
- Large enterprises
- Product
- Hardware RAID
- Software RAID
- Form Factor
- PCIe RAID controller cards
- External RAID System
- Application
- IT and Telecom
- BFSI (Banking, Financial Services, and Insurance)
- Manufacturing
- Healthcare
- Government
- Others
- Geography
- APAC
- China
- India
- Japan
- South Korea
- North America
- Europe
- Middle East and Africa
- South America
- Rest of World (ROW)
By End-user Insights
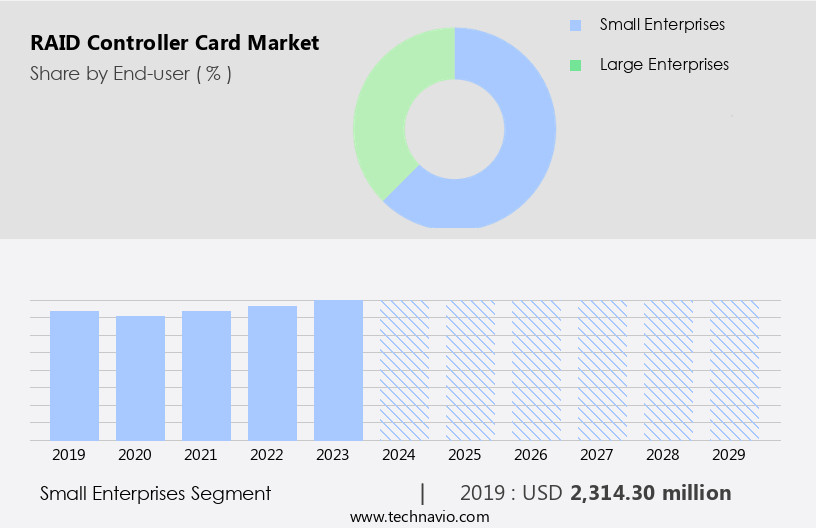
The small enterprises segment is estimated to witness significant growth during the forecast period. RAID controller cards are essential hardware components for managing and controlling data storage in RAID arrays, which consist of multiple disk drives working in unison to enhance data performance and reliability. Small enterprises leverage RAID technology to bolster their data storage capabilities, and RAID controller cards facilitate the implementation of various RAID configurations, from basic data redundancy to advanced performance optimization. These cards offer features such as data striping, mirroring, and parity, which significantly improve data access speeds and safeguard against data loss due to disk failures. The small enterprise segment of the global RAID controller card market caters to companies with smaller IT infrastructures and budgets compared to larger enterprises.
These cards provide functions like hot-swap bays, native cache, and operational speed, ensuring data usability and availability. RAID controller cards can accommodate various drive types and interface architectures, including Solid-State Drives (SSDs) and PCIe slots, making them versatile storage components. RAID controller cards offer RAID infrastructure capabilities, allowing for virtualizing drives and array setup with different RAID levels. They provide redundancy characteristics, ensuring data protection and backups, making them crucial for industrial applications and legacy systems. Technical sales experts recommend considering the number of drives, disk array controller, and the system's CPU when selecting a RAID controller card.
The availability of onboard RAID and specialized software further enhances the functionality of these cards. Ultimately, RAID controller cards are indispensable for maintaining data integrity, ensuring data security, and optimizing data handling speeds.

Get a glance at the market report of share of various segments Request Free Sample
The Small enterprises segment was valued at USD 2.31 billion in 2019 and showed a gradual increase during the forecast period.
Regional Analysis
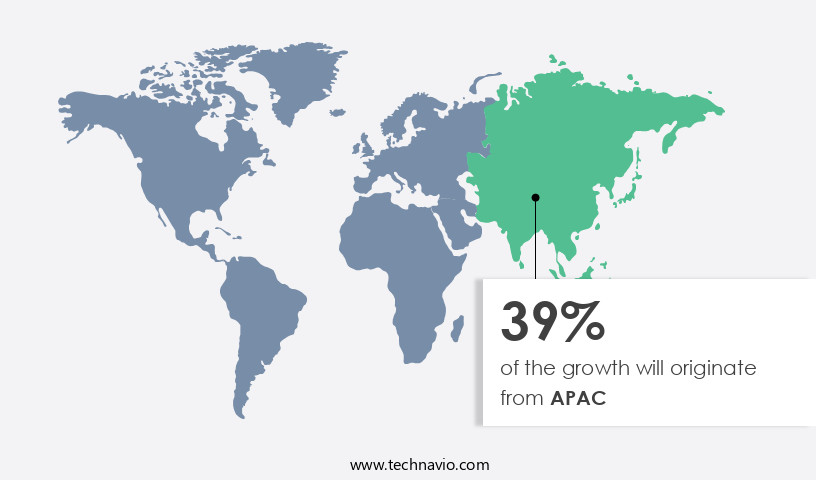
APAC is estimated to contribute 39% to the growth of the global market during the forecast period. Technavio's analysts have elaborately explained the regional trends and drivers that shape the market during the forecast period.

For more insights on the market size of various regions, Request Free Sample
The market is experiencing significant growth, particularly in the APAC region. With countries such as China, Japan, India, South Korea, Australia, and several Southeast Asian nations driving this expansion, the demand for RAID controller cards is increasing due to economic growth, technological advancements, and the widespread adoption of digitalization. The market caters to a diverse range of businesses, from small to large enterprises, spanning sectors like e-commerce, manufacturing, and telecommunications. RAID controller cards offer various functions, including data striping, mirroring, and parity algorithms, to ensure data redundancy and protect against drive failure. These cards come in different forms, such as dedicated controllers, onboard RAID, and virtualizing drives.
Interface architectures like PCIe slots and hot-swap bays enable easy integration with storage arrays. The number of drives supported and redundancy characteristics vary between RAID levels, such as RAID 0, RAID 1, and RAID 5. Specialized software and hardware-based RAID solutions provide additional features and operational speed, especially for solid-state drives (SSDs). The availability of native cache and the ability to handle large data volumes make RAID controller cards an essential component of any RAID infrastructure. In industrial applications, RAID controller cards ensure data usability and security, minimizing the risk of data loss and data security breaches.
The market's growth is driven by the need for high-performance, reliable, and scalable storage solutions to accommodate the increasing demands of modern businesses. Technical sales experts are essential in helping organizations navigate the complexities of RAID array setup, RAID modes, and the various RAID levels to optimize their storage components for their specific requirements.
Market Dynamics
Our researchers analyzed the data with 2024 as the base year, along with the key drivers, trends, and challenges. A holistic analysis of drivers will help companies refine their marketing strategies to gain a competitive advantage.
What are the key market drivers leading to the rise in the adoption of RAID Controller Card Industry?
- Rise in adoption of cloud computing is the key driver of the market. In the realm of cloud computing, the demand for scalable storage solutions has grown significantly due to the massive amounts of data being generated and processed in these environments. RAID controller cards play a pivotal role in addressing this requirement by supporting scalable storage configurations. These cards enable cloud providers to efficiently manage and expand their storage infrastructure while ensuring data integrity and reliability. RAID configurations offered by RAID controller cards provide an essential layer of protection against disk failures, ensuring that cloud data remains accessible and available for users.
- Moreover, RAID controller cards contribute to optimized storage performance, which is crucial for cloud workloads that include diverse applications and services. By enhancing data access speeds and overall system performance, these cards meet the demands of cloud-based applications, ultimately ensuring a seamless user experience.
What are the market trends shaping the RAID Controller Card Industry?
- Rising adoption of SSDs is the upcoming market trend. SSDs, or Solid State Drives, are becoming increasingly popular in enterprise environments due to their minimal power requirements and declining costs. With the adoption of SSDs on the rise, the demand for RAID controller cards is also surging. RAID controller cards offer crucial features for SSDs, including support for multiple drive configurations, error correction, and power loss protection. Huawei Technologies is one of the companies leading the charge in technological advancements, announcing its focus on developing an NVMe over Internet Protocol (IP) SSD with an on-drive object storage scheme. This trend is driving the growth of the market. As SSDs become more prevalent in enterprise storage solutions, the need for reliable and efficient RAID controller cards will continue to increase.
What challenges does the RAID Controller Card Industry face during its growth?
- Focus on consolidation of data centers is a key challenge affecting the industry growth. Enterprises are increasingly shifting towards Infrastructure as a Service (IaaS) to minimize the size of their physical data centers. This trend has resulted in the consolidation of data centers, which significantly reduces operational expenses (OPEX). Furthermore, software companies are adopting common cloud platforms, thereby eliminating the need for individual data centers. Notable enterprises like Box, Salesforce, and SAP have announced their plans to consolidate and offer their software solutions through these platforms. The virtualization of data centers also contributes to consolidation, leading to a decrease in the total number of data centers.
- The primary reasons for data center consolidation include cost savings, enhanced security, and improved control. This consolidation strategy offers enterprises a more efficient and cost-effective approach to managing their IT infrastructure.
Exclusive Customer Landscape
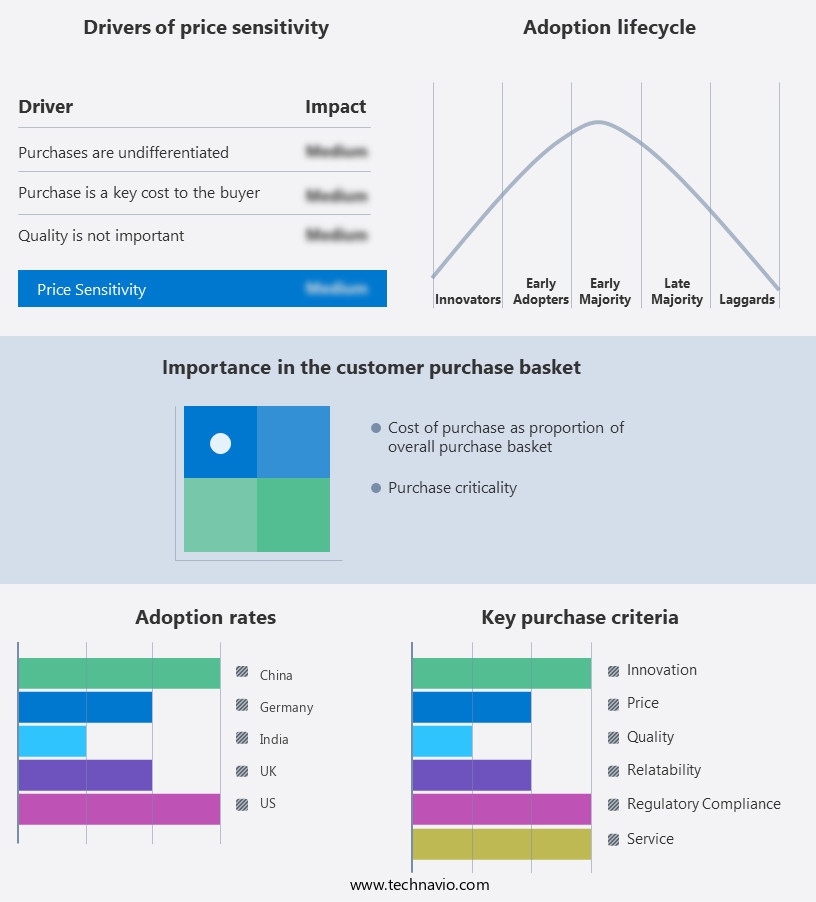
The raid controller card market forecasting report includes the adoption lifecycle of the market, covering from the innovator's stage to the laggard's stage. It focuses on adoption rates in different regions based on penetration. Furthermore, the raid controller card market report also includes key purchase criteria and drivers of price sensitivity to help companies evaluate and develop their market growth analysis strategies.

Customer Landscape
Key Companies & Market Insights
Companies are implementing various strategies, such as strategic alliances, raid controller card market forecast, partnerships, mergers and acquisitions, geographical expansion, and product/service launches, to enhance their presence in the industry.
Acer Inc. - RAID controller cards, such as Intel's offerings, deliver advanced data protection through on-chip technology and native PCI Express architecture. These solutions ensure high-speed cache performance and reliability for mission-critical applications.
The industry research and growth report includes detailed analyses of the competitive landscape of the market and information about key companies, including:
- Acer Inc.
- Advanced HPC Inc.
- Advantech Co. Ltd.
- Areca Technology Corp.
- Broadcom Inc.
- Cisco Systems Inc.
- Dell Technologies Inc.
- Fujitsu Ltd.
- Hewlett Packard Enterprise Co.
- HighPoint Inc.
- Huawei Technologies Co. Ltd.
- Intel Corp.
- International Business Machines Corp.
- Lenovo Group Ltd.
- Marvell Technology Inc.
- Microchip Technology Inc.
- NEC Corp.
- StarTech.com Ltd.
- Super Micro Computer Inc.
- Vantec Thermal Technologies Inc.
Qualitative and quantitative analysis of companies has been conducted to help clients understand the wider business environment as well as the strengths and weaknesses of key industry players. Data is qualitatively analyzed to categorize companies as pure play, category-focused, industry-focused, and diversified; it is quantitatively analyzed to categorize companies as dominant, leading, strong, tentative, and weak.
Research Analyst Overview
The raid controller market encompasses a range of storage controllers designed to manage and optimize the performance of raid arrays. These controllers employ various drive type protocols and interface architectures to ensure efficient data handling and high operational speed. Dedicated raid controllers offer specialized functions, such as hot-swap bays and support for solid-state drives (SSDs), to enhance storage infrastructure capabilities. The number of drives supported by raid controllers varies, with some catering to smaller setups while others can accommodate large-scale storage arrays. The availability of native cache and redundancy characteristics are crucial factors in ensuring data protection and minimizing the risk of data loss or data security breaches.
Interface architectures, such as PCIe slots, enable seamless integration of raid controllers into systems, allowing for virtualizing drives and implementing software raid as an alternative to hardware-based solutions. The operational speed of raid controllers plays a significant role in the overall performance of the storage infrastructure, with solid-state drives (SSDs) and hard disk drives (HDDs) benefiting from the enhanced capabilities of these controllers. The raid infrastructure market is driven by the growing demand for high-performance, reliable, and scalable storage solutions. Technical sales experts often encounter requirements for storage arrays in industrial applications, legacy systems, and modern data centers, necessitating the use of specialized software and drive types to optimize data usability and availability.
The choice between onboard raid and standalone raid controllers depends on the specific needs of the system, with the former being integrated into the motherboard and the latter offering more advanced features and greater flexibility. The system's CPU and data redundancy requirements also influence the decision-making process, as data loss and data security concerns continue to be major concerns for businesses. The raid infrastructure market is characterized by ongoing advancements in data handling speeds, data striping, and raid modes, which enable increased usable space and improved performance. The availability of various raid levels, including RAID 0, RAID 1, and RAID 5, offers flexibility in meeting the diverse needs of businesses and industrial applications.
In summary, the raid controller market is a dynamic and evolving landscape, driven by the demand for high-performance, reliable, and scalable storage solutions. Factors such as drive type protocols, interface architectures, number of drives, and data protection requirements all play a crucial role in the selection and implementation of raid controllers in various applications.
Market Scope
|
Report Coverage
|
Details
|
Page number
|
216
|
Base year
|
2024
|
Historic period
|
2019-2023 |
Forecast period
|
2025-2029
|
Growth momentum & CAGR
|
Accelerate at a CAGR of 4.4%
|
Market growth 2025-2029
|
USD 1.04 billion
|
Market structure
|
Fragmented
|
YoY growth 2024-2025(%)
|
4.3
|
Key countries
|
US, China, Canada, India, Japan, Germany, Saudi Arabia, South Korea, UK, UAE, Brazil, India, and UAE
|
Competitive landscape
|
Leading Companies, Market Positioning of Companies, Competitive Strategies, and Industry Risks
|
Request Free Sample
What are the Key Data Covered in this RAID Controller Card Market Research and Growth Report?
- CAGR of the RAID Controller Card industry during the forecast period
- Detailed information on factors that will drive the growth and forecasting between 2025 and 2029
- Precise estimation of the size of the market and its contribution of the industry in focus to the parent market
- Accurate predictions about upcoming growth and trends and changes in consumer behaviour
- Growth of the market across APAC, North America, Europe, Middle East and Africa, and South America
- Thorough analysis of the market's competitive landscape and detailed information about companies
- Comprehensive analysis of factors that will challenge the raid controller card market growth of industry companies
We can help! Our analysts can customize this raid controller card market research report to meet your requirements.
Get in touch
1 Executive Summary
- 1.1 Market overview
- Executive Summary - Chart on Market Overview
- Executive Summary - Data Table on Market Overview
- Executive Summary - Chart on Global Market Characteristics
- Executive Summary - Chart on Market by Geography
- Executive Summary - Chart on Market Segmentation by End-user
- Executive Summary - Chart on Market Segmentation by Product
- Executive Summary - Chart on Market Segmentation by Form Factor
- Executive Summary - Chart on Incremental Growth
- Executive Summary - Data Table on Incremental Growth
- Executive Summary - Chart on Company Market Positioning
2 Technavio Analysis
- 2.1 Analysis of price sensitivity, lifecycle, customer purchase basket, adoption rates, and purchase criteria
- Analysis of price sensitivity, lifecycle, customer purchase basket, adoption rates, and purchase criteria
- 2.2 Criticality of inputs and Factors of differentiation
- Overview on criticality of inputs and factors of differentiation
- 2.3 Factors of disruption
- Overview on factors of disruption
- 2.4 Impact of drivers and challenges
- Impact of drivers and challenges in 2024 and 2029
3 Market Landscape
- 3.1 Market ecosystem
- Parent Market
- Data Table on - Parent Market
- 3.2 Market characteristics
- Market characteristics analysis
4 Market Sizing
- 4.1 Market definition
- Offerings of companies included in the market definition
- 4.2 Market segment analysis
- 4.4 Market outlook: Forecast for 2024-2029
- Chart on Global - Market size and forecast 2024-2029 ($ million)
- Data Table on Global - Market size and forecast 2024-2029 ($ million)
- Chart on Global Market: Year-over-year growth 2024-2029 (%)
- Data Table on Global Market: Year-over-year growth 2024-2029 (%)
5 Historic Market Size
- 5.1 Global RAID Controller Card Market 2019 - 2023
- Historic Market Size - Data Table on Global RAID Controller Card Market 2019 - 2023 ($ million)
- 5.2 End-user segment analysis 2019 - 2023
- Historic Market Size - End-user Segment 2019 - 2023 ($ million)
- 5.3 Product segment analysis 2019 - 2023
- Historic Market Size - Product Segment 2019 - 2023 ($ million)
- 5.4 Form Factor segment analysis 2019 - 2023
- Historic Market Size - Form Factor Segment 2019 - 2023 ($ million)
- 5.5 Geography segment analysis 2019 - 2023
- Historic Market Size - Geography Segment 2019 - 2023 ($ million)
- 5.6 Country segment analysis 2019 - 2023
- Historic Market Size - Country Segment 2019 - 2023 ($ million)
6 Qualitative Analysis
- 6.1 The AI impact on global Redundant Array of Independent Disks controller card
7 Five Forces Analysis
- 7.1 Five forces summary
- Five forces analysis - Comparison between 2024 and 2029
- 7.2 Bargaining power of buyers
- Bargaining power of buyers - Impact of key factors 2024 and 2029
- 7.3 Bargaining power of suppliers
- Bargaining power of suppliers - Impact of key factors in 2024 and 2029
- 7.4 Threat of new entrants
- Threat of new entrants - Impact of key factors in 2024 and 2029
- 7.5 Threat of substitutes
- Threat of substitutes - Impact of key factors in 2024 and 2029
- 7.6 Threat of rivalry
- Threat of rivalry - Impact of key factors in 2024 and 2029
- 7.7 Market condition
- Chart on Market condition - Five forces 2024 and 2029
8 Market Segmentation by End-user
- 8.1 Market segments
- Chart on End-user - Market share (2024-2029) (%)
- Data Table on End-user - Market share (2024-2029) (%)
- 8.2 Comparison by End-user
- Chart on Comparison by End-user
- Data Table on Comparison by End-user
- 8.3 Small enterprises - Market size and forecast (2024-2029)
- Chart on Small enterprises - Market size and forecast (2024-2029) ($ million)
- Data Table on Small enterprises - Market size and forecast (2024-2029) ($ million)
- Chart on Small enterprises - Year-over-year growth (2024-2029) (%)
- Data Table on Small enterprises - Year-over-year growth (2024-2029) (%)
- 8.4 Large enterprises - Market size and forecast (2024-2029)
- Chart on Large enterprises - Market size and forecast (2024-2029) ($ million)
- Data Table on Large enterprises - Market size and forecast (2024-2029) ($ million)
- Chart on Large enterprises - Year-over-year growth (2024-2029) (%)
- Data Table on Large enterprises - Year-over-year growth (2024-2029) (%)
- 8.5 Market opportunity by End-user
- Market opportunity by End-user ($ million)
- Data Table on Market opportunity by End-user ($ million)
9 Market Segmentation by Product
- 9.1 Market segments
- Chart on Product - Market share (2024-2029) (%)
- Data Table on Product - Market share (2024-2029) (%)
- 9.2 Comparison by Product
- Chart on Comparison by Product
- Data Table on Comparison by Product
- 9.3 Hardware RAID - Market size and forecast (2024-2029)
- Chart on Hardware RAID - Market size and forecast (2024-2029) ($ million)
- Data Table on Hardware RAID - Market size and forecast (2024-2029) ($ million)
- Chart on Hardware RAID - Year-over-year growth (2024-2029) (%)
- Data Table on Hardware RAID - Year-over-year growth (2024-2029) (%)
- 9.4 Software RAID - Market size and forecast (2024-2029)
- Chart on Software RAID - Market size and forecast (2024-2029) ($ million)
- Data Table on Software RAID - Market size and forecast (2024-2029) ($ million)
- Chart on Software RAID - Year-over-year growth (2024-2029) (%)
- Data Table on Software RAID - Year-over-year growth (2024-2029) (%)
- 9.5 Market opportunity by Product
- Market opportunity by Product ($ million)
- Data Table on Market opportunity by Product ($ million)
10 Market Segmentation by Form Factor
- 10.1 Market segments
- Chart on Form Factor - Market share (2024-2029) (%)
- Data Table on Form Factor - Market share (2024-2029) (%)
- 10.2 Comparison by Form Factor
- Chart on Comparison by Form Factor
- Data Table on Comparison by Form Factor
- 10.3 PCIe RAID controller cards - Market size and forecast (2024-2029)
- Chart on PCIe RAID controller cards - Market size and forecast (2024-2029) ($ million)
- Data Table on PCIe RAID controller cards - Market size and forecast (2024-2029) ($ million)
- Chart on PCIe RAID controller cards - Year-over-year growth (2024-2029) (%)
- Data Table on PCIe RAID controller cards - Year-over-year growth (2024-2029) (%)
- 10.4 External RAID System - Market size and forecast (2024-2029)
- Chart on External RAID System - Market size and forecast (2024-2029) ($ million)
- Data Table on External RAID System - Market size and forecast (2024-2029) ($ million)
- Chart on External RAID System - Year-over-year growth (2024-2029) (%)
- Data Table on External RAID System - Year-over-year growth (2024-2029) (%)
- 10.5 Market opportunity by Form Factor
- Market opportunity by Form Factor ($ million)
- Data Table on Market opportunity by Form Factor ($ million)
11 Market Segmentation by Application
- 11.1 Market segments
- Chart on Application - Market share (2024-2029) (%)
- Data Table on Application - Market share (2024-2029) (%)
- 11.2 Comparison by Application
- Chart on Comparison by Application
- Data Table on Comparison by Application
- 11.3 IT and Telecom - Market size and forecast (2024-2029)
- Chart on IT and Telecom - Market size and forecast (2024-2029) ($ million)
- Data Table on IT and Telecom - Market size and forecast (2024-2029) ($ million)
- Chart on IT and Telecom - Year-over-year growth (2024-2029) (%)
- Data Table on IT and Telecom - Year-over-year growth (2024-2029) (%)
- 11.4 BFSI (Banking, Financial Services, and Insurance) - Market size and forecast (2024-2029)
- Chart on BFSI (Banking, Financial Services, and Insurance) - Market size and forecast (2024-2029) ($ million)
- Data Table on BFSI (Banking, Financial Services, and Insurance) - Market size and forecast (2024-2029) ($ million)
- Chart on BFSI (Banking, Financial Services, and Insurance) - Year-over-year growth (2024-2029) (%)
- Data Table on BFSI (Banking, Financial Services, and Insurance) - Year-over-year growth (2024-2029) (%)
- 11.5 Manufacturing - Market size and forecast (2024-2029)
- Chart on Manufacturing - Market size and forecast (2024-2029) ($ million)
- Data Table on Manufacturing - Market size and forecast (2024-2029) ($ million)
- Chart on Manufacturing - Year-over-year growth (2024-2029) (%)
- Data Table on Manufacturing - Year-over-year growth (2024-2029) (%)
- 11.6 Healthcare - Market size and forecast (2024-2029)
- Chart on Healthcare - Market size and forecast (2024-2029) ($ million)
- Data Table on Healthcare - Market size and forecast (2024-2029) ($ million)
- Chart on Healthcare - Year-over-year growth (2024-2029) (%)
- Data Table on Healthcare - Year-over-year growth (2024-2029) (%)
- 11.7 Government - Market size and forecast (2024-2029)
- Chart on Government - Market size and forecast (2024-2029) ($ million)
- Data Table on Government - Market size and forecast (2024-2029) ($ million)
- Chart on Government - Year-over-year growth (2024-2029) (%)
- Data Table on Government - Year-over-year growth (2024-2029) (%)
- 11.8 Others - Market size and forecast (2024-2029)
- Chart on Others - Market size and forecast (2024-2029) ($ million)
- Data Table on Others - Market size and forecast (2024-2029) ($ million)
- Chart on Others - Year-over-year growth (2024-2029) (%)
- Data Table on Others - Year-over-year growth (2024-2029) (%)
- 11.9 Market opportunity by Application
- Market opportunity by Application ($ million)
- Data Table on Market opportunity by Application ($ million)
12 Customer Landscape
- 12.1 Customer landscape overview
- Analysis of price sensitivity, lifecycle, customer purchase basket, adoption rates, and purchase criteria
13 Geographic Landscape
- 13.1 Geographic segmentation
- Chart on Market share by geography 2024-2029 (%)
- Data Table on Market share by geography 2024-2029 (%)
- 13.2 Geographic comparison
- Chart on Geographic comparison
- Data Table on Geographic comparison
- 13.3 APAC - Market size and forecast 2024-2029
- Chart on APAC - Market size and forecast 2024-2029 ($ million)
- Data Table on APAC - Market size and forecast 2024-2029 ($ million)
- Chart on APAC - Year-over-year growth 2024-2029 (%)
- Data Table on APAC - Year-over-year growth 2024-2029 (%)
- 13.4 North America - Market size and forecast 2024-2029
- Chart on North America - Market size and forecast 2024-2029 ($ million)
- Data Table on North America - Market size and forecast 2024-2029 ($ million)
- Chart on North America - Year-over-year growth 2024-2029 (%)
- Data Table on North America - Year-over-year growth 2024-2029 (%)
- 13.5 Europe - Market size and forecast 2024-2029
- Chart on Europe - Market size and forecast 2024-2029 ($ million)
- Data Table on Europe - Market size and forecast 2024-2029 ($ million)
- Chart on Europe - Year-over-year growth 2024-2029 (%)
- Data Table on Europe - Year-over-year growth 2024-2029 (%)
- 13.6 Middle East and Africa - Market size and forecast 2024-2029
- Chart on Middle East and Africa - Market size and forecast 2024-2029 ($ million)
- Data Table on Middle East and Africa - Market size and forecast 2024-2029 ($ million)
- Chart on Middle East and Africa - Year-over-year growth 2024-2029 (%)
- Data Table on Middle East and Africa - Year-over-year growth 2024-2029 (%)
- 13.7 South America - Market size and forecast 2024-2029
- Chart on South America - Market size and forecast 2024-2029 ($ million)
- Data Table on South America - Market size and forecast 2024-2029 ($ million)
- Chart on South America - Year-over-year growth 2024-2029 (%)
- Data Table on South America - Year-over-year growth 2024-2029 (%)
- 13.8 US - Market size and forecast 2024-2029
- Chart on US - Market size and forecast 2024-2029 ($ million)
- Data Table on US - Market size and forecast 2024-2029 ($ million)
- Chart on US - Year-over-year growth 2024-2029 (%)
- Data Table on US - Year-over-year growth 2024-2029 (%)
- 13.9 China - Market size and forecast 2024-2029
- Chart on China - Market size and forecast 2024-2029 ($ million)
- Data Table on China - Market size and forecast 2024-2029 ($ million)
- Chart on China - Year-over-year growth 2024-2029 (%)
- Data Table on China - Year-over-year growth 2024-2029 (%)
- 13.10 Canada - Market size and forecast 2024-2029
- Chart on Canada - Market size and forecast 2024-2029 ($ million)
- Data Table on Canada - Market size and forecast 2024-2029 ($ million)
- Chart on Canada - Year-over-year growth 2024-2029 (%)
- Data Table on Canada - Year-over-year growth 2024-2029 (%)
- 13.11 India - Market size and forecast 2024-2029
- Chart on India - Market size and forecast 2024-2029 ($ million)
- Data Table on India - Market size and forecast 2024-2029 ($ million)
- Chart on India - Year-over-year growth 2024-2029 (%)
- Data Table on India - Year-over-year growth 2024-2029 (%)
- 13.12 Japan - Market size and forecast 2024-2029
- Chart on Japan - Market size and forecast 2024-2029 ($ million)
- Data Table on Japan - Market size and forecast 2024-2029 ($ million)
- Chart on Japan - Year-over-year growth 2024-2029 (%)
- Data Table on Japan - Year-over-year growth 2024-2029 (%)
- 13.13 Germany - Market size and forecast 2024-2029
- Chart on Germany - Market size and forecast 2024-2029 ($ million)
- Data Table on Germany - Market size and forecast 2024-2029 ($ million)
- Chart on Germany - Year-over-year growth 2024-2029 (%)
- Data Table on Germany - Year-over-year growth 2024-2029 (%)
- 13.14 Saudi Arabia - Market size and forecast 2024-2029
- Chart on Saudi Arabia - Market size and forecast 2024-2029 ($ million)
- Data Table on Saudi Arabia - Market size and forecast 2024-2029 ($ million)
- Chart on Saudi Arabia - Year-over-year growth 2024-2029 (%)
- Data Table on Saudi Arabia - Year-over-year growth 2024-2029 (%)
- 13.15 South Korea - Market size and forecast 2024-2029
- Chart on South Korea - Market size and forecast 2024-2029 ($ million)
- Data Table on South Korea - Market size and forecast 2024-2029 ($ million)
- Chart on South Korea - Year-over-year growth 2024-2029 (%)
- Data Table on South Korea - Year-over-year growth 2024-2029 (%)
- 13.16 UK - Market size and forecast 2024-2029
- Chart on UK - Market size and forecast 2024-2029 ($ million)
- Data Table on UK - Market size and forecast 2024-2029 ($ million)
- Chart on UK - Year-over-year growth 2024-2029 (%)
- Data Table on UK - Year-over-year growth 2024-2029 (%)
- 13.17 UAE - Market size and forecast 2024-2029
- Chart on UAE - Market size and forecast 2024-2029 ($ million)
- Data Table on UAE - Market size and forecast 2024-2029 ($ million)
- Chart on UAE - Year-over-year growth 2024-2029 (%)
- Data Table on UAE - Year-over-year growth 2024-2029 (%)
- 13.18 Market opportunity by geography
- Market opportunity by geography ($ million)
- Data Tables on Market opportunity by geography ($ million)
- 13.19 Brazil - Market size and forecast (2024-2029)
- Chart on Brazil - Market size and forecast (2024-2029) ($ million)
- Data Table on Brazil - Market size and forecast (2024-2029) ($ million)
- Chart on Brazil - Year-over-year growth (2024-2029) (%)
- Data Table on Brazil - Year-over-year growth (2024-2029) (%)
- 13.20 Rest of World (ROW) - Market size and forecast (2024-2029)
- Chart on Rest of World (ROW) - Market size and forecast (2024-2029) ($ million)
- Data Table on Rest of World (ROW) - Market size and forecast (2024-2029) ($ million)
- Chart on Rest of World (ROW) - Year-over-year growth (2024-2029) (%)
- Data Table on Rest of World (ROW) - Year-over-year growth (2024-2029) (%)
14 Drivers, Challenges, and Opportunity/Restraints
- 14.3 Impact of drivers and challenges
- Impact of drivers and challenges in 2024 and 2029
- 14.4 Market opportunities/restraints
15 Competitive Landscape
- 15.2 Competitive Landscape
- Overview on criticality of inputs and factors of differentiation
- 15.3 Landscape disruption
- Overview on factors of disruption
- 15.4 Industry risks
- Impact of key risks on business
16 Competitive Analysis
- 16.2 Company ranking index
- 16.3 Market positioning of companies
- Matrix on companies position and classification
- 16.4 Advanced HPC Inc.
- Advanced HPC Inc. - Overview
- Advanced HPC Inc. - Product / Service
- Advanced HPC Inc. - Key offerings
- SWOT
- 16.5 Advantech Co. Ltd.
- Advantech Co. Ltd. - Overview
- Advantech Co. Ltd. - Business segments
- Advantech Co. Ltd. - Key news
- Advantech Co. Ltd. - Key offerings
- Advantech Co. Ltd. - Segment focus
- SWOT
- 16.6 Areca Technology Corp.
- Areca Technology Corp. - Overview
- Areca Technology Corp. - Product / Service
- Areca Technology Corp. - Key offerings
- SWOT
- 16.7 Broadcom Inc.
- Broadcom Inc. - Overview
- Broadcom Inc. - Business segments
- Broadcom Inc. - Key news
- Broadcom Inc. - Key offerings
- Broadcom Inc. - Segment focus
- SWOT
- 16.8 Cisco Systems Inc.
- Cisco Systems Inc. - Overview
- Cisco Systems Inc. - Business segments
- Cisco Systems Inc. - Key news
- Cisco Systems Inc. - Key offerings
- Cisco Systems Inc. - Segment focus
- SWOT
- 16.9 Dell Technologies Inc.
- Dell Technologies Inc. - Overview
- Dell Technologies Inc. - Business segments
- Dell Technologies Inc. - Key news
- Dell Technologies Inc. - Key offerings
- Dell Technologies Inc. - Segment focus
- SWOT
- 16.10 Fujitsu Ltd.
- Fujitsu Ltd. - Overview
- Fujitsu Ltd. - Business segments
- Fujitsu Ltd. - Key news
- Fujitsu Ltd. - Key offerings
- Fujitsu Ltd. - Segment focus
- SWOT
- 16.11 Hewlett Packard Enterprise Co.
- Hewlett Packard Enterprise Co. - Overview
- Hewlett Packard Enterprise Co. - Business segments
- Hewlett Packard Enterprise Co. - Key news
- Hewlett Packard Enterprise Co. - Key offerings
- Hewlett Packard Enterprise Co. - Segment focus
- SWOT
- 16.12 HighPoint Inc.
- HighPoint Inc. - Overview
- HighPoint Inc. - Product / Service
- HighPoint Inc. - Key offerings
- SWOT
- 16.13 Huawei Technologies Co. Ltd.
- Huawei Technologies Co. Ltd. - Overview
- Huawei Technologies Co. Ltd. - Product / Service
- Huawei Technologies Co. Ltd. - Key news
- Huawei Technologies Co. Ltd. - Key offerings
- SWOT
- 16.14 Intel Corp.
- Intel Corp. - Overview
- Intel Corp. - Business segments
- Intel Corp. - Key news
- Intel Corp. - Key offerings
- Intel Corp. - Segment focus
- SWOT
- 16.15 International Business Machines Corp.
- International Business Machines Corp. - Overview
- International Business Machines Corp. - Business segments
- International Business Machines Corp. - Key news
- International Business Machines Corp. - Key offerings
- International Business Machines Corp. - Segment focus
- SWOT
- 16.16 Lenovo Group Ltd.
- Lenovo Group Ltd. - Overview
- Lenovo Group Ltd. - Business segments
- Lenovo Group Ltd. - Key news
- Lenovo Group Ltd. - Key offerings
- Lenovo Group Ltd. - Segment focus
- SWOT
- 16.17 Marvell Technology Inc.
- Marvell Technology Inc. - Overview
- Marvell Technology Inc. - Product / Service
- Marvell Technology Inc. - Key offerings
- SWOT
- 16.18 NEC Corp.
- NEC Corp. - Overview
- NEC Corp. - Business segments
- NEC Corp. - Key news
- NEC Corp. - Key offerings
- NEC Corp. - Segment focus
- SWOT
17 Appendix
- 17.2 Inclusions and exclusions checklist
- Inclusions checklist
- Exclusions checklist
- 17.3 Currency conversion rates for US$
- Currency conversion rates for US$
- 17.4 Research methodology
- 17.7 Validation techniques employed for market sizing
- Validation techniques employed for market sizing
- 17.9 360 degree market analysis
- 360 degree market analysis
- 17.10 List of abbreviations