
Connected Rail Solutions Market Size 2025-2029
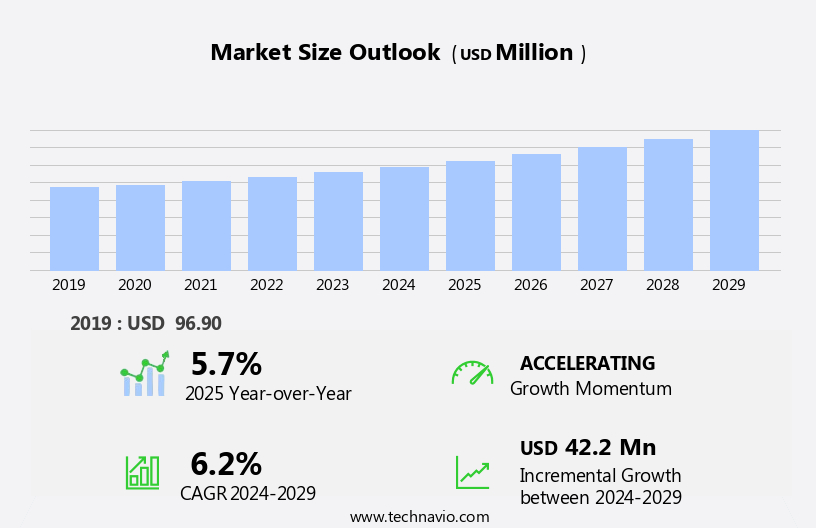
The connected rail solutions market size is forecast to increase by USD 42.2 million at a CAGR of 6.2% between 2024 and 2029.
- The market is experiencing significant growth due to the increasing adoption of technologically advanced connected devices in the rail industry. This trend is being driven by the emergence of smart cities globally, where efficient and interconnected transportation systems are a priority. Connected rail solutions offer numerous benefits, including improved safety, enhanced passenger experience, and increased operational efficiency. However, the high cost of implementation remains a significant challenge for market growth. Rail operators must carefully weigh the initial investment against the long-term cost savings and operational improvements. Despite this challenge, the market presents numerous opportunities for companies seeking to capitalize on the growing demand for smart and connected transportation solutions.
- Strategic partnerships, collaborations, and innovative financing models can help mitigate the cost barrier and accelerate market penetration. Companies that can effectively navigate these challenges and provide compelling value propositions to rail operators will be well-positioned to succeed in this dynamic and growing market.
What will be the Size of the Connected Rail Solutions Market during the forecast period?
- Understanding the Evolution of Rail Transportation: IOT, Green Technology, and Advanced Systems The rail transport system is undergoing a significant transformation, driven by the integration of IoT technology and a shift towards green transportation. Passenger wagons and freight wagons are being equipped with intelligent onboard devices and IoT sensors to optimize train schedules, enhance train management systems, and improve network control center functionality. Cloud-based applications, communication-based train control, and telecommunication technology providers are playing pivotal roles in this evolution. Network connectivity, including wi-fi facilities and telecommunications networks, is essential for enabling real-time data exchange and analysis.
- Control systems are becoming more advanced, with machine learning (ML) and artificial intelligence (AI) integration enabling predictive maintenance and performance optimization. Global positioning systems and information announcement systems are also crucial components, ensuring efficient train operations and passenger comfort. Monitoring stations and computing systems are being upgraded to process and analyze vast amounts of data, providing valuable insights for network optimization and capacity planning. The rail display system is another key area of focus, with interactive and informative displays enhancing the passenger experience. In this dynamic market, rail transport is poised for growth, with a focus on sustainability, efficiency, and passenger comfort.
- Stay informed with the latest industry trends and insights from leading market research publishers, including FMI, Nielsen, Goldman Sachs, and others.
How is this Connected Rail Solutions Industry segmented?
The connected rail solutions industry research report provides comprehensive data (region-wise segment analysis), with forecasts and estimates in "USD million" for the period 2025-2029, as well as historical data from 2019-2023 for the following segments.
- Safety And Signaling System
- CBTC
- PTC
- ATC
- Deployment
- On-premises
- Cloud-based
- Service
- Passenger mobility
- Train tracking and monitoring
- Others
- Type
- Electric locomotive
- Diesel locomotive
- Passenger wagons
- Others
- Geography
- North America
- US
- Canada
- Europe
- France
- Germany
- Russia
- UK
- APAC
- China
- India
- Japan
- South America
- Brazil
- North America
By Safety And Signaling System Insights
The cbtc segment is estimated to witness significant growth during the forecast period.
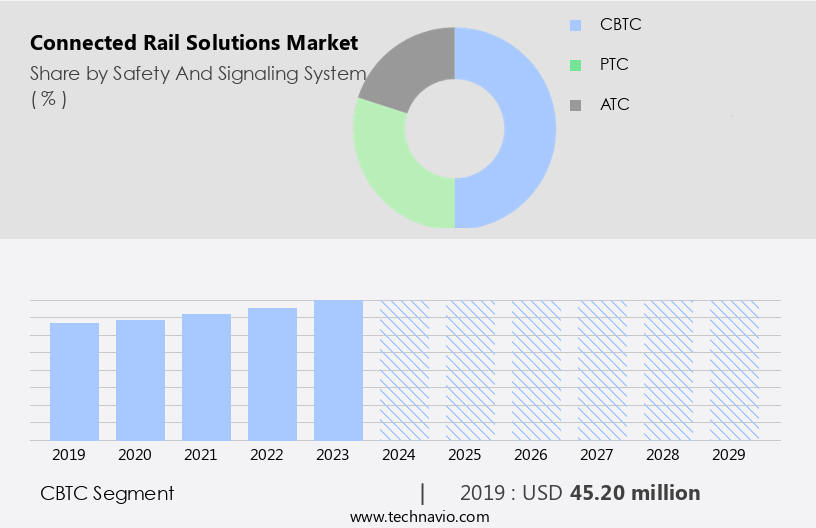
The CBTC segment was valued at USD 45.20 million in 2019 and showed a gradual increase during the forecast period.
Regional Analysis
APAC is estimated to contribute 33% to the growth of the global market during the forecast period.Technavio’s analysts have elaborately explained the regional trends and drivers that shape the market during the forecast period.

In Europe, railways serve as a major transportation medium, transporting approximately 9.5 billion passengers annually. Key players in this sector include ALSTOM, Siemens, and Thales. The railway industry in Europe has undergone significant technological advancements, with the Internet of Things (IoT) being a driving force. From 2022 to 2024, European railway operators and government agencies have initiated digitization programs, integrating IoT into various railway systems. This includes passenger information systems, ticketing departments, and train management systems. Additionally, the adoption of advanced analytics, communication-based train control, and automated train operations enhances passenger mobility and safety. Telecommunications companies and Global positioning systems play a crucial role in ensuring network connectivity and train schedules.
The integration of predictive maintenance, intelligent onboard devices, and machine learning further optimizes railway operations. The railway sector's digitization also extends to green transportation initiatives, such as Positive Train Control and automated trains, reducing carbon emissions. Furthermore, the integration of Wi-Fi facilities, entertainment facilities, and last-mile connectivity improves the overall passenger experience. Freight transportation, including electric and diesel locomotives, freight wagons, and dedicated freight corridors, also benefits from these technological advancements.
Market Dynamics
Our researchers analyzed the data with 2024 as the base year, along with the key drivers, trends, and challenges. A holistic analysis of drivers will help companies refine their marketing strategies to gain a competitive advantage.
What are the key market drivers leading to the rise in the adoption of Connected Rail Solutions Industry?
- The primary catalyst fueling market growth is the expanding usage of technologically sophisticated, interconnected devices.
- The global railway industry has witnessed a significant shift towards connected rail solutions, driven by the increasing preference for technologically advanced devices among end-users. With the rapid rise in smartphone sales over the past few years, individuals have become accustomed to using mobile devices for both personal and professional purposes. This trend has encouraged railway operators to adopt connected devices that can bridge the gap between railway operations and end-customers. Connected rail solutions offer several advantages, including improved user interfaces and real-time information updates. The use of high-processing speed mobile devices, such as smartphones and tablets, has further boosted the adoption of these solutions.
- End-users can now access real-time information on train schedules, weather forecasts, and directions to nearby stations through mobile apps. Connected rail solutions have become an essential tool for railway operators to enhance customer experience and streamline operations. These solutions enable seamless communication between railway infrastructure and end-customers, ensuring a more efficient and convenient travel experience. The adoption of connected rail solutions is expected to continue growing as railway operators seek to meet the evolving demands of their customers and stay competitive in the market.
What are the market trends shaping the Connected Rail Solutions Industry?
- The global trend in urban development is the emergence of smart cities, characterized by the integration of technology into infrastructure and services to enhance efficiency, sustainability, and quality of life for residents.
- Smart cities represent the integration of various digital technologies to facilitate seamless communication among connected devices, enhance performance, reduce costs, and promote efficient resource utilization. Key features of smart cities include automatic traffic control, home monitoring, e-toll systems, waste management, IP-based centralized video surveillance, water management, and intelligent transportation. The growth of smart cities is driven by the increasing demand for efficient urban infrastructure and the need to address the challenges faced by urban settlements. According to recent research, the number of smart cities is anticipated to expand significantly during the forecast period.
- For instance, the Saudi Arabian government plans to invest in the development of King Abdullah Economic City, a smart city, during this timeframe. Smart cities play a crucial role in enabling railway operators to effectively respond to the challenges posed by urbanization.
What challenges does the Connected Rail Solutions Industry face during its growth?
- The high cost of implementation poses a significant challenge to the industry's growth. This factor, which is mandatory to consider, can hinder progress and development in the sector.
- Connected rail solutions have gained significant attention in the railway industry due to their potential to automate operations and bring consistency in processes. However, the deployment of these solutions comes with substantial costs. One of the major challenges is the increase in installation costs for large-scale railway projects, which have been a concern for both companies and end-users. Additionally, monitoring and controlling ongoing projects require high connectivity and data-capturing devices, adding to the expenses. Despite these challenges, the benefits of connected rail solutions, such as improved efficiency and consistency, are compelling.
- The railway industry continues to invest in these technologies to enhance operational performance and meet evolving passenger demands. The integration of advanced technologies like IoT, AI, and machine learning is expected to further drive the growth of the market. However, the high cost of deployment and maintenance remains a significant barrier to entry for many players.
Exclusive Customer Landscape
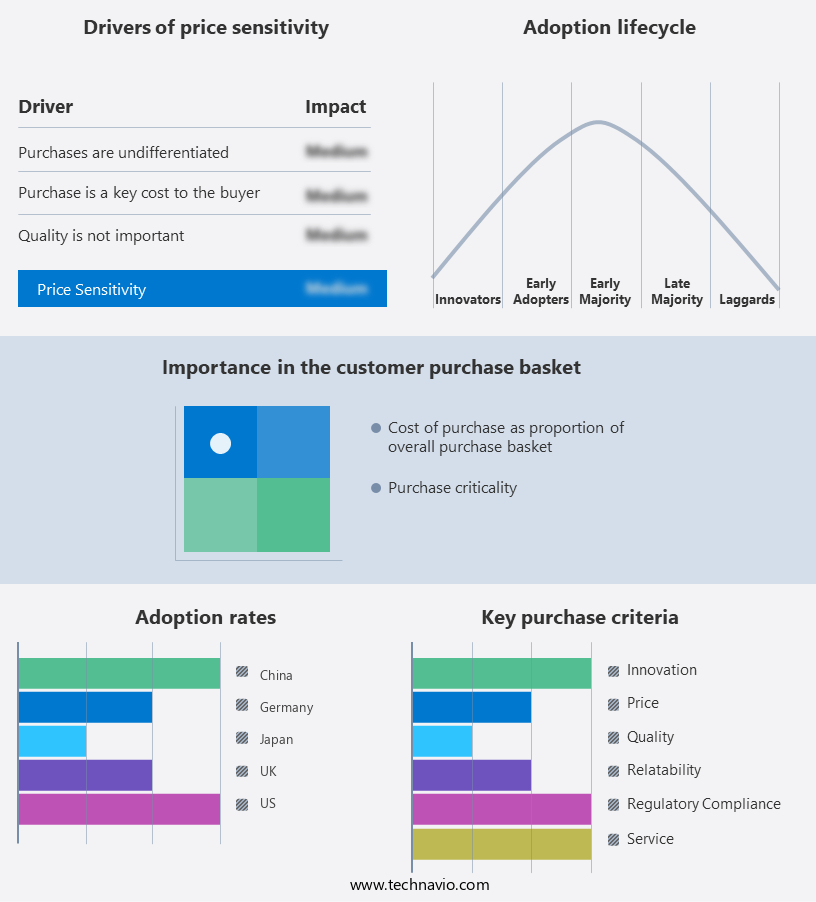
The connected rail solutions market forecasting report includes the adoption lifecycle of the market, covering from the innovator’s stage to the laggard’s stage. It focuses on adoption rates in different regions based on penetration. Furthermore, the connected rail solutions market report also includes key purchase criteria and drivers of price sensitivity to help companies evaluate and develop their market growth analysis strategies.
Customer Landscape
Key Companies & Market Insights
Companies are implementing various strategies, such as strategic alliances, connected rail solutions market forecast, partnerships, mergers and acquisitions, geographical expansion, and product/service launches, to enhance their presence in the industry.
ABB Ltd. - The company specializes in providing integrated rail solutions, encompassing advanced traction systems and components for rolling stock, propulsion technology, control and signaling systems, and traction power supply. Our offerings ensure optimal rail performance and efficiency, enhancing safety and reliability for clients worldwide. With a focus on innovation and technological advancements, we deliver cutting-edge solutions to meet the evolving demands of the global rail industry.
The industry research and growth report includes detailed analyses of the competitive landscape of the market and information about key companies, including:
- ABB Ltd.
- ALSTOM SA
- Atos SE
- CalAmp Corp.
- Cisco Systems Inc.
- Digi International Inc.
- General Electric Co.
- Hitachi Ltd.
- Huawei Technologies Co. Ltd.
- Indra Sistemas SA
- Mitsubishi Electric Corp.
- Nokia Corp.
- Robert Bosch GmbH
- Schneider Electric SE
- Siemens AG
- Sierra Wireless Inc.
- Thales Group
- Toshiba Corp.
- Trimble Inc.
- Westinghouse Air Brake Technologies Corp.
Qualitative and quantitative analysis of companies has been conducted to help clients understand the wider business environment as well as the strengths and weaknesses of key industry players. Data is qualitatively analyzed to categorize companies as pure play, category-focused, industry-focused, and diversified; it is quantitatively analyzed to categorize companies as dominant, leading, strong, tentative, and weak.
Recent Development and News in Connected Rail Solutions Market
- The market has witnessed significant developments in the recent years, shaping the industry landscape with new innovations and strategic collaborations. Here are four key developments that have marked the market: In Q1 2025, Bombardier Transportation, a global leader in rail technology, launched its new Connected Rail Services solution, which offers real-time data analytics and predictive maintenance capabilities. This solution aims to improve operational efficiency and enhance passenger experience for rail operators (Bombardier Transportation Press Release, 2025). In Q3 2024, Siemens Mobility and Deutsche Telekom AG announced a strategic partnership to develop 5G-enabled rail solutions. This collaboration focuses on integrating 5G technology into trains and infrastructure to provide high-speed connectivity for passengers and improve operational efficiency (Siemens Mobility Press Release, 2024).
- In H1 2024, Hitachi Rail Italy acquired a majority stake in AnsaldoBreda, a leading Italian rail vehicle manufacturer. This merger aims to expand Hitachi's portfolio of connected rail solutions and strengthen its presence in the European rail market (Hitachi Rail Italy Press Release, 2024). In Q4 2023, Alstom signed a memorandum of understanding with Microsoft to develop a cloud-based solution for rail operations. This collaboration will enable Alstom to leverage Microsoft's Azure platform for data processing and analysis, improving the efficiency and reliability of rail services (Alstom Press Release, 2023). These developments demonstrate the growing importance of connected rail solutions in enhancing operational efficiency, passenger experience, and safety within the rail industry.
- With continuous advancements in technology and strategic collaborations, the market is expected to witness significant growth in the coming years. (Technavio Research Report, 2023)
Research Analyst Overview
The market is witnessing significant growth as the global rail transportation sector embraces digitization and automation to enhance efficiency, safety, and passenger experience. The integration of advanced technologies such as cloud, telecommunications, and the Internet of Things (IoT) is transforming city rail transportation and inter-state trade by enabling real-time monitoring, predictive maintenance, and automated train operations. Passengers are at the heart of this transformation, with passenger information systems becoming increasingly sophisticated. These systems provide real-time updates on train schedules, delays, and platform information, improving the overall passenger experience. Telecommunications companies and rail operators are collaborating to provide seamless network connectivity, ensuring passengers remain connected throughout their journey.
The rail industry's shift towards green transportation is also driving the adoption of connected rail solutions. Advanced analytics and machine learning (ML) are being used to optimize train schedules and improve network control center operations, reducing energy consumption and minimizing delays. The integration of intelligent onboard devices and automated train control systems is revolutionizing train management. These systems enable real-time monitoring of train performance, predictive maintenance, and automated fare collection, streamlining operations and enhancing safety. The rail sector's digitization is also extending to freight transportation. Dedicated freight corridors and automated trains are being implemented to improve freight mobility and reduce transportation costs.
IoT sensors are being used to monitor freight wagons and rolling stock, ensuring optimal performance and reducing maintenance costs. The use of computer-based train control and communication-based train control systems is enabling automated train operations, reducing the need for human intervention and improving safety. Rail signaling systems are being upgraded to provide real-time information and improve network efficiency. The integration of entertainment facilities and last-mile connectivity is enhancing the passenger experience further. Wi-fi facilities and automated fare collection systems are becoming standard features in modern passenger wagons, providing passengers with a more comfortable and convenient travel experience. The rail transport system's digitization is also enabling multimodality platforms, allowing passengers to seamlessly transition between rail, road, and maritime transportation.
Telecommunication technology providers are playing a crucial role in enabling this integration, providing the necessary network connectivity and enabling real-time data exchange between different modes of transportation. The rail industry's transformation is also extending to green transportation, with positive train control systems being implemented to reduce emissions and improve safety. Big data and rail signaling systems are being used to optimize train schedules and improve network efficiency, reducing energy consumption and minimizing delays. In conclusion, the market is experiencing significant growth as the rail transportation sector embraces digitization and automation to enhance efficiency, safety, and passenger experience. The integration of advanced technologies such as cloud, telecommunications, and the Internet of Things (IoT) is transforming city rail transportation and inter-state trade by enabling real-time monitoring, predictive maintenance, and automated train operations.
The focus on green transportation and multimodality platforms is further enhancing the passenger experience and reducing transportation costs.
Dive into Technavio’s robust research methodology, blending expert interviews, extensive data synthesis, and validated models for unparalleled Connected Rail Solutions Market insights. See full methodology.
|
Market Scope |
|
|
Report Coverage |
Details |
|
Page number |
251 |
|
Base year |
2024 |
|
Historic period |
2019-2023 |
|
Forecast period |
2025-2029 |
|
Growth momentum & CAGR |
Accelerate at a CAGR of 6.2% |
|
Market growth 2025-2029 |
USD 42.2 million |
|
Market structure |
Fragmented |
|
YoY growth 2024-2025(%) |
5.7 |
|
Key countries |
US, Germany, China, France, India, UK, Canada, Japan, Russia, and Brazil |
|
Competitive landscape |
Leading Companies, Market Positioning of Companies, Competitive Strategies, and Industry Risks |
What are the Key Data Covered in this Connected Rail Solutions Market Research and Growth Report?
- CAGR of the Connected Rail Solutions industry during the forecast period
- Detailed information on factors that will drive the growth and forecasting between 2025 and 2029
- Precise estimation of the size of the market and its contribution of the industry in focus to the parent market
- Accurate predictions about upcoming growth and trends and changes in consumer behaviour
- Growth of the market across Europe, APAC, North America, Middle East and Africa, and South America
- Thorough analysis of the market’s competitive landscape and detailed information about companies
- Comprehensive analysis of factors that will challenge the connected rail solutions market growth of industry companies
We can help! Our analysts can customize this connected rail solutions market research report to meet your requirements.
 RIA -
RIA - 
