Raman Spectroscopy Market Size 2026-2030
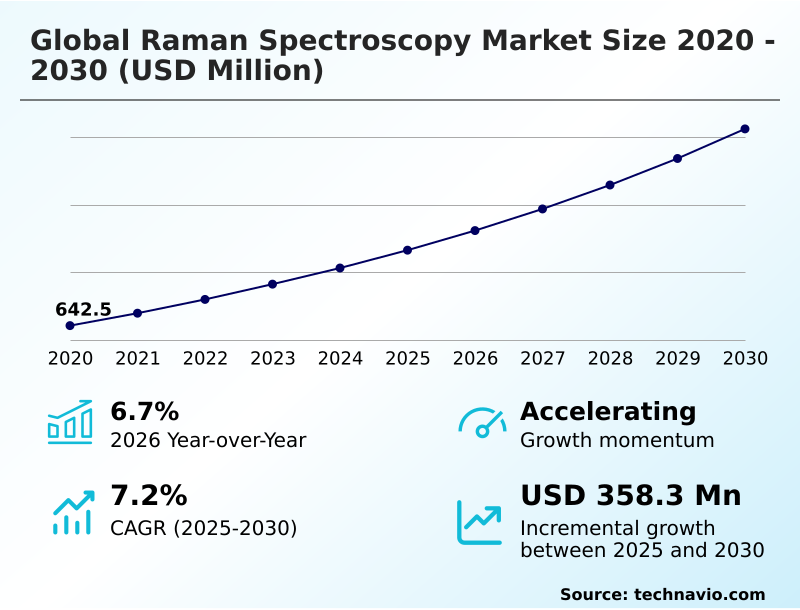
The raman spectroscopy market size is valued to increase by USD 358.3 million, at a CAGR of 7.2% from 2025 to 2030. Increasing demand from pharmaceutical and biotechnology industries will drive the raman spectroscopy market.
Major Market Trends & Insights
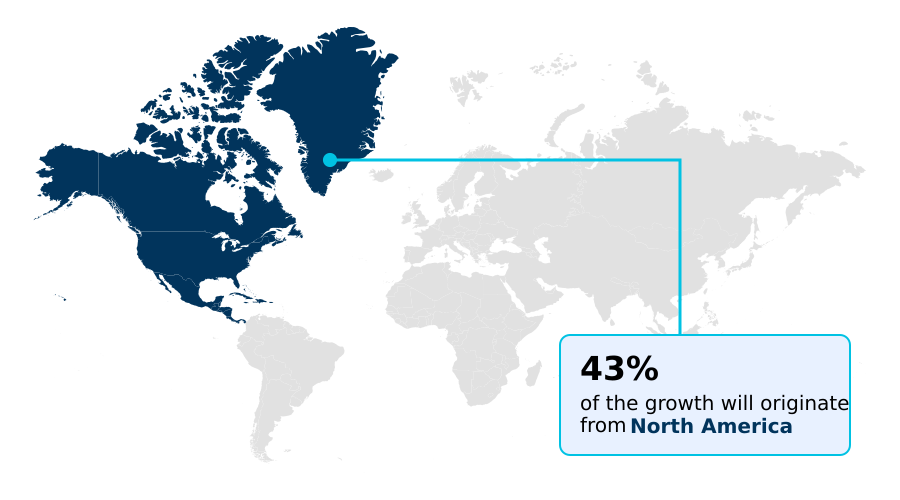
- North America dominated the market and accounted for a 43.1% growth during the forecast period.
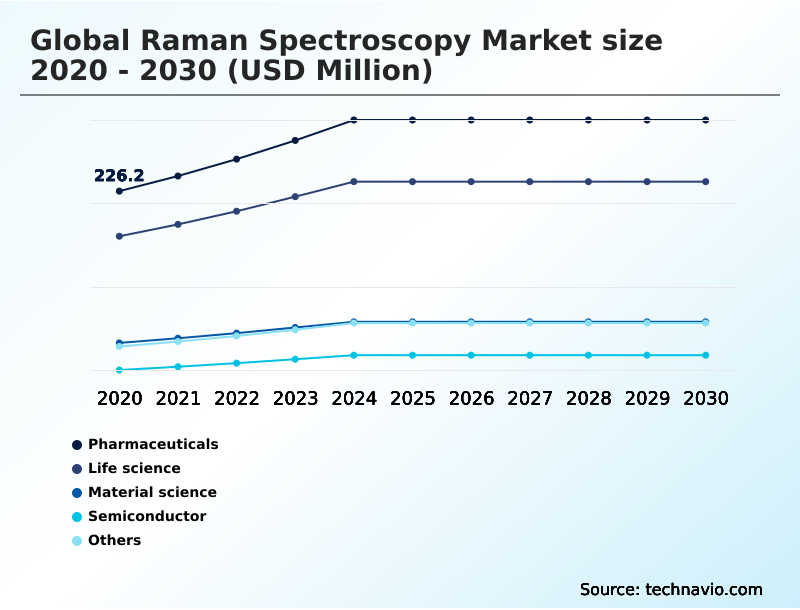
- By Application - Pharmaceuticals segment was valued at USD 291.6 million in 2024
- By Type - Benchtop segment accounted for the largest market revenue share in 2024
Market Size & Forecast
- Market Opportunities: USD 581.2 million
- Market Future Opportunities: USD 358.3 million
- CAGR from 2025 to 2030 : 7.2%
Market Summary
- The raman spectroscopy market is defined by its role in providing rapid, non-destructive chemical analysis across diverse sectors. A key driver is the escalating demand from pharmaceutical and biotechnology industries, where process analytical technology (pat) mandates for in-line monitoring are becoming standard.
- This allows for real-time quality control, such as a manufacturer verifying raw material identity directly on the loading dock, which improves supply chain efficiency by over 90% compared to traditional lab testing. A parallel trend is the miniaturization leading to powerful handheld raman spectrometer units for point-of-need testing in security and food safety.
- This expansion of use cases is enabled by continuous innovation in components like the charge-coupled device (ccd) detector and advanced chemometrics software that simplifies data interpretation. However, adoption is tempered by inherent technical challenges such as fluorescence interference, which can obscure the molecular fingerprinting signal in certain organic samples, and the high initial capital cost of high-performance systems.
What will be the Size of the Raman Spectroscopy Market during the forecast period?
Get Key Insights on Market Forecast (PDF) Get Free Sample
How is the Raman Spectroscopy Market Segmented?
The raman spectroscopy industry research report provides comprehensive data (region-wise segment analysis), with forecasts and estimates in "USD million" for the period 2026-2030, as well as historical data from 2020-2024 for the following segments.
- Application
- Pharmaceuticals
- Life science
- Material science
- Semiconductor
- Others
- Type
- Benchtop
- Portable
- Technique
- Surface enhanced
- Tip enhanced
- Geography
- North America
- US
- Canada
- Mexico
- Europe
- Germany
- UK
- France
- Asia
- Rest of World (ROW)
- North America
By Application Insights
The pharmaceuticals segment is estimated to witness significant growth during the forecast period.
The pharmaceuticals segment is a primary user of vibrational spectroscopy, driven by stringent regulatory needs for robust quality control. Applications of a benchtop raman system span the entire drug lifecycle, from R&D activities like polymorph screening to final product verification.
The integration of process analytical technology (pat) allows for real-time monitoring of manufacturing, where quantitative analysis of active ingredients ensures consistency and reduces batch failures by up to 15%. This capability is critical for maintaining compliance and operational efficiency.
Furthermore, the technology is pivotal for raw material identification upon receipt and plays a key role in blend uniformity monitoring and combating counterfeit drug detection through rapid, non-invasive screening, securing the integrity of the supply chain.
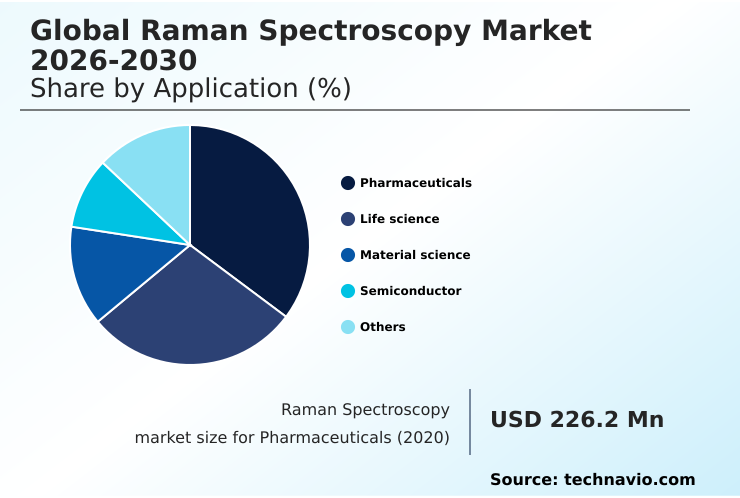
The Pharmaceuticals segment was valued at USD 291.6 million in 2024 and showed a gradual increase during the forecast period.
Regional Analysis
North America is estimated to contribute 43.1% to the growth of the global market during the forecast period.Technavio’s analysts have elaborately explained the regional trends and drivers that shape the market during the forecast period.
See How Raman Spectroscopy Market Demand is Rising in North America Get Free Sample
The global raman spectroscopy market exhibits a distinct geographic distribution, with North America accounting for over 43% of the incremental growth, primarily driven by its advanced pharmaceutical sector and stringent regulatory environment.
Europe follows with a 30% contribution, supported by a strong research base and high-tech industries utilizing techniques like confocal raman microscopy for advanced materials and spatially offset raman spectroscopy (sors) for non-invasive screening.
Asia is the fastest-growing region, with its dominance in semiconductor manufacturing creating significant demand for tip-enhanced raman spectroscopy (ters) and surface-enhanced raman spectroscopy (sers) in nanomaterial analysis.
This regional demand is complemented by niche applications in forensic science applications, biomedical diagnostics, and cultural heritage analysis, diversifying the global landscape.
Market Dynamics
Our researchers analyzed the data with 2025 as the base year, along with the key drivers, trends, and challenges. A holistic analysis of drivers will help companies refine their marketing strategies to gain a competitive advantage.
- The expanding utility of the global raman spectroscopy market 2026-2030 is highlighted by a range of specific, high-impact use cases. The technique is essential for raman spectroscopy for pharmaceutical qc, where it ensures product quality from raw material verification to final dosage form analysis.
- In law enforcement, handheld raman for narcotics identification provides officers with critical, real-time intelligence in the field. The development of advanced modalities is opening new frontiers in healthcare, with sers for early disease biomarker detection showing immense promise for minimally invasive diagnostics.
- In materials science, raman microscopy for graphene characterization is the standard for quality assessment, while semiconductor stress analysis with raman is vital for ensuring the reliability of microelectronic devices. The process analytical technology raman probe is a cornerstone of modern manufacturing, enabling the in-situ monitoring of crystallization processes and real-time fermentation process monitoring.
- When evaluating analytical tools, the raman vs ftir for polymer analysis comparison often favors raman for its superior performance with aqueous samples. This versatility extends to non-destructive testing with portable raman and through-container screening using sors, which improves throughput by over 90% compared to destructive methods.
- The use of raman spectral libraries for forensics enhances criminal investigations, while tip-enhanced raman for nanoscale imaging pushes the boundaries of research. Other key applications include quantitative modeling with raman data, verifying api concentration using raman, raman analysis of battery electrode materials, raman spectroscopy in art conservation, and detecting microplastics in water samples.
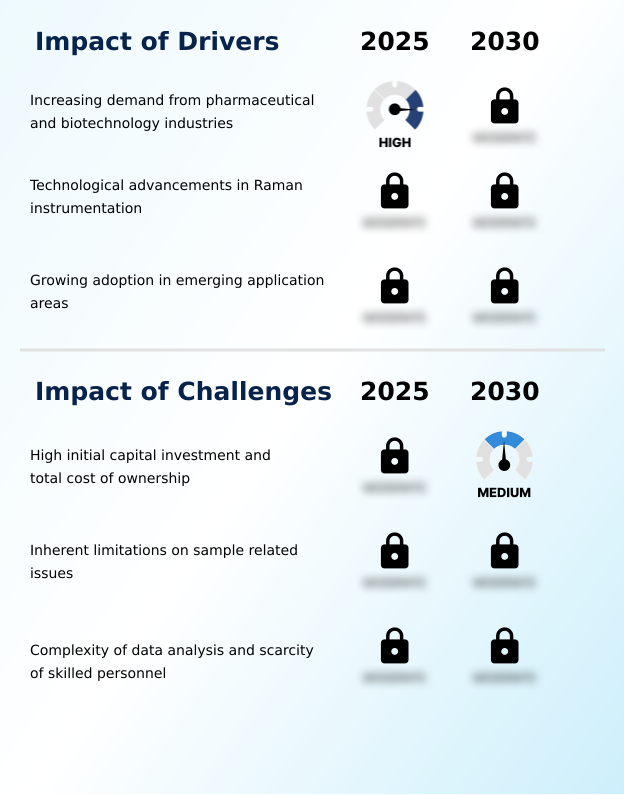
What are the key market drivers leading to the rise in the adoption of Raman Spectroscopy Industry?
- Increasing demand from the pharmaceutical and biotechnology industries, driven by stringent quality control and process analytical technology requirements, serves as a key market driver.
- Market expansion is primarily fueled by the technology's inherent strengths in providing detailed molecular fingerprinting through raman scattering. The demand for non-destructive analysis is paramount in pharmaceutical and life science sectors, where in-situ analysis is critical for real-time process monitoring.
- This adoption within manufacturing streamlines operations, reducing process deviations by as much as 15%.
- Beyond pharmaceuticals, the growing emphasis on food safety assurance has expanded applications, with portable systems offering a 25% faster detection of contaminants compared to traditional lab methods.
- Furthermore, the technique’s utility in material characterization is unlocking new opportunities in environmental monitoring and geological exploration, where rapid, on-site identification of substances is essential for timely and informed decision-making.
What are the market trends shaping the Raman Spectroscopy Industry?
- A defining market trend is the ongoing miniaturization of components, leading to the proliferation of portable and handheld Raman systems. This shift enables real-time, point-of-need analysis across various field-based applications.
- Key trends are reshaping the accessibility and application scope of Raman technology. The proliferation of the handheld raman spectrometer, equipped with an expanding spectral library, is enabling rapid point-of-need testing for applications ranging from chemical threat identification to quality control, improving field-based decision-making by over 95%.
- Concurrently, the integration of advanced chemometrics and AI is automating complex data interpretation, enhancing spectral matching accuracy by up to 20%. This allows for more sophisticated raman imaging and label-free cellular imaging in life sciences.
- These software advancements improve the signal-to-noise ratio in complex samples and are critical for enabling robust in-line process control in industrial settings, making the technology more powerful for non-specialist users.
What challenges does the Raman Spectroscopy Industry face during its growth?
- The high initial capital investment required for Raman instrumentation, coupled with the total cost of ownership, presents a key challenge affecting broader market adoption.
- Despite its advantages, market adoption faces technical and financial hurdles. The phenomenon of fluorescence interference remains a primary challenge, capable of reducing the signal-to-noise ratio by over 99% in certain samples and requiring mitigation strategies like adjusting the laser excitation wavelength or using specialized charge-coupled device (ccd) detectors. This adds complexity and cost.
- High-end systems can represent a capital expenditure 50% greater than alternative technologies, posing a barrier for smaller labs. Furthermore, achieving high spectral resolution for complex tasks like semiconductor strain analysis or trace material detection often necessitates advanced and costly sers substrates. Even applications such as coating thickness measurement and aqueous solution analysis require careful optimization to overcome these inherent limitations.
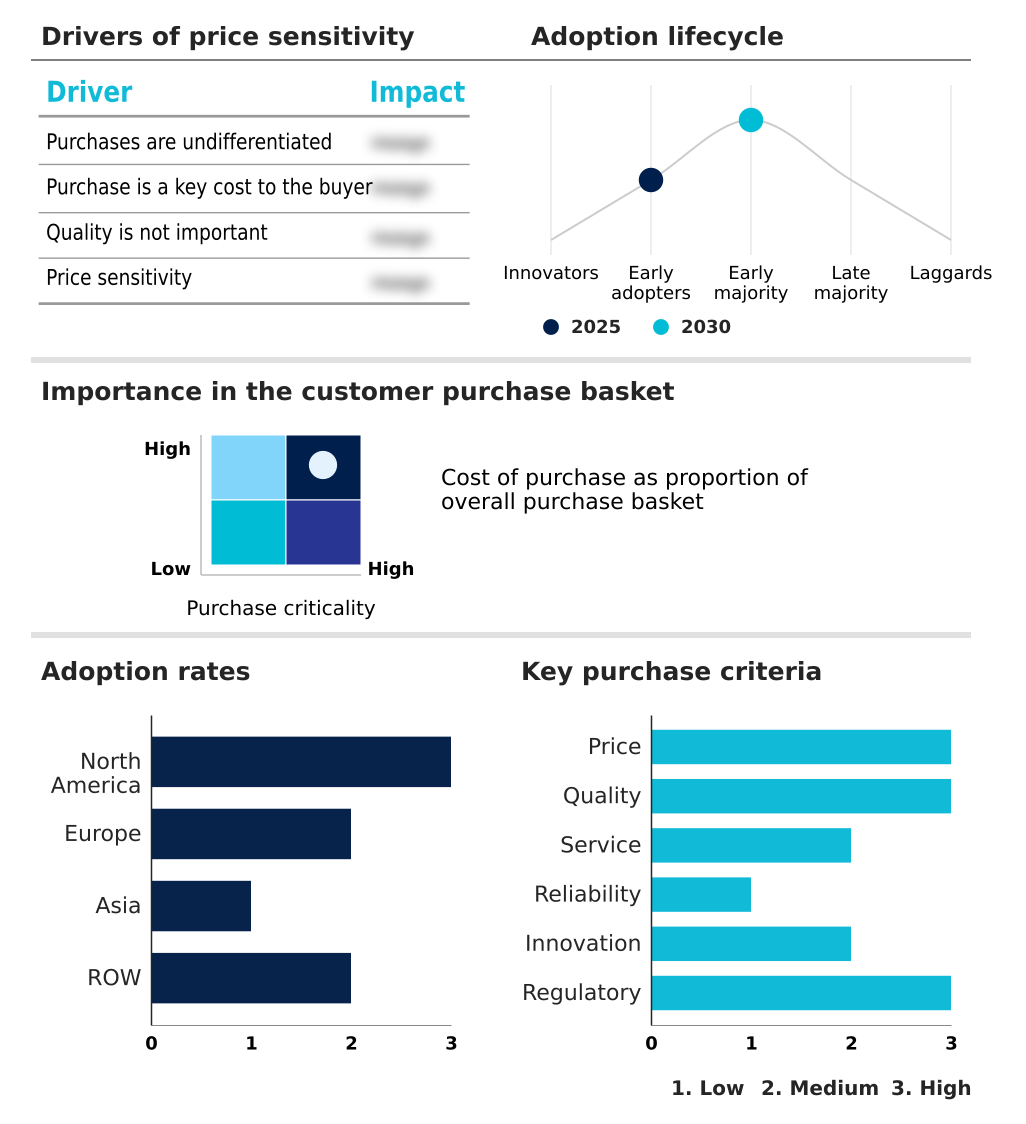
Exclusive Technavio Analysis on Customer Landscape
The raman spectroscopy market forecasting report includes the adoption lifecycle of the market, covering from the innovator’s stage to the laggard’s stage. It focuses on adoption rates in different regions based on penetration. Furthermore, the raman spectroscopy market report also includes key purchase criteria and drivers of price sensitivity to help companies evaluate and develop their market growth analysis strategies.
Customer Landscape of Raman Spectroscopy Industry
Competitive Landscape
Companies are implementing various strategies, such as strategic alliances, raman spectroscopy market forecast, partnerships, mergers and acquisitions, geographical expansion, and product/service launches, to enhance their presence in the industry.
Agilent Technologies Inc. - The vendor portfolio includes a range of diversified analytical instrument manufacturers and specialized firms, all competing on technological innovation, performance, and application-specific solutions.
The industry research and growth report includes detailed analyses of the competitive landscape of the market and information about key companies, including:
- Agilent Technologies Inc.
- Anton Paar GmbH
- Bruker Corp.
- Endress Hauser Group Services
- Hamamatsu Photonics KK
- Hitachi Ltd.
- HORIBA Ltd.
- Ibsen Photonics AS
- Ilife Biotech
- JASCO
- Metrohm AG
- METTLER TOLEDO
- Oxford Instruments plc
- PerkinElmer US LLC
- Renishaw Plc
- Rigaku Corp.
- Shimadzu Corp.
- Technos Instruments
- Thermo Fisher Scientific Inc.
Qualitative and quantitative analysis of companies has been conducted to help clients understand the wider business environment as well as the strengths and weaknesses of key industry players. Data is qualitatively analyzed to categorize companies as pure play, category-focused, industry-focused, and diversified; it is quantitatively analyzed to categorize companies as dominant, leading, strong, tentative, and weak.
Recent Development and News in Raman spectroscopy market
- In September 2024, Thermo Fisher Scientific Inc. unveiled its AI-powered chemometrics software suite, designed to automate spectral interpretation and enhance quantitative analysis for its DXR Raman series, significantly reducing method development time for non-expert users.
- In March 2025, Renishaw Plc announced a strategic technology partnership with Intel Corp. to co-develop and integrate advanced in-line Raman metrology systems into next-generation fabrication plants for sub-2-nanometer chip manufacturing, targeting real-time process control.
- In March 2025, mining company Rio Tinto announced the full operational deployment of its proprietary GeoDetect system, utilizing a fleet of autonomous drones equipped with portable Raman spectrometers for large-scale chemical mapping of exploration sites.
- In April 2025, Pfizer Inc., in collaboration with the Massachusetts Institute of Technology, completed a project implementing in-line Raman spectroscopy for real-time monitoring of critical quality attributes of a new monoclonal antibody therapy.
Dive into Technavio’s robust research methodology, blending expert interviews, extensive data synthesis, and validated models for unparalleled Raman Spectroscopy Market insights. See full methodology.
| Market Scope | |
|---|---|
| Page number | 302 |
| Base year | 2025 |
| Historic period | 2020-2024 |
| Forecast period | 2026-2030 |
| Growth momentum & CAGR | Accelerate at a CAGR of 7.2% |
| Market growth 2026-2030 | USD 358.3 million |
| Market structure | Fragmented |
| YoY growth 2025-2026(%) | 6.7% |
| Key countries | US, Canada, Mexico, Germany, UK, France, Italy, The Netherlands, Spain, China, India, Japan, South Korea, Thailand, Indonesia, Brazil, Saudi Arabia, UAE, Argentina, South Africa, Colombia, Israel and Turkey |
| Competitive landscape | Leading Companies, Market Positioning of Companies, Competitive Strategies, and Industry Risks |
Research Analyst Overview
- The market's evolution is driven by innovations that make vibrational spectroscopy more powerful and accessible. The integration of advanced chemometrics with techniques like raman imaging and confocal raman microscopy is pivotal, allowing for detailed material characterization and quantitative analysis.
- Boardroom decisions on capital expenditure are increasingly influenced by the long-term value of adopting process analytical technology (pat), which can reduce manufacturing process deviations by 15%. Key technologies such as surface-enhanced raman spectroscopy (sers) and tip-enhanced raman spectroscopy (ters) are expanding applications into trace detection and nanoscale science, while spatially offset raman spectroscopy (sors) enables through-container analysis.
- The development of robust handheld raman spectrometer models, supported by comprehensive spectral library databases, is democratizing point-of-need testing. However, challenges like fluorescence interference persist, prompting innovation in laser excitation wavelength and charge-coupled device (ccd) detector technology.
- The market's trajectory depends on balancing the high performance of a benchtop raman system, reliant on factors like spectral resolution and signal-to-noise ratio, with the demand for cost-effective, user-friendly solutions for non-destructive analysis and polymorph screening.
What are the Key Data Covered in this Raman Spectroscopy Market Research and Growth Report?
-
What is the expected growth of the Raman Spectroscopy Market between 2026 and 2030?
-
USD 358.3 million, at a CAGR of 7.2%
-
-
What segmentation does the market report cover?
-
The report is segmented by Application (Pharmaceuticals, Life science, Material science, Semiconductor, and Others), Type (Benchtop, and Portable), Technique (Surface enhanced, and Tip enhanced) and Geography (North America, Europe, Asia, Rest of World (ROW))
-
-
Which regions are analyzed in the report?
-
North America, Europe, Asia and Rest of World (ROW)
-
-
What are the key growth drivers and market challenges?
-
Increasing demand from pharmaceutical and biotechnology industries, High initial capital investment and total cost of ownership
-
-
Who are the major players in the Raman Spectroscopy Market?
-
Agilent Technologies Inc., Anton Paar GmbH, Bruker Corp., Endress Hauser Group Services, Hamamatsu Photonics KK, Hitachi Ltd., HORIBA Ltd., Ibsen Photonics AS, Ilife Biotech, JASCO, Metrohm AG, METTLER TOLEDO, Oxford Instruments plc, PerkinElmer US LLC, Renishaw Plc, Rigaku Corp., Shimadzu Corp., Technos Instruments and Thermo Fisher Scientific Inc.
-
Market Research Insights
- Market dynamics are increasingly shaped by the shift toward in-field and at-line analysis, where portable instruments for point-of-need testing are becoming essential. The adoption of in-line process control for real-time process monitoring in pharmaceutical manufacturing significantly enhances efficiency, reducing batch rejection rates by up to 15%.
- This move is supported by advanced software that enables sophisticated aqueous solution analysis and simplifies complex data interpretation for non-expert users. Furthermore, applications in food safety assurance are expanding, with handheld devices offering a 25% faster detection time for contaminants compared to lab-based methods. These developments are broadening the technology’s accessibility and driving adoption across new industrial verticals.
We can help! Our analysts can customize this raman spectroscopy market research report to meet your requirements.
 RIA -
RIA - 
