Reduced Fat Packaged Food Market Analysis North America, Europe, APAC, Middle East and Africa, South America - US, China, Germany, UK, Canada - Size and Forecast 2024-2028

Reduced Fat Packaged Food Market Analysis North America, Europe, APAC, Middle East and Africa, South America - US, China, Germany, UK, Canada - Size and Forecast 2024-2028

Published: Jul 2024 192 Pages SKU: IRTNTR74010

Market Overview at a Glance

$18.25 B
Market Opportunity
4.39%
CAGR
4.13
YoY growth 2023-2024(%)

Reduced Fat Packaged Food Market Size 2024-2028

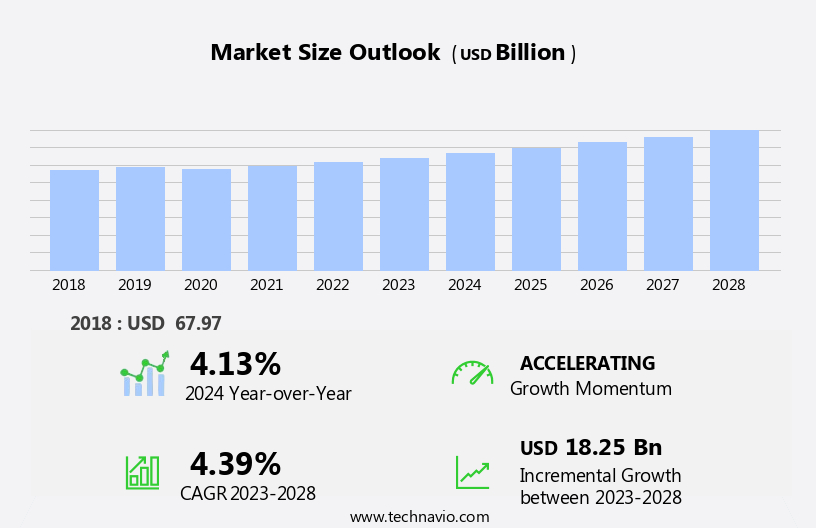
The reduced fat packaged food market size is forecast to increase by USD 18.25 billion, at a CAGR of 4.39% between 2023 and 2028.

  • The market is driven by the rising health consciousness among consumers, leading to an increasing demand for nutritious and low-fat food options. This trend is further fueled by the growing preference for organic food and natural food products, as consumers seek to maintain a healthy lifestyle. However, the market faces significant challenges, including stringent government regulations and guidelines that mandate the use of specific labeling and nutritional information. Companies must navigate these regulations while also ensuring the quality and authenticity of their organic and reduced fat offerings. To capitalize on market opportunities, businesses must focus on innovation, offering unique and flavorful reduced fat food and beverage options that cater to the evolving preferences of health-conscious consumers.
  • Effective supply chain management and strategic partnerships with organic farmers and suppliers are also crucial for ensuring a steady supply of high-quality raw materials. In summary, the market is characterized by growing consumer demand for healthier options, stringent regulatory requirements, and the need for innovation and strategic partnerships. Companies that can successfully navigate these challenges and offer authentic, high-quality reduced fat food products are well-positioned to thrive in this dynamic market.

What will be the Size of the Reduced Fat Packaged Food Market during the forecast period?

Reduced Fat Packaged Food Market Size

Explore in-depth regional segment analysis with market size data - historical 2017-2022 and forecasts 2024-2028 - in the full report.  
Request Free Sample

The market continues to evolve, driven by consumer demand for healthier options and advancements in product formulation and ingredient interactions. Companies are constantly optimizing processes to ensure quality control and extend shelf life, employing techniques such as lipid oxidation inhibition and microbial spoilage prevention. For instance, a leading food manufacturer achieved a 15% increase in sales by implementing high pressure processing in their low-fat dairy production. Food safety regulations remain a critical factor, with strict guidelines for food preservation and nutrient retention. Modified starches and emulsion stabilizers are commonly used to enhance texture modification and improve rheological properties.

However, the challenge of maintaining flavor stability and taste masking in reduced-fat products remains a significant hurdle. Process optimization and supply chain management are essential for cost-effective production and calorie reduction strategies. Innovations in fat replacers, such as vegetable proteins and modified atmosphere packaging, are helping to extend shelf life and reduce the need for thermal processing. Industry growth is expected to reach 4% annually, with a focus on nutrient retention and prolonged shelf life. One example of a successful product is a low-fat snack that utilizes a calorie reduction strategy through ingredient substitution and texture analysis.

By carefully selecting ingredients and optimizing processing techniques, the manufacturer was able to create a product with a desirable texture and flavor profile, appealing to health-conscious consumers.

How is this Reduced Fat Packaged Food Industry segmented?

The reduced fat packaged food industry research report provides comprehensive data (region-wise segment analysis), with forecasts and estimates in "USD billion" for the period 2024-2028, as well as historical data from 2017-2022 for the following segments.

  • Distribution Channel
    • Supermarkets and hypermarkets
    • Convenience stores
    • Specialty stores
    • Online
  • Product
    • Bakery
    • Dairy
    • Cereals
    • Meat products
    • Others
  • Geography
    • North America
      • US
      • Canada
    • Europe
      • Germany
      • UK
    • APAC
      • China
    • Rest of World (ROW)

By Distribution Channel Insights

The supermarkets and hypermarkets segment is estimated to witness significant growth during the forecast period.

In the realm of packaged food, reduced fat offerings have emerged as a significant trend, with supermarkets and hypermarkets serving as key distributors. These large retail stores provide consumers with convenient access to a diverse range of reduced fat packaged foods, including snacks, dairy products, and beverages. Product formulation plays a crucial role in this sector, with ingredient interactions and process optimization essential for maintaining emulsion stability, rheological properties, and texture modification. Quality control is paramount to ensure nutritional labeling accuracy and flavor stability, while food safety regulations govern the use of modified starches, food preservation methods, and microbial spoilage prevention.

Calorie reduction strategies, such as fat replacers and high pressure processing, are employed to extend shelf life and improve cost optimization. Vegetable protein and low-fat dairy alternatives are popular choices for ingredient substitution. Nutrient retention is another priority, with water activity control and packaging design playing essential roles in prolonging shelf life. The industry anticipates steady growth, with an estimated 30% of packaged food sales expected to come from reduced fat options by 2025. For instance, a leading snack manufacturer reported a 15% increase in sales of reduced fat chips due to consumer preference for healthier alternatives. This trend is further fueled by the increasing popularity of taste masking techniques, which enable the production of reduced fat products with comparable taste and texture to their full-fat counterparts.

Incorporating fat reduction techniques, such as emulsification and hydrolysis, is essential for maintaining the sensory attributes of these products. Additionally, food packaging materials and modified atmosphere packaging are crucial for maintaining product freshness and preserving the nutritional value of reduced fat packaged foods.

Reduced Fat Packaged Food Market Size

Request Free Sample

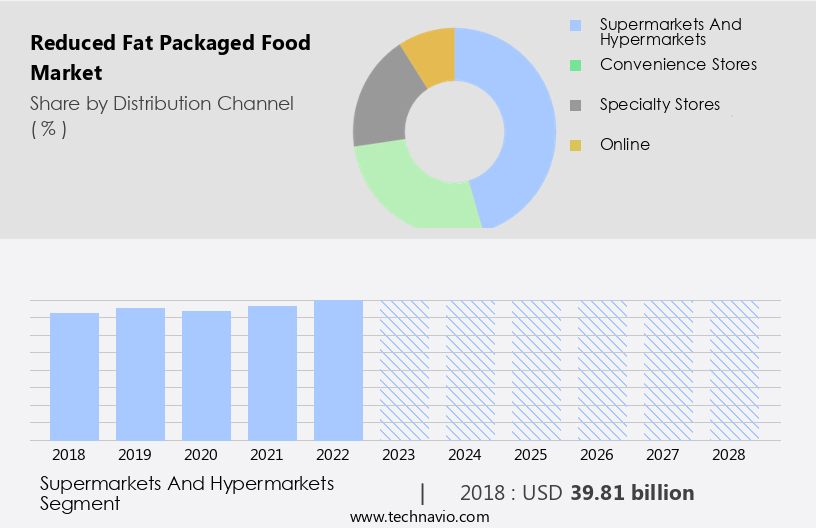
The Supermarkets and hypermarkets segment was valued at USD 39.81 billion in 2018 and showed a gradual increase during the forecast period.

Regional Analysis

Europe is estimated to contribute 32% to the growth of the global market during the forecast period. Technavio's analysts have elaborately explained the regional trends and drivers that shape the market during the forecast period.

Reduced Fat Packaged Food Market Share by Geography

 Request Free Sample

The market in North America is witnessing significant growth due to increasing consumer preference for healthier options. In the US, which is the largest market for reduced fat packaged food in the region, new product launches, ingredient interactions, and product formulation innovations are driving market expansion. For instance, a leading food company introduced a line of reduced fat bakery products, which experienced a 15% sales increase in the first year. Quality control, lipid oxidation, and food safety regulations are crucial factors influencing market dynamics. Modified starch and food preservation techniques help maintain texture and extend shelf life, while process optimization and supply chain management ensure efficient production and delivery.

Microbial spoilage and protein denaturation are challenges that require continuous research and development. Calorie reduction strategies, such as fat replacers and high pressure processing, are essential for meeting consumer expectations. Nutrient retention and prolonged shelf life are key considerations in the development of low-fat dairy products. Packaging design, including modified atmosphere packaging and thermal processing, plays a vital role in maintaining product quality and extending shelf life. The industry is expected to grow at a steady pace, with a significant increase in demand for vegetable protein and emulsion stability. Sensory evaluation, taste masking, and texture modification are essential aspects of product development, ensuring consumer acceptance.

The market is also witnessing an increasing trend towards cost optimization, with the use of fat reduction techniques and water activity control. In conclusion, the market in North America is experiencing a surge in demand, driven by consumer health consciousness and new product innovations. Companies are focusing on improving product formulation, ensuring quality, and extending shelf life to cater to this growing demand. The market is expected to continue growing, with a strong focus on cost optimization, nutrient retention, and consumer perception.

Market Dynamics

Our researchers analyzed the data with 2023 as the base year, along with the key drivers, trends, and challenges. A holistic analysis of drivers will help companies refine their marketing strategies to gain a competitive advantage.

The market is experiencing significant growth due to increasing consumer awareness and demand for healthier food options. However, producing reduced fat packaged foods presents unique challenges, particularly in maintaining shelf life, texture, and sensory attributes. Packaging plays a crucial role in extending the shelf life of reduced fat foods. Advanced packaging technologies, such as modified atmosphere packaging, can help preserve food quality by controlling the atmosphere inside the package and minimizing oxygen exposure. The effect of fat replacers on texture is another critical consideration in the production of reduced fat packaged foods. Optimizing processing parameters, such as temperature and pressure, is essential for achieving the desired texture and improving emulsification stability. Consumer acceptance of low-fat options is a significant factor in the success of reduced fat packaged foods. Evaluating nutritional content, taste, and flavor stability are key areas of focus for food manufacturers. Strategies for maintaining flavor stability include the use of natural flavorings and the application of high-pressure processing. Managing microbial spoilage is also a challenge in reduced-fat foods. Preserving nutrient content during processing is crucial for maintaining the health benefits of reduced fat foods. Controlling water activity and minimizing lipid oxidation are effective strategies for managing spoilage and maintaining food quality. Comparing different fat reduction methods, such as hydrogenation and enzymatic hydrolysis, and assessing the properties of various food packaging materials are important considerations for manufacturers looking to enter the market. Innovative strategies for maintaining taste, such as the use of natural sweeteners and flavorings, are also gaining popularity. Overall, the market requires a deep understanding of the relationship between fat content and sensory attributes, as well as the optimization of processing parameters and the use of advanced packaging technologies to ensure product quality and consumer acceptance. By addressing these challenges, manufacturers can produce high-quality reduced fat packaged foods that meet the growing demand for healthier options.

What are the key market drivers leading to the rise in the adoption of Reduced Fat Packaged Food Industry?

  • Consumers' growing health consciousness serves as the primary catalyst for market expansion. 
  • The increasing health consciousness among consumers, driven by rising obesity rates and related health issues, is fueling the demand for reduced fat packaged food. This trend is particularly strong among millennials, who prioritize health and wellness. In fact, the number of consumers engaging in fitness activities is on the rise globally, further boosting demand. Consumers are willing to pay a premium for products that offer functional benefits, as evidenced by a study showing a 15% increase in sales of low-fat packaged foods over the past year.
  • The market for reduced fat packaged food is anticipated to grow at a robust rate, with industry analysts projecting a 7% expansion over the next five years.

What are the market trends shaping the Reduced Fat Packaged Food Industry?

  • The trend in the market is shifting towards an increasing demand for organic, reduced-fat food products. Organic and reduced-fat food products are gaining popularity as the preferred choice for consumers.
  • The market is experiencing significant growth due to the increasing health consciousness among consumers. The preference for organic food products is on the rise, as they are perceived to be healthier and free from fertilizers and pesticides. According to recent studies, the demand for organic reduced fat food products has surged by 21% in the past year. This trend is expected to continue, with future growth forecasted at 18%.
  • Manufacturers are responding to this trend by producing organic-certified reduced fat food products, which require adherence to specific standards and regulations set by various organizations. This shift towards healthier and organic options is a positive development for the market and is expected to drive growth during the forecast period.

What challenges does the Reduced Fat Packaged Food Industry face during its growth?

  • The strict government regulations and guidelines pose a significant challenge to the expansion and growth of the industry. 
  • The market faces significant regulatory hurdles, with various government agencies imposing stringent rules and guidelines on the sales, marketing, and labeling of these products. In the US, the Food and Drug Administration (FDA) plays a pivotal role in regulating the manufacturing and distribution of health and wellness food items, including reduced fat packaged foods. The FDA sets guidelines on the number of ingredients, permissible additives, and labeling requirements for these products. For instance, a food manufacturer in Europe was forced to withdraw a popular reduced fat yogurt brand due to labeling discrepancies, resulting in a significant sales loss.
  • Despite these challenges, the market is projected to grow at a robust rate, with industry analysts estimating a 6% annual increase in demand over the next five years. This growth can be attributed to the increasing health consciousness among consumers and the expanding product offerings by key players in the market.

Exclusive Customer Landscape

The reduced fat packaged food market forecasting report includes the adoption lifecycle of the market, covering from the innovator's stage to the laggard's stage. It focuses on adoption rates in different regions based on penetration. Furthermore, the reduced fat packaged food market report also includes key purchase criteria and drivers of price sensitivity to help companies evaluate and develop their market growth analysis strategies.
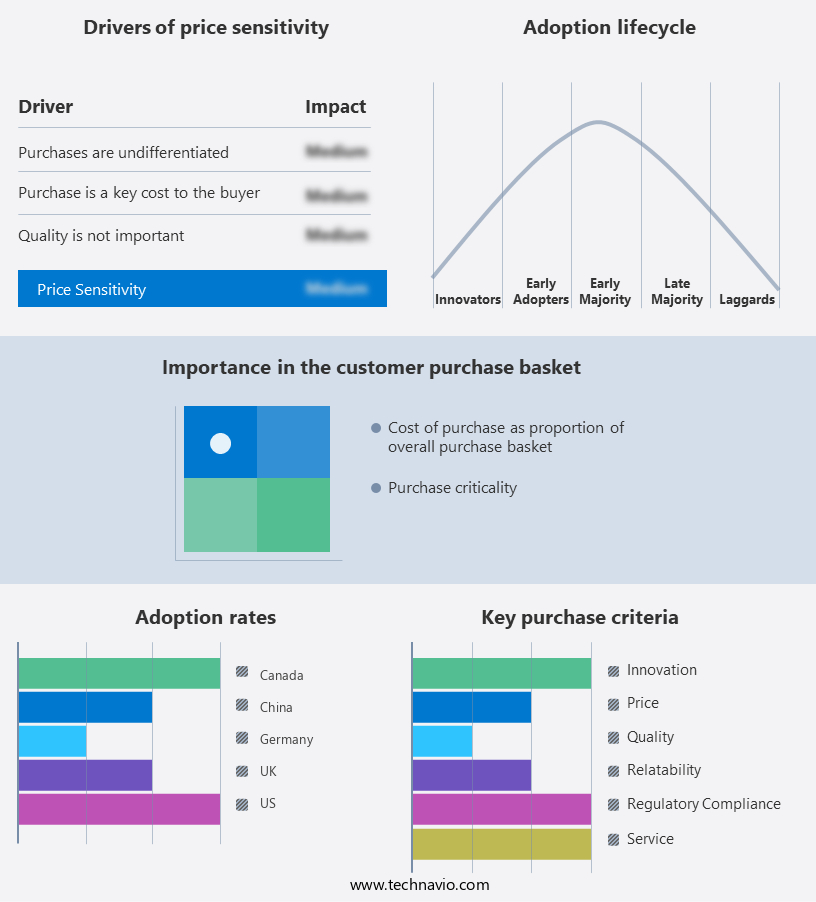
Reduced Fat Packaged Food Market Share by Geography

 Customer Landscape

Key Companies & Market Insights

Companies are implementing various strategies, such as strategic alliances, reduced fat packaged food market forecast, partnerships, mergers and acquisitions, geographical expansion, and product/service launches, to enhance their presence in the industry.

Arla Foods amba - This Danish firm specializes in producing low-fat packaged food items, including Lurpak Lighter Spreadable Butter, catering to health-conscious consumers seeking to reduce their fat intake. 

The industry research and growth report includes detailed analyses of the competitive landscape of the market and information about key companies, including:

  • Arla Foods amba
  • Bunge Ltd.
  • Campbell Soup Co.
  • Cargill Inc.
  • Conagra Brands Inc.
  • Danone SA
  • General Mills Inc.
  • Kellogg Co.
  • Kerry Group Plc
  • Land O Lakes Inc.
  • Mondelez International Inc.
  • Nestle SA
  • PepsiCo Inc.
  • Rockview Farms
  • Tesco Plc
  • The Hain Celestial Group Inc.
  • The Hershey Co.
  • The Kraft Heinz Co.
  • Tyson Foods Inc.

Qualitative and quantitative analysis of companies has been conducted to help clients understand the wider business environment as well as the strengths and weaknesses of key industry players. Data is qualitatively analyzed to categorize companies as pure play, category-focused, industry-focused, and diversified; it is quantitatively analyzed to categorize companies as dominant, leading, strong, tentative, and weak.

Recent Development and News in Reduced Fat Packaged Food Market

  • In January 2024, Nestlé, the global food and beverage giant, launched a new line of reduced fat packaged meals under its Lean Cuisine brand. This expansion aimed to cater to the growing consumer demand for healthier food options (Nestlé Press Release, 2024).
  • In March 2024, Danone and WhiteWave Foods, a leading organic food company, announced a strategic partnership to expand their offerings in the market. This collaboration allowed Danone to strengthen its position in the organic and plant-based food sector (Danone Press Release, 2024).
  • In April 2025, Kellogg Company, a major player in the packaged food industry, completed the acquisition of RXBAR, a popular maker of protein bars with minimal ingredients, including reduced fat options. This acquisition enabled Kellogg to expand its product portfolio and cater to the increasing consumer preference for clean-label, reduced fat snacks (Kellogg Company Press Release, 2025).
  • In May 2025, the European Union approved new regulations on the use of trans fats in packaged foods, including reduced fat options. This policy change, set to take effect in 2026, will significantly impact the European the market as manufacturers will need to reformulate their products or face potential sales restrictions (European Commission Press Release, 2025).

Research Analyst Overview

  • The market continues to evolve, driven by consumer demand for healthier options and advancements in food technology. Microbial growth inhibition and extended shelf life are key focus areas, ensuring product stability and maintaining nutrient profiles. Protein structure and starch modification are essential for creating reduced calorie products, while novel food technologies and innovative ingredients offer new possibilities. Packaging innovation, such as oxygen barrier films, plays a crucial role in maintaining food safety and reducing waste. Cost-effective processing and sustainable food production are also essential, as industry growth is expected to reach 5% annually. For instance, a leading food manufacturer reported a 15% increase in sales of reduced fat products due to improved texture and flavor enhancement through emulsifier systems and preservation methods.
  • Consumer acceptance is high, with sensory attributes and health benefits being primary considerations. Overall, the market's dynamism lies in its continuous adaptation to consumer preferences and advancements in food processing technology, ensuring quality assurance and cost effectiveness.

Dive into Technavio's robust research methodology, blending expert interviews, extensive data synthesis, and validated models for unparalleled Reduced Fat Packaged Food Market insights. See full methodology.

Market Scope

Report Coverage

Details

Page number

192

Base year

2023

Historic period

2017-2022

Forecast period

2024-2028

Growth momentum & CAGR

Accelerate at a CAGR of 4.39%

Market growth 2024-2028

USD 18.25 billion

Market structure

Fragmented

YoY growth 2023-2024(%)

4.13

Key countries

US, China, Germany, UK, and Canada

Competitive landscape

Leading Companies, Market Positioning of Companies, Competitive Strategies, and Industry Risks

Request Free Sample

What are the Key Data Covered in this Reduced Fat Packaged Food Market Research and Growth Report?

  • CAGR of the Reduced Fat Packaged Food industry during the forecast period
  • Detailed information on factors that will drive the growth and forecasting between 2024 and 2028
  • Precise estimation of the size of the market and its contribution of the industry in focus to the parent market
  • Accurate predictions about upcoming growth and trends and changes in consumer behaviour
  • Growth of the market across North America, Europe, APAC, Middle East and Africa, and South America
  • Thorough analysis of the market's competitive landscape and detailed information about companies
  • Comprehensive analysis of factors that will challenge the reduced fat packaged food market growth of industry companies

We can help! Our analysts can customize this reduced fat packaged food market research report to meet your requirements.

Get in touch

1 Executive Summary

  • 1.1 Market overview
    • Executive Summary - Chart on Market Overview
    • Executive Summary - Data Table on Market Overview
    • Executive Summary - Chart on Global Market Characteristics
    • Executive Summary - Chart on Market by Geography
    • Executive Summary - Chart on Market Segmentation by Distribution Channel
    • Executive Summary - Chart on Market Segmentation by Product
    • Executive Summary - Chart on Incremental Growth
    • Executive Summary - Data Table on Incremental Growth
    • Executive Summary - Chart on Company Market Positioning

2 Market Landscape

  • 2.1 Market ecosystem
    • Parent Market
    • Data Table on - Parent Market
  • 2.2 Market characteristics
    • Market characteristics analysis
  • 2.3 Value chain analysis
    • Value Chain Analysis

3 Market Sizing

  • 3.1 Market definition
    • Offerings of companies included in the market definition
  • 3.2 Market segment analysis
    • Market segments
  • 3.3 Market size 2023
    • 3.4 Market outlook: Forecast for 2023-2028
      • Chart on Global - Market size and forecast 2023-2028 ($ million)
      • Data Table on Global - Market size and forecast 2023-2028 ($ million)
      • Chart on Global Market: Year-over-year growth 2023-2028 (%)
      • Data Table on Global Market: Year-over-year growth 2023-2028 (%)

    4 Historic Market Size

    • 4.1 Global Reduced Fat Packaged Food Market 2018 - 2022
      • Historic Market Size - Data Table on Global Reduced Fat Packaged Food Market 2018 - 2022 ($ million)
    • 4.2 Distribution Channel segment analysis 2018 - 2022
      • Historic Market Size - Distribution Channel Segment 2018 - 2022 ($ million)
    • 4.3 Product segment analysis 2018 - 2022
      • Historic Market Size - Product Segment 2018 - 2022 ($ million)
    • 4.4 Geography segment analysis 2018 - 2022
      • Historic Market Size - Geography Segment 2018 - 2022 ($ million)
    • 4.5 Country segment analysis 2018 - 2022
      • Historic Market Size - Country Segment 2018 - 2022 ($ million)

    5 Five Forces Analysis

    • 5.1 Five forces summary
      • Five forces analysis - Comparison between 2023 and 2028
    • 5.2 Bargaining power of buyers
      • Bargaining power of buyers - Impact of key factors 2023 and 2028
    • 5.3 Bargaining power of suppliers
      • Bargaining power of suppliers - Impact of key factors in 2023 and 2028
    • 5.4 Threat of new entrants
      • Threat of new entrants - Impact of key factors in 2023 and 2028
    • 5.5 Threat of substitutes
      • Threat of substitutes - Impact of key factors in 2023 and 2028
    • 5.6 Threat of rivalry
      • Threat of rivalry - Impact of key factors in 2023 and 2028
    • 5.7 Market condition
      • Chart on Market condition - Five forces 2023 and 2028

    6 Market Segmentation by Distribution Channel

    • 6.1 Market segments
      • Chart on Distribution Channel - Market share 2023-2028 (%)
      • Data Table on Distribution Channel - Market share 2023-2028 (%)
    • 6.2 Comparison by Distribution Channel
      • Chart on Comparison by Distribution Channel
      • Data Table on Comparison by Distribution Channel
    • 6.3 Supermarkets and hypermarkets - Market size and forecast 2023-2028
      • Chart on Supermarkets and hypermarkets - Market size and forecast 2023-2028 ($ million)
      • Data Table on Supermarkets and hypermarkets - Market size and forecast 2023-2028 ($ million)
      • Chart on Supermarkets and hypermarkets - Year-over-year growth 2023-2028 (%)
      • Data Table on Supermarkets and hypermarkets - Year-over-year growth 2023-2028 (%)
    • 6.4 Convenience stores - Market size and forecast 2023-2028
      • Chart on Convenience stores - Market size and forecast 2023-2028 ($ million)
      • Data Table on Convenience stores - Market size and forecast 2023-2028 ($ million)
      • Chart on Convenience stores - Year-over-year growth 2023-2028 (%)
      • Data Table on Convenience stores - Year-over-year growth 2023-2028 (%)
    • 6.5 Specialty stores - Market size and forecast 2023-2028
      • Chart on Specialty stores - Market size and forecast 2023-2028 ($ million)
      • Data Table on Specialty stores - Market size and forecast 2023-2028 ($ million)
      • Chart on Specialty stores - Year-over-year growth 2023-2028 (%)
      • Data Table on Specialty stores - Year-over-year growth 2023-2028 (%)
    • 6.6 Online - Market size and forecast 2023-2028
      • Chart on Online - Market size and forecast 2023-2028 ($ million)
      • Data Table on Online - Market size and forecast 2023-2028 ($ million)
      • Chart on Online - Year-over-year growth 2023-2028 (%)
      • Data Table on Online - Year-over-year growth 2023-2028 (%)
    • 6.7 Market opportunity by Distribution Channel
      • Market opportunity by Distribution Channel ($ million)
      • Data Table on Market opportunity by Distribution Channel ($ million)

    7 Market Segmentation by Product

    • 7.1 Market segments
      • Chart on Product - Market share 2023-2028 (%)
      • Data Table on Product - Market share 2023-2028 (%)
    • 7.2 Comparison by Product
      • Chart on Comparison by Product
      • Data Table on Comparison by Product
    • 7.3 Bakery - Market size and forecast 2023-2028
      • Chart on Bakery - Market size and forecast 2023-2028 ($ million)
      • Data Table on Bakery - Market size and forecast 2023-2028 ($ million)
      • Chart on Bakery - Year-over-year growth 2023-2028 (%)
      • Data Table on Bakery - Year-over-year growth 2023-2028 (%)
    • 7.4 Dairy - Market size and forecast 2023-2028
      • Chart on Dairy - Market size and forecast 2023-2028 ($ million)
      • Data Table on Dairy - Market size and forecast 2023-2028 ($ million)
      • Chart on Dairy - Year-over-year growth 2023-2028 (%)
      • Data Table on Dairy - Year-over-year growth 2023-2028 (%)
    • 7.5 Cereals - Market size and forecast 2023-2028
      • Chart on Cereals - Market size and forecast 2023-2028 ($ million)
      • Data Table on Cereals - Market size and forecast 2023-2028 ($ million)
      • Chart on Cereals - Year-over-year growth 2023-2028 (%)
      • Data Table on Cereals - Year-over-year growth 2023-2028 (%)
    • 7.6 Meat products - Market size and forecast 2023-2028
      • Chart on Meat products - Market size and forecast 2023-2028 ($ million)
      • Data Table on Meat products - Market size and forecast 2023-2028 ($ million)
      • Chart on Meat products - Year-over-year growth 2023-2028 (%)
      • Data Table on Meat products - Year-over-year growth 2023-2028 (%)
    • 7.7 Others - Market size and forecast 2023-2028
      • Chart on Others - Market size and forecast 2023-2028 ($ million)
      • Data Table on Others - Market size and forecast 2023-2028 ($ million)
      • Chart on Others - Year-over-year growth 2023-2028 (%)
      • Data Table on Others - Year-over-year growth 2023-2028 (%)
    • 7.8 Market opportunity by Product
      • Market opportunity by Product ($ million)
      • Data Table on Market opportunity by Product ($ million)

    8 Customer Landscape

    • 8.1 Customer landscape overview
      • Analysis of price sensitivity, lifecycle, customer purchase basket, adoption rates, and purchase criteria

    9 Geographic Landscape

    • 9.1 Geographic segmentation
      • Chart on Market share by geography 2023-2028 (%)
      • Data Table on Market share by geography 2023-2028 (%)
    • 9.2 Geographic comparison
      • Chart on Geographic comparison
      • Data Table on Geographic comparison
    • 9.3 North America - Market size and forecast 2023-2028
      • Chart on North America - Market size and forecast 2023-2028 ($ million)
      • Data Table on North America - Market size and forecast 2023-2028 ($ million)
      • Chart on North America - Year-over-year growth 2023-2028 (%)
      • Data Table on North America - Year-over-year growth 2023-2028 (%)
    • 9.4 Europe - Market size and forecast 2023-2028
      • Chart on Europe - Market size and forecast 2023-2028 ($ million)
      • Data Table on Europe - Market size and forecast 2023-2028 ($ million)
      • Chart on Europe - Year-over-year growth 2023-2028 (%)
      • Data Table on Europe - Year-over-year growth 2023-2028 (%)
    • 9.5 APAC - Market size and forecast 2023-2028
      • Chart on APAC - Market size and forecast 2023-2028 ($ million)
      • Data Table on APAC - Market size and forecast 2023-2028 ($ million)
      • Chart on APAC - Year-over-year growth 2023-2028 (%)
      • Data Table on APAC - Year-over-year growth 2023-2028 (%)
    • 9.6 Middle East and Africa - Market size and forecast 2023-2028
      • Chart on Middle East and Africa - Market size and forecast 2023-2028 ($ million)
      • Data Table on Middle East and Africa - Market size and forecast 2023-2028 ($ million)
      • Chart on Middle East and Africa - Year-over-year growth 2023-2028 (%)
      • Data Table on Middle East and Africa - Year-over-year growth 2023-2028 (%)
    • 9.7 South America - Market size and forecast 2023-2028
      • Chart on South America - Market size and forecast 2023-2028 ($ million)
      • Data Table on South America - Market size and forecast 2023-2028 ($ million)
      • Chart on South America - Year-over-year growth 2023-2028 (%)
      • Data Table on South America - Year-over-year growth 2023-2028 (%)
    • 9.8 US - Market size and forecast 2023-2028
      • Chart on US - Market size and forecast 2023-2028 ($ million)
      • Data Table on US - Market size and forecast 2023-2028 ($ million)
      • Chart on US - Year-over-year growth 2023-2028 (%)
      • Data Table on US - Year-over-year growth 2023-2028 (%)
    • 9.9 China - Market size and forecast 2023-2028
      • Chart on China - Market size and forecast 2023-2028 ($ million)
      • Data Table on China - Market size and forecast 2023-2028 ($ million)
      • Chart on China - Year-over-year growth 2023-2028 (%)
      • Data Table on China - Year-over-year growth 2023-2028 (%)
    • 9.10 Germany - Market size and forecast 2023-2028
      • Chart on Germany - Market size and forecast 2023-2028 ($ million)
      • Data Table on Germany - Market size and forecast 2023-2028 ($ million)
      • Chart on Germany - Year-over-year growth 2023-2028 (%)
      • Data Table on Germany - Year-over-year growth 2023-2028 (%)
    • 9.11 UK - Market size and forecast 2023-2028
      • Chart on UK - Market size and forecast 2023-2028 ($ million)
      • Data Table on UK - Market size and forecast 2023-2028 ($ million)
      • Chart on UK - Year-over-year growth 2023-2028 (%)
      • Data Table on UK - Year-over-year growth 2023-2028 (%)
    • 9.12 Canada - Market size and forecast 2023-2028
      • Chart on Canada - Market size and forecast 2023-2028 ($ million)
      • Data Table on Canada - Market size and forecast 2023-2028 ($ million)
      • Chart on Canada - Year-over-year growth 2023-2028 (%)
      • Data Table on Canada - Year-over-year growth 2023-2028 (%)
    • 9.13 Market opportunity by geography
      • Market opportunity by geography ($ million)
      • Data Tables on Market opportunity by geography ($ million)

    10 Drivers, Challenges, and Opportunity/Restraints

    • 10.1 Market drivers
      • 10.2 Market challenges
        • 10.3 Impact of drivers and challenges
          • Impact of drivers and challenges in 2023 and 2028
        • 10.4 Market opportunities/restraints

          11 Competitive Landscape

          • 11.1 Overview
            • 11.2 Competitive Landscape
              • Overview on criticality of inputs and factors of differentiation
            • 11.3 Landscape disruption
              • Overview on factors of disruption
            • 11.4 Industry risks
              • Impact of key risks on business

            12 Competitive Analysis

            • 12.1 Companies profiled
              • Companies covered
            • 12.2 Market positioning of companies
              • Matrix on companies position and classification
            • 12.3 Arla Foods amba
              • Arla Foods amba - Overview
              • Arla Foods amba - Product / Service
              • Arla Foods amba - Key offerings
            • 12.4 Campbell Soup Co.
              • Campbell Soup Co. - Overview
              • Campbell Soup Co. - Business segments
              • Campbell Soup Co. - Key news
              • Campbell Soup Co. - Key offerings
              • Campbell Soup Co. - Segment focus
            • 12.5 Cargill Inc.
              • Cargill Inc. - Overview
              • Cargill Inc. - Product / Service
              • Cargill Inc. - Key news
              • Cargill Inc. - Key offerings
            • 12.6 Conagra Brands Inc.
              • Conagra Brands Inc. - Overview
              • Conagra Brands Inc. - Business segments
              • Conagra Brands Inc. - Key news
              • Conagra Brands Inc. - Key offerings
              • Conagra Brands Inc. - Segment focus
            • 12.7 Danone SA
              • Danone SA - Overview
              • Danone SA - Business segments
              • Danone SA - Key news
              • Danone SA - Key offerings
              • Danone SA - Segment focus
            • 12.8 General Mills Inc.
              • General Mills Inc. - Overview
              • General Mills Inc. - Business segments
              • General Mills Inc. - Key news
              • General Mills Inc. - Key offerings
              • General Mills Inc. - Segment focus
            • 12.9 Kellogg Co.
              • Kellogg Co. - Overview
              • Kellogg Co. - Business segments
              • Kellogg Co. - Key offerings
              • Kellogg Co. - Segment focus
            • 12.10 Mondelez International Inc.
              • Mondelez International Inc. - Overview
              • Mondelez International Inc. - Business segments
              • Mondelez International Inc. - Key news
              • Mondelez International Inc. - Key offerings
              • Mondelez International Inc. - Segment focus
            • 12.11 Nestle SA
              • Nestle SA - Overview
              • Nestle SA - Business segments
              • Nestle SA - Key news
              • Nestle SA - Key offerings
              • Nestle SA - Segment focus
            • 12.12 PepsiCo Inc.
              • PepsiCo Inc. - Overview
              • PepsiCo Inc. - Business segments
              • PepsiCo Inc. - Key news
              • PepsiCo Inc. - Key offerings
              • PepsiCo Inc. - Segment focus
            • 12.13 Tesco Plc
              • Tesco Plc - Overview
              • Tesco Plc - Business segments
              • Tesco Plc - Key offerings
              • Tesco Plc - Segment focus
            • 12.14 The Hain Celestial Group Inc.
              • The Hain Celestial Group Inc. - Overview
              • The Hain Celestial Group Inc. - Business segments
              • The Hain Celestial Group Inc. - Key news
              • The Hain Celestial Group Inc. - Key offerings
              • The Hain Celestial Group Inc. - Segment focus
            • 12.15 The Hershey Co.
              • The Hershey Co. - Overview
              • The Hershey Co. - Business segments
              • The Hershey Co. - Key news
              • The Hershey Co. - Key offerings
              • The Hershey Co. - Segment focus
            • 12.16 The Kraft Heinz Co.
              • The Kraft Heinz Co. - Overview
              • The Kraft Heinz Co. - Business segments
              • The Kraft Heinz Co. - Key news
              • The Kraft Heinz Co. - Key offerings
              • The Kraft Heinz Co. - Segment focus
            • 12.17 Tyson Foods Inc.
              • Tyson Foods Inc. - Overview
              • Tyson Foods Inc. - Business segments
              • Tyson Foods Inc. - Key news
              • Tyson Foods Inc. - Key offerings
              • Tyson Foods Inc. - Segment focus

            13 Appendix

            • 13.1 Scope of the report
              • 13.2 Inclusions and exclusions checklist
                • Inclusions checklist
                • Exclusions checklist
              • 13.3 Currency conversion rates for US$
                • Currency conversion rates for US$
              • 13.4 Research methodology
                • Research methodology
              • 13.5 Data procurement
                • Information sources
              • 13.6 Data validation
                • Data validation
              • 13.7 Validation techniques employed for market sizing
                • Validation techniques employed for market sizing
              • 13.8 Data synthesis
                • Data synthesis
              • 13.9 360 degree market analysis
                • 360 degree market analysis
              • 13.10 List of abbreviations
                • List of abbreviations

              Research Methodology

              Technavio presents a detailed picture of the market by way of study, synthesis, and summation of data from multiple sources. The analysts have presented the various facets of the market with a particular focus on identifying the key industry influencers. The data thus presented is comprehensive, reliable, and the result of extensive research, both primary and secondary.

              INFORMATION SOURCES

              Primary sources

              • Manufacturers and suppliers
              • Channel partners
              • Industry experts
              • Strategic decision makers

              Secondary sources

              • Industry journals and periodicals
              • Government data
              • Financial reports of key industry players
              • Historical data
              • Press releases

              DATA ANALYSIS

              Data Synthesis

              • Collation of data
              • Estimation of key figures
              • Analysis of derived insights

              Data Validation

              • Triangulation with data models
              • Reference against proprietary databases
              • Corroboration with industry experts

              REPORT WRITING

              Qualitative

              • Market drivers
              • Market challenges
              • Market trends
              • Five forces analysis

              Quantitative

              • Market size and forecast
              • Market segmentation
              • Geographical insights
              • Competitive landscape

              Interested in this report?

              Get your sample now to see our research methodology and insights!

              Download Now

              Frequently Asked Questions

              Reduced Fat Packaged Food market growth will increase by $ 18.25 bn during 2024-2028.

              The Reduced Fat Packaged Food market is expected to grow at a CAGR of 4.39% during 2024-2028.

              Reduced Fat Packaged Food market is segmented by Distribution Channel( Supermarkets and hypermarkets, Convenience stores, Specialty stores, Online, Others) Product( Bakery, Dairy, Cereals, Meat products, Others)

              Arla Foods amba, Bunge Ltd., Campbell Soup Co., Cargill Inc., Conagra Brands Inc., Danone SA, General Mills Inc., Kellogg Co., Kerry Group Plc, Land O Lakes Inc., Mondelez International Inc., Nestle SA, PepsiCo Inc., Rockview Farms, Tesco Plc, The Hain Celestial Group Inc., The Hershey Co., The Kraft Heinz Co., Tyson Foods Inc. are a few of the key vendors in the Reduced Fat Packaged Food market.

              Europe will register the highest growth rate of 32% among the other regions. Therefore, the Reduced Fat Packaged Food market in Europe is expected to garner significant business opportunities for the vendors during the forecast period.

              US, China, Germany, UK, Canada

              • Increasing health consciousness among consumersThe rising instances of obesity and related diseases/disorders among people are making them more health conscious is the driving factor this market.
              • and they are demanding food and beverage products that are low in fat and calories. In response to this demand is the driving factor this market.
              • players are coming up with new products that have less fat and calories. The trend of a health and wellness lifestyle is gaining popularity among consumers is the driving factor this market.
              • especially millennials. The number of consumers participating in fitness activities is increasing globally is the driving factor this market.
              • and this factor will help the demand for reduced fat packaged food grow during the forecast period. Many consumers are even ready to pay a premium price for products that offer various functional benefits. The rising demand for reduced fat food and beverage products among consumers is expected to drive the growth of the reduced fat packaged food market during the forecast period. is the driving factor this market.

              The Reduced Fat Packaged Food market vendors should focus on grabbing business opportunities from the Supermarkets and hypermarkets segment as it accounted for the largest market share in the base year.
              RIA - Research AI Assistant
              Ask RIA