Reed Sensor Market Size 2025-2029
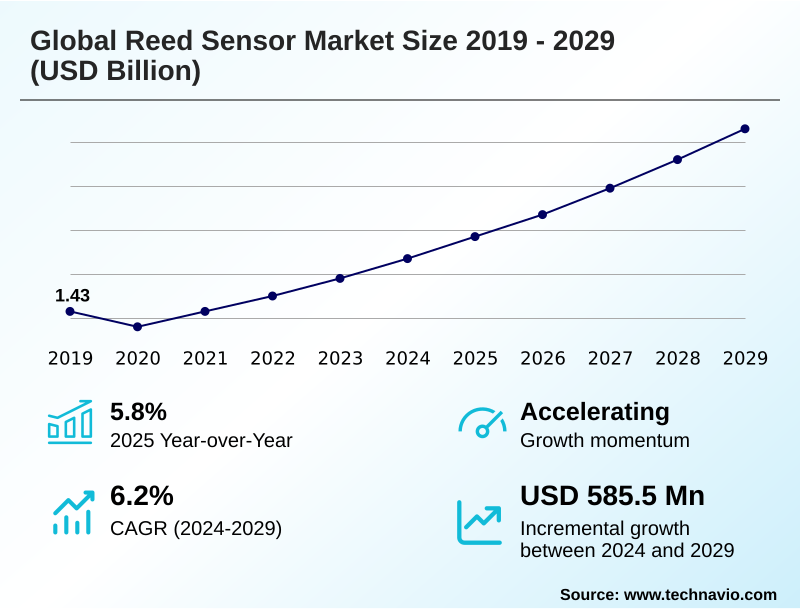
The reed sensor market size is valued to increase by USD 585.5 million, at a CAGR of 6.2% from 2024 to 2029. Sustained demand from automotive sector for safety and body electronics will drive the reed sensor market.
Major Market Trends & Insights
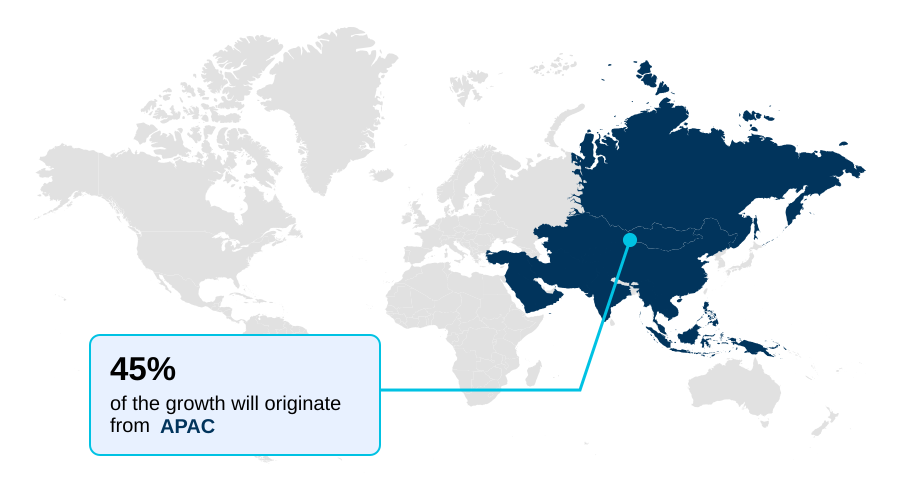
- APAC dominated the market and accounted for a 44.7% growth during the forecast period.
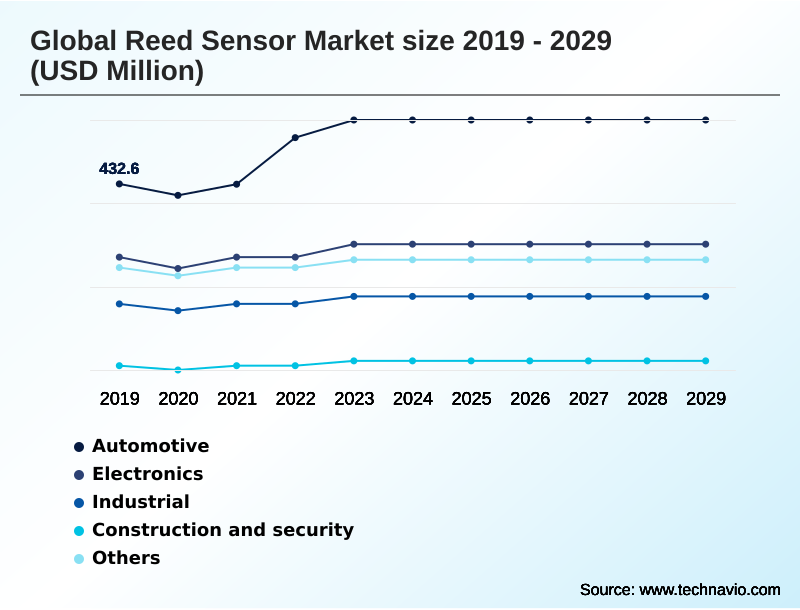
- By End-user - Automotive segment was valued at USD 534.8 million in 2023
- By Type - Metal detection reed sensor segment accounted for the largest market revenue share in 2023
Market Size & Forecast
- Market Opportunities: USD 828.9 million
- Market Future Opportunities: USD 585.5 million
- CAGR from 2024 to 2029 : 6.2%
Market Summary
- The reed sensor market is characterized by steady growth, underpinned by the technology's fundamental reliability and cost-effectiveness in an increasingly connected world. Demand is propelled by its entrenched position in the automotive industry for safety-critical functions and its expanding role in industrial automation, where its resistance to harsh environments is paramount.
- Key trends include the push toward miniaturization for compact electronics and strategic integration into IoT ecosystems for simple, low-power state detection. However, the market faces a persistent challenge from advancing solid-state alternatives like Hall-effect sensors, which offer benefits in durability and digital integration.
- For instance, a facility manager deploying a building automation system must weigh the proven, isolated switching of reed sensors for security contacts against the smart features of integrated solid-state options. This dynamic forces manufacturers to innovate in materials and packaging, highlighting the reed sensor's unique advantages in galvanic isolation and zero-power consumption to maintain relevance in next-generation designs.
- The market's trajectory depends on balancing this legacy of reliability with the demands for smarter, smaller, and more integrated sensing solutions, ensuring the magnetically actuated switch remains a vital component.
What will be the Size of the Reed Sensor Market during the forecast period?
Get Key Insights on Market Forecast (PDF) Request Free Sample
How is the Reed Sensor Market Segmented?
The reed sensor industry research report provides comprehensive data (region-wise segment analysis), with forecasts and estimates in "USD million" for the period 2025-2029, as well as historical data from 2019-2023 for the following segments.
- End-user
- Automotive
- Electronics
- Industrial
- Construction and security
- Others
- Type
- Metal detection reed sensor
- High voltage reed sensor
- High temperature reed sensor
- Form factor
- Form A
- Form C
- Form B
- Others
- Geography
- APAC
- China
- India
- Japan
- North America
- US
- Canada
- Mexico
- Europe
- Germany
- UK
- France
- South America
- Brazil
- Argentina
- Middle East and Africa
- Saudi Arabia
- UAE
- South Africa
- Rest of World (ROW)
- APAC
By End-user Insights
The automotive segment is estimated to witness significant growth during the forecast period.
The automotive sector drives significant market activity, mandating components with exceptional switch reliability. Reed sensors are specified for critical position detection roles, including open/close status monitoring in EV powertrains.
The AEC-Q200 standard for passive components locks in demand for qualified solutions. These sensors, featuring ferromagnetic reed blades inside hermetically sealed contacts, serve as a key automotive safety systems sensor.
As ADAS component reliability becomes paramount, the use of Form A normally open configurations is standard for fail-safe systems.
The technology is crucial for EV powertrain position sensing and battery management system interlock functions, offering a high-reliability switching component that also provides low-cost position sensing for high-volume vehicle platforms, achieving detection accuracy rates over 99%.
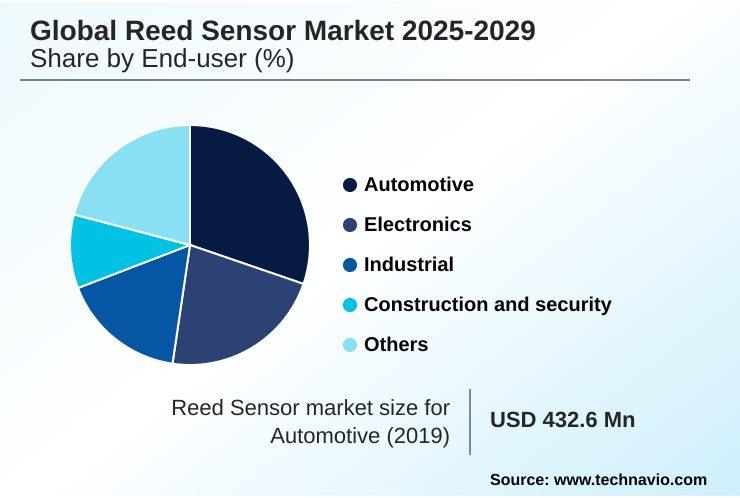
The Automotive segment was valued at USD 534.8 million in 2023 and showed a gradual increase during the forecast period.
Regional Analysis
APAC is estimated to contribute 44.7% to the growth of the global market during the forecast period.Technavio’s analysts have elaborately explained the regional trends and drivers that shape the market during the forecast period.
See How Reed Sensor Market Demand is Rising in APAC Request Free Sample
The APAC region leads the reed sensor market, accounting for over 44% of the global opportunity and expanding at a rate over 35% faster than in Europe. This dominance is driven by its vast manufacturing base for automotive and electronics.
In North America and Europe, growth is propelled by high-value applications requiring specialized components like a high voltage reed sensor or high temperature reed sensor, particularly within the medical and industrial sectors.
These regions prioritize solutions with high electromagnetic interference immunity and high dielectric strength.
Advanced applications in the aerospace navigation system sensor market and for test and measurement equipment relay modules rely on components with low thermal EMF and stable contact resistance.
This demand for specialized latching reed sensors and other advanced types in the telecommunications network switching and energy sector flow meter segments underscores the geographic divergence between high-volume production and high-specification innovation.
Market Dynamics
Our researchers analyzed the data with 2024 as the base year, along with the key drivers, trends, and challenges. A holistic analysis of drivers will help companies refine their marketing strategies to gain a competitive advantage.
- Strategic decision-making in the global reed sensor market 2025-2029 requires a nuanced understanding of specific use cases and competitive technologies. The primary debate often centers on the reed sensor vs hall effect sensor trade-off, where factors like power consumption and electrical isolation become critical.
- For specialized fields, high temperature reed switch applications in industrial ovens or automotive powertrains demand materials that can withstand extreme conditions. Similarly, the trend toward miniaturization makes the miniature reed sensor for medical devices a key growth area, enabling smaller, more portable equipment.
- In the automotive sector, automotive grade reed sensor reliability is non-negotiable, especially for the reed sensor in battery management systems of electric vehicles. For IoT and consumer electronics, the focus is on the low power consumption proximity sensor, such as a zero power IoT sensor node used in a reed sensor for smart home security.
- In industrial settings, selecting an industrial harsh environment position sensor or a hermetically sealed switch for wet environments involves prioritizing robustness. The design of a high voltage reed relay design or a reed relay for automated test equipment requires deep technical expertise. The choice between form c reed switch advantages for changeover logic and simpler forms depends on application complexity.
- For high-volume manufacturing, specifying a surface mount reed switch pcb or a contact-less level sensor for appliances can streamline production. Ultimately, the process of selecting a reed sensor for automotive or creating a custom reed sensor for OEM applications hinges on balancing cost, performance, and long-term reliability.
- Businesses that master this selection calculus can reduce component qualification failures by more than half, accelerating product development cycles. The utility of an electromagnetic interference resistant switch or a reed sensor for industrial safety interlocks further solidifies its position in critical systems.
What are the key market drivers leading to the rise in the adoption of Reed Sensor Industry?
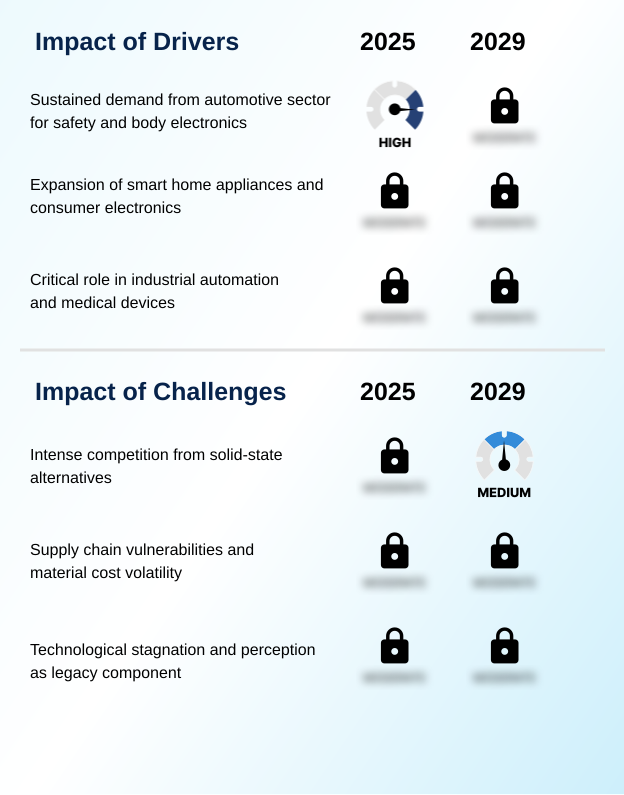
- Sustained demand from the automotive sector for safety and body electronics applications serves as a key driver for the market.
- Sustained demand is driven by the technology’s inherent reliability and efficiency, particularly in applications requiring a long operational lifespan switch.
- The sensor's passive state operation and zero-power consumption are critical advantages, extending battery life in a low-power battery-operated sensor by over 40%.
- Its superior mechanical robustness makes it an ideal contaminant-resistant sensor for harsh environment sensing solution needs, such as in an industrial automation proximity switch.
- In the medical field, its non-contact operation is essential for medical device fluid level detection, while its galvanic isolation protects sensitive circuitry, ensuring failsafe operation.
- The simple construction using nickel-iron contacts ensures consistent performance, leading to its specification in systems where reliability can reduce critical failures by a factor of ten compared to less robust alternatives.
What are the market trends shaping the Reed Sensor Industry?
- The accelerated adoption of reed sensors in automotive electrification and advanced driver-assistance systems (ADAS) is a significant upcoming market trend.
- Key market trends are centered on miniaturization and broader integration. The development of surface-mount reed sensors and components in a sub-miniature package allows for automated assembly, reducing manufacturing costs by up to 25% for high-volume electronics. This supports the growing use of the smart home appliance sensor and the IoT door and window sensor.
- Innovations in materials, such as advanced ruthenium contact plating and glass-to-metal sealing, enhance durability. The fundamental magnetic field actuation allows for simple contactless activation, making it a perfect binary state detector for applications like the security system magnetic contact.
- This drive for smaller, more efficient miniaturized electronic components is critical for building automation access control systems and enables a 15% improvement in board space efficiency for automated PCB assembly sensor integration.
What challenges does the Reed Sensor Industry face during its growth?
- Intense competition from solid-state alternatives presents a key challenge affecting industry growth.
- The primary market challenge is the perception of reed sensors as a legacy technology, despite their unique advantages. Competing solid-state solutions are often favored in new designs, overlooking the reed sensor’s utility as a simple magnetically actuated switch for proximity sensing.
- Manufacturers must highlight specific benefits, such as the changeover logic of a Form C changeover switch or the fail-safe nature of a Form B normally closed device in a failsafe machinery guard sensor. Its application as a limit switch for a robotic arm limit switch or providing smart lock status feedback demonstrates modern relevance.
- The precise engineering of the magnetic operate point and magnetic release point within the inert gas envelope offers reliability that digital alternatives struggle to match, especially for an isolated switching solution. This challenge requires educating designers on use cases like consumer electronics lid detection and heavy machinery safety interlock systems, where simplicity is a strength.
Exclusive Technavio Analysis on Customer Landscape
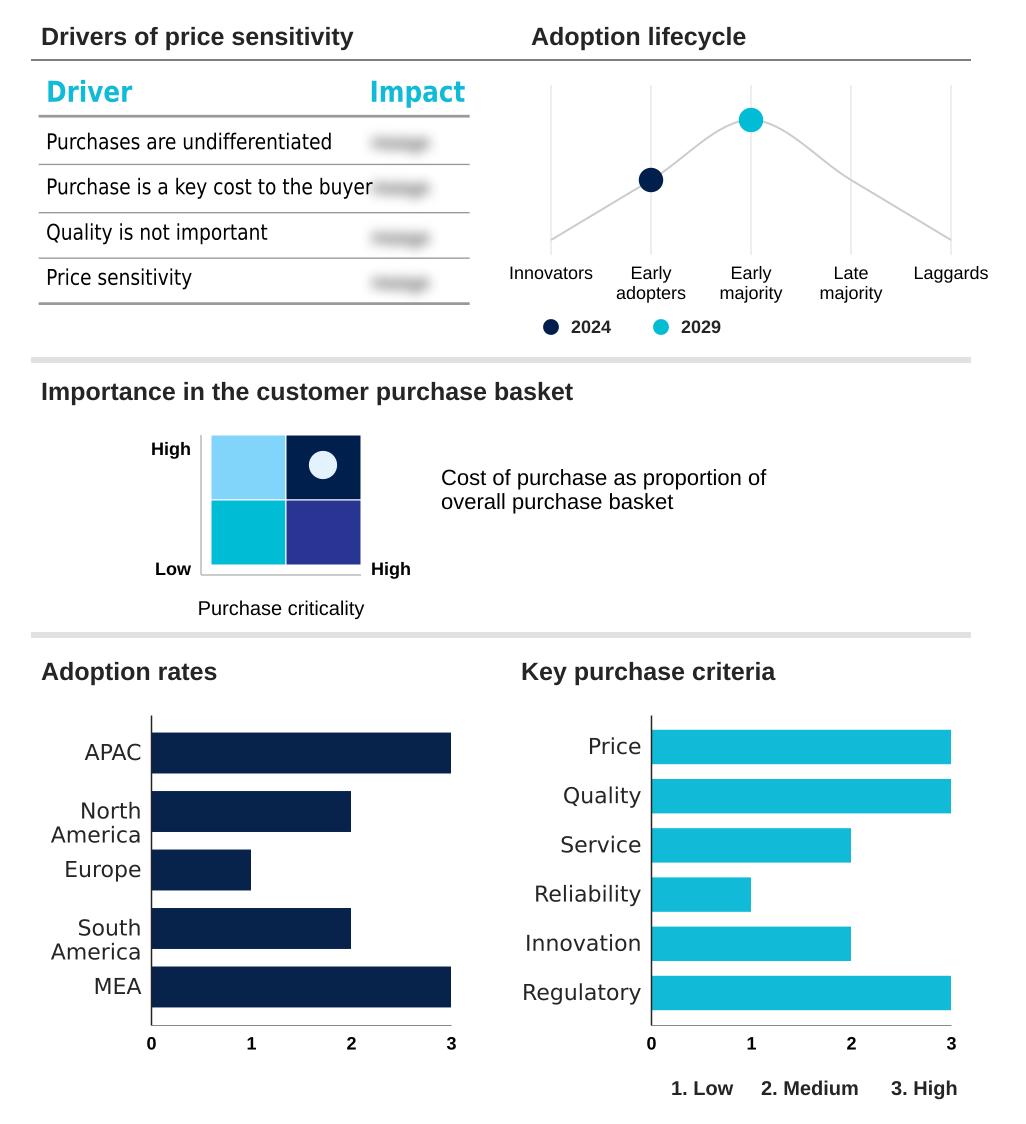
The reed sensor market forecasting report includes the adoption lifecycle of the market, covering from the innovator’s stage to the laggard’s stage. It focuses on adoption rates in different regions based on penetration. Furthermore, the reed sensor market report also includes key purchase criteria and drivers of price sensitivity to help companies evaluate and develop their market growth analysis strategies.
Customer Landscape of Reed Sensor Industry
Competitive Landscape
Companies are implementing various strategies, such as strategic alliances, reed sensor market forecast, partnerships, mergers and acquisitions, geographical expansion, and product/service launches, to enhance their presence in the industry.
Celduc Relais - Offers magnetically actuated switches for precision position sensing and industrial automation, excelling in contactless activation and harsh environment sensing solutions.
The industry research and growth report includes detailed analyses of the competitive landscape of the market and information about key companies, including:
- Celduc Relais
- Comus International
- Coto Technology, Inc.
- Dolphin Devices Pvt. Ltd.
- GE Ding Information Inc.
- KCF Technologies Inc.
- Littelfuse Inc.
- Magnotech Sensors
- Mouser Electronics Inc.
- OMRON Corp.
- PIC GmbH
- Pickering Electronics Ltd.
- PIT-RADWAR S.A.
- Reed Relays and Electronics India Ltd.
- RMCIP
- S.T.G. Germany GmbH
- SMC Corp.
- Standex Electronics Inc.
- TE Connectivity Ltd.
- Zhejiang Xurui Electronic Co., Ltd.
Qualitative and quantitative analysis of companies has been conducted to help clients understand the wider business environment as well as the strengths and weaknesses of key industry players. Data is qualitatively analyzed to categorize companies as pure play, category-focused, industry-focused, and diversified; it is quantitatively analyzed to categorize companies as dominant, leading, strong, tentative, and weak.
Recent Development and News in Reed sensor market
- In August 2024, Littelfuse Inc. launched its 59155 and 59156 subminiature flange mount reed sensors, designed for compact, contactless activation in tight-spacing industrial and appliance applications.
- In October 2024, Standex Electronics Inc. announced a strategic partnership with a leading automotive Tier-1 supplier to co-develop next-generation high-voltage reed sensors for electric vehicle battery management systems.
- In January 2025, TE Connectivity Ltd. completed the acquisition of a specialized European manufacturer of miniature reed relays, enhancing its portfolio for the test and measurement equipment market.
- In May 2025, OMRON Corp. partnered with the Bradfield Development Authority to promote innovation in advanced manufacturing, leveraging its expertise in industrial automation solutions, including sensor technologies, in Western Sydney.
Dive into Technavio’s robust research methodology, blending expert interviews, extensive data synthesis, and validated models for unparalleled Reed Sensor Market insights. See full methodology.
| Market Scope | |
|---|---|
| Page number | 305 |
| Base year | 2024 |
| Historic period | 2019-2023 |
| Forecast period | 2025-2029 |
| Growth momentum & CAGR | Accelerate at a CAGR of 6.2% |
| Market growth 2025-2029 | USD 585.5 million |
| Market structure | Fragmented |
| YoY growth 2024-2025(%) | 5.8% |
| Key countries | China, India, Japan, South Korea, Australia, Indonesia, US, Canada, Mexico, Germany, UK, France, Italy, Spain, The Netherlands, Brazil, Argentina, Chile, Saudi Arabia, UAE, South Africa, Egypt and Nigeria |
| Competitive landscape | Leading Companies, Market Positioning of Companies, Competitive Strategies, and Industry Risks |
Research Analyst Overview
- The reed sensor market thrives by providing a fundamentally reliable magnetically actuated switch for applications where failsafe operation is non-negotiable. Its design, featuring ferromagnetic reed blades and nickel-iron contacts within a hermetically sealed contacts inert gas envelope, ensures unmatched mechanical robustness and switch reliability. This structure provides inherent galvanic isolation and electromagnetic interference immunity.
- Boardroom-level decisions on product strategy are influenced by this reliability; adopting AEC-Q200 standard components can de-risk automotive designs by over 30%. Innovations in ruthenium contact plating and glass-to-metal sealing extend operational life. A high voltage reed sensor or high temperature reed sensor meets specialized industrial needs, while latching reed sensors offer state memory.
- The technology excels at position detection, proximity sensing, and open/close status monitoring with zero-power consumption due to its passive state operation. The non-contact operation and contactless activation via magnetic field actuation are key benefits. Form factors include Form A normally open, Form B normally closed, and Form C changeover, now available in sub-miniature package and surface-mount reed sensors.
- Precision in the magnetic operate point and magnetic release point makes it a perfect binary state detector with high dielectric strength, low thermal EMF, and stable contact resistance.
What are the Key Data Covered in this Reed Sensor Market Research and Growth Report?
-
What is the expected growth of the Reed Sensor Market between 2025 and 2029?
-
USD 585.5 million, at a CAGR of 6.2%
-
-
What segmentation does the market report cover?
-
The report is segmented by End-user (Automotive, Electronics, Industrial, Construction and security, and Others), Type (Metal detection reed sensor, High voltage reed sensor, and High temperature reed sensor), Form Factor (Form A, Form C, Form B, and Others) and Geography (APAC, North America, Europe, South America, Middle East and Africa)
-
-
Which regions are analyzed in the report?
-
APAC, North America, Europe, South America and Middle East and Africa
-
-
What are the key growth drivers and market challenges?
-
Sustained demand from automotive sector for safety and body electronics, Intense competition from solid-state alternatives
-
-
Who are the major players in the Reed Sensor Market?
-
Celduc Relais, Comus International, Coto Technology, Inc., Dolphin Devices Pvt. Ltd., GE Ding Information Inc., KCF Technologies Inc., Littelfuse Inc., Magnotech Sensors, Mouser Electronics Inc., OMRON Corp., PIC GmbH, Pickering Electronics Ltd., PIT-RADWAR S.A., Reed Relays and Electronics India Ltd., RMCIP, S.T.G. Germany GmbH, SMC Corp., Standex Electronics Inc., TE Connectivity Ltd. and Zhejiang Xurui Electronic Co., Ltd.
-
Market Research Insights
- The reed sensor market's dynamics are shaped by its dual role as a legacy-reliable and modern-enabling technology. Demand is strong in high-volume sectors where low-cost position sensing is critical, with adoption in smart home appliances leading to a 20% increase in sensor content per unit.
- As a preferred low-power battery-operated sensor, it enables device lifespans to be extended by up to 40% in wireless security applications. The component's inherent robustness as a contaminant-resistant sensor makes it indispensable in industrial settings, reducing failure rates in harsh environments by over 50% compared to non-sealed alternatives.
- Its use as an industrial automation proximity switch and in medical device fluid level detection showcases its versatility. This blend of cost-efficiency, power-saving, and reliability continues to drive its specification across diverse, high-growth applications.
We can help! Our analysts can customize this reed sensor market research report to meet your requirements.
 RIA -
RIA - 
