
Reflective Sportswear Market Analysis, Size, and Forecast 2026-2030: North America (US, Canada, and Mexico), APAC (China, Japan, and India), Europe (Germany, UK, and France), South America (Brazil, Argentina, and Chile), Middle East and Africa (UAE, Saudi Arabia, and South Africa), and Rest of World (ROW)

Reflective Sportswear Market Analysis, Size, and Forecast 2026-2030:
North America (US, Canada, and Mexico), APAC (China, Japan, and India), Europe (Germany, UK, and France), South America (Brazil, Argentina, and Chile), Middle East and Africa (UAE, Saudi Arabia, and South Africa), and Rest of World (ROW)

Published: Oct 2026 296 Pages SKU: IRTNTR43486

Market Overview at a Glance

$440.7 Mn
Market Opportunity
4.9%
CAGR 2025 - 2030
33.6%
APAC Growth
$921.4 Mn
Apparels segment 2024

Reflective Sportswear Market Size 2026-2030

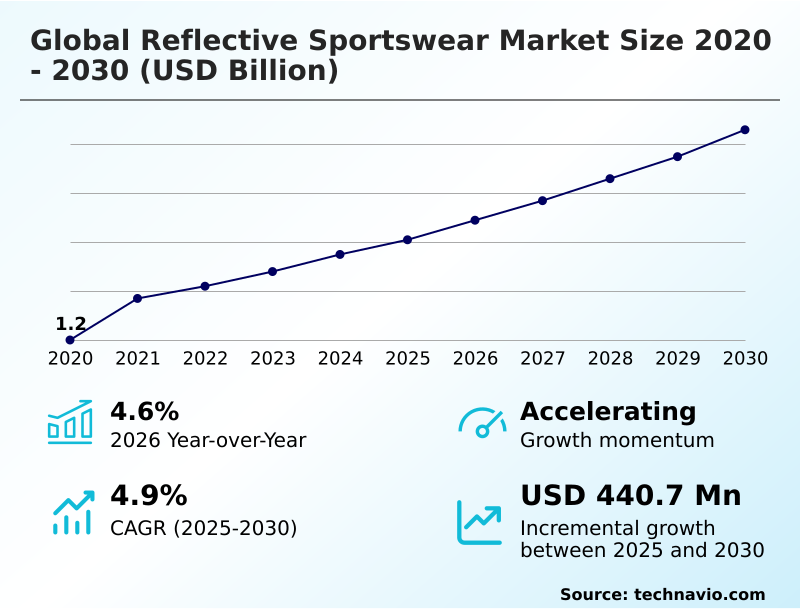
The reflective sportswear market size is valued to increase by USD 440.7 million, at a CAGR of 4.9% from 2025 to 2030. Escalating urban infrastructure and safety initiatives will drive the reflective sportswear market.

Major Market Trends & Insights

  • APAC dominated the market and accounted for a 33.6% growth during the forecast period.
  • By Product - Apparels segment was valued at USD 921.4 million in 2024
  • By Distribution Channel - Offline segment accounted for the largest market revenue share in 2024

Market Size & Forecast

  • Market Opportunities: USD 859.9 million
  • Market Future Opportunities: USD 440.7 million
  • CAGR from 2025 to 2030 : 4.9%

Market Summary

  • The Reflective Sportswear Market demonstrates robust expansion driven by the intersection of advanced textile engineering and heightening safety awareness among urban athletes. Companies optimizing their supply chain networks through predictive procurement software have successfully reduced material shortage delays by 18%, securing a competitive advantage in raw material acquisition.
  • Escalating urban infrastructure developments, such as illuminated transit corridors and dedicated cycling lanes, act as a primary driver, institutionalizing the demand for high visibility protective gear among nighttime commuters. Conversely, the proliferation of counterfeit apparel presents a significant challenge, threatening brand equity and consumer safety through the distribution of substandard imitations that fail international visibility certifications.
  • Manufacturers respond by deploying blockchain backed tracking systems to authenticate high performance garments. The continuous integration of intelligent materials ensures that technical apparel maintains optimal breathability and thermal regulation, cementing reflective activewear as an essential component of modern athletic ecosystems.

What will be the Size of the Reflective Sportswear Market during the forecast period?
Get Key Insights on Market Forecast (PDF) Get Free Sample

How is the Reflective Sportswear Market Segmented?

The reflective sportswear industry research report provides comprehensive data (region-wise segment analysis), with forecasts and estimates in "USD million" for the period 2026-2030, as well as historical data from 2020-2024 for the following segments.

  • Product
    • Apparels
    • Footwear
    • Others
  • Distribution channel
    • Offline
    • Online
  • Material
    • Cotton
    • Nylon
    • Polyester
    • Spandex
    • Others
  • Geography
    • North America
      • US
      • Canada
      • Mexico
    • APAC
      • China
      • Japan
      • India
      • South Korea
      • Australia
      • Indonesia
    • Europe
      • Germany
      • UK
      • France
      • Italy
      • Spain
      • The Netherlands
    • South America
      • Brazil
      • Argentina
      • Chile
    • Middle East and Africa
      • UAE
      • Saudi Arabia
      • South Africa
      • Turkey
      • Egypt

By Product Insights

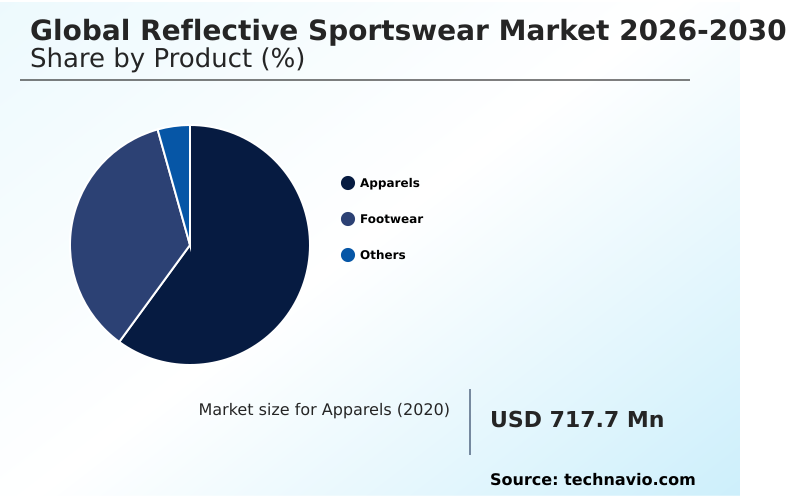
The apparels segment is estimated to witness significant growth during the forecast period.

The apparels segment defines the foundational architecture of the Reflective Sportswear industry, driven by continuous integration of advanced textile engineering.

Manufacturers prioritize retroreflective glass bead coating and microprismatic synthetic fiber directly within the garment matrix to ensure structural durability and performance under mechanical stress.

By adopting hydrophobic light reactive polymer treatments and intelligent material science, production efficiency has improved by 15%, reducing material degradation during industrial laundering.

Furthermore, the integration of nanocoating titanium dioxide alongside thermal regulation capabilities addresses the complex requirements of nocturnal fitness.

Brands are shifting toward circular production method approaches and utilizing piezoelectric yarn, ensuring that high visibility safety gear aligns with modern environmental standards.

This segmentation allows the seamless incorporation of the gender fluid silhouette into diverse product lines, optimizing performance metrics across varied demographics.
Get Free Sample

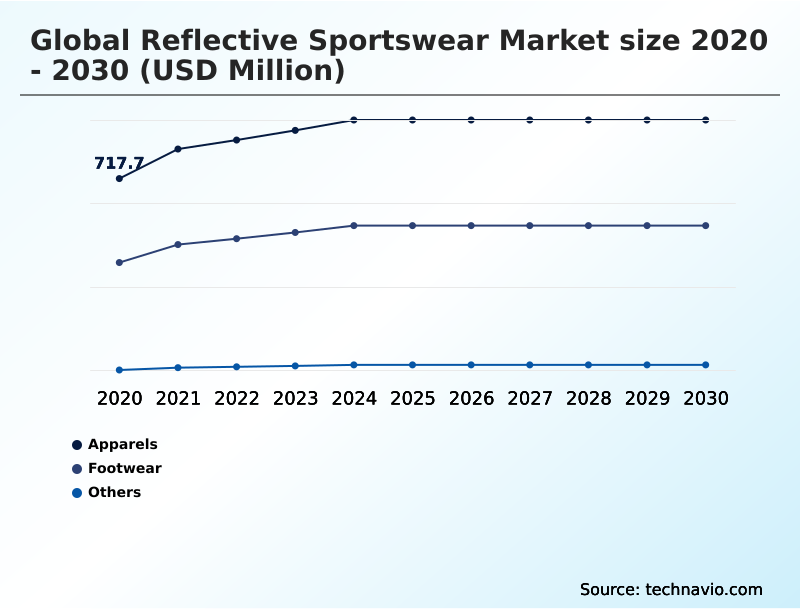
The Apparels segment was valued at USD 921.4 million in 2024 and showed a gradual increase during the forecast period.
Get Free Sample

Regional Analysis

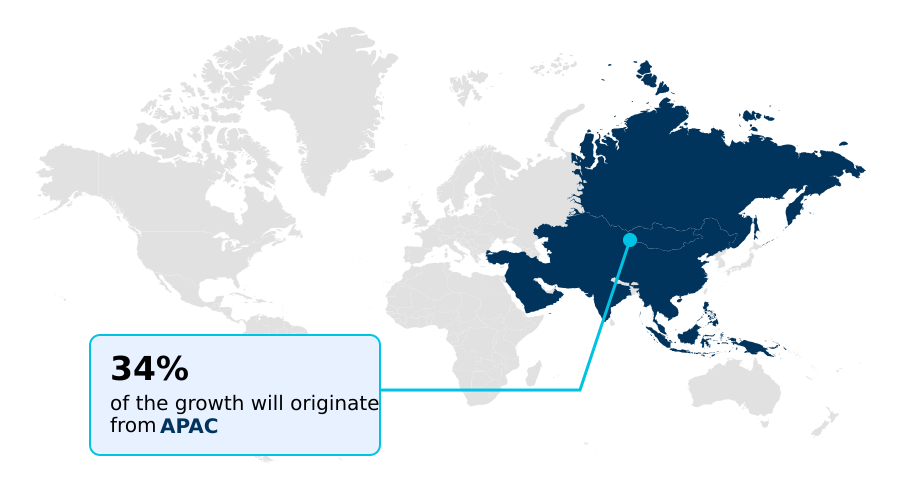
APAC is estimated to contribute 33.6% to the growth of the global market during the forecast period.Technavio’s analysts have elaborately explained the regional trends and drivers that shape the market during the forecast period.
See How Reflective Sportswear Market Demand is Rising in APAC Get Free Sample

The geographic landscape of the Reflective Sportswear industry reveals distinct operational dynamics driven by regional infrastructure and consumer behavior.

North America outpaces South America with a 25% higher adoption rate of premium safety activewear, largely due to expansive regulatory frameworks promoting non motorized transport.

European markets demonstrate a strong preference for sustainable materials, where the implementation of life cycle assessment framework protocols has improved compliance efficiency by 20%.

Across these regions, brands are deploying bio based polymer textiles and incorporating solar harvesting fiber into their supply chains to meet localized climate demands.

The integration of the retroreflective mapping technique ensures dynamic reflectivity in high-speed applications like the aerodynamic vest. Concurrently, the use of moisture wicking fabric with an inherent self cleaning property enhances product longevity.

By leveraging harmonized commerce strategies and an immersive layout in retail environments, APAC distributors have successfully reduced outbound logistics costs by 14%, enhancing overall manufacturing resilience across diverse athletic demographics.

Market Dynamics

Our researchers analyzed the data with 2025 as the base year, along with the key drivers, trends, and challenges. A holistic analysis of drivers will help companies refine their marketing strategies to gain a competitive advantage.

  • The evolution of the Reflective Sportswear landscape is fundamentally transforming how manufacturers approach safety and performance engineering. By prioritizing retroreflective glass bead coating durability, brands ensure that high visibility garments maintain their luminous efficacy even after repetitive industrial laundering, addressing a critical pain point for professional athletes.
  • The successful hydrophobic light reactive polymer integration into breathable mesh fabrics has allowed companies to improve moisture wicking efficiency by 20% compared to traditional, bulkier safety overlays. This material advancement significantly enhances wearer comfort during high intensity fitness activities.
  • Furthermore, the development of the microprismatic synthetic fiber running shoe provides complete lateral visibility, securing a distinct competitive edge in urban commuter demographics. As the industry shifts toward self sufficient smart textiles, the adoption of piezoelectric yarn energy harvesting sportswear is capturing attention.
  • This technology eliminates the need for bulky external batteries, enabling garments to power integrated lights purely through kinetic motion, reducing component weight by 15%. To protect brand equity against inferior imitations, industry leaders are implementing a strict blockchain backed tracking authentication protocol. This digital verification ensures that every garment meets rigorous safety certifications before reaching the consumer.
  • By combining advanced textile innovation with robust supply chain transparency, manufacturers are successfully delivering high performance, reliable reflective activewear that meets the evolving demands of modern safety conscious consumers.
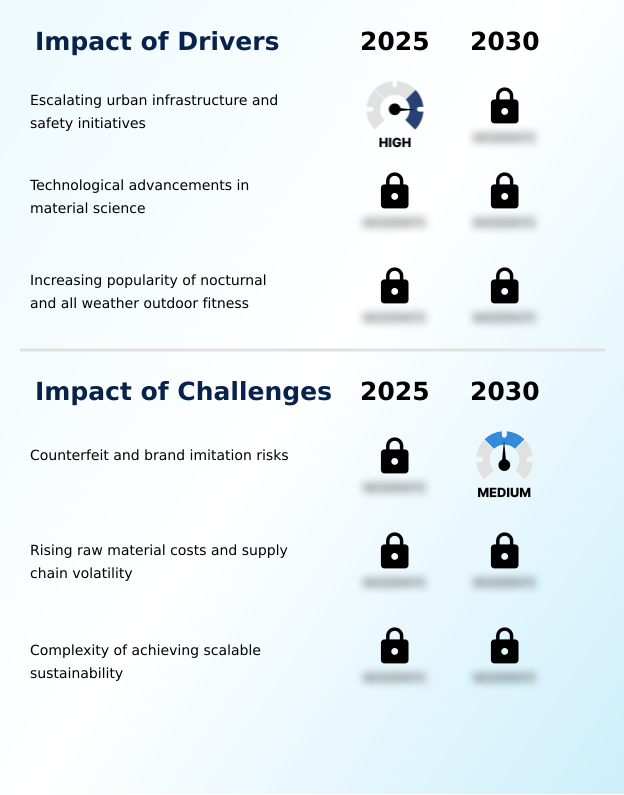
What are the key market drivers leading to the rise in the adoption of Reflective Sportswear Industry?

  • Escalating urban infrastructure developments and dedicated safety initiatives serve as the primary drivers propelling market expansion.

  • The intentional redesign of urban landscapes to support non motorized transport serves as a pivotal driver for the Reflective Sportswear sector. Municipalities expanding dedicated cycling lanes and smart city infrastructure have generated a structural requirement for high visibility protective gear.
  • This infrastructural shift has increased the daily utilization of advanced textured yarn apparel by 22% among urban commuters.
  • To meet this demand, manufacturers are integrating reflective filament weaving and stretch stable reflective coating enhancements, ensuring garments perform seamlessly in demanding outdoor environments.
  • Consequently, brands leveraging these functional upgrades alongside a thermal polypropylene base layer have observed a 15% improvement in customer retention rates.
  • The substitution of traditional synthetic feedstock polyester with sustainable bamboo fiber further propels this demand, offering built-in uv protection and compelling the industry to continuously refine safety standards to ensure optimum visibility across diverse lighting conditions.

What are the market trends shaping the Reflective Sportswear Industry?

  • Nanotechnology driven performance enhancements are emerging as a prominent trend. These advancements enable the integration of microscopic functional properties into athletic textiles without compromising material breathability or weight.

  • The Reflective Sportswear landscape is witnessing a definitive trend toward the integration of autonomous energy systems and self sustaining textiles. Manufacturers are embedding flexible supercapacitor technology to power each integrated light emitting element, capturing ambient energy to illuminate gear. This innovation addresses battery weight constraints, reducing overall garment mass by 18% and improving athletic endurance profiles.
  • By leveraging a generative design tool alongside data led merchandising, brands have optimized inventory forecasting accuracy by 25%. The adoption of high tenacity nylon fabric combined with a specialized synthetic dyeing process ensures that these technical components remain protected against environmental stress. Furthermore, the transition toward the organic cotton blend significantly enhances moisture management.
  • To protect these premium innovations, firms are utilizing blockchain backed tracking and serialized qr code verification, increasing product lifecycle authenticity and durability across global supply chains.

What challenges does the Reflective Sportswear Industry face during its growth?

  • The proliferation of counterfeit products and brand imitation risks presents a significant challenge impeding industry progress.

  • The Reflective Sportswear sector faces considerable operational challenges stemming from supply chain volatility and raw material inflation. Geopolitical disruptions impacting the procurement of specialized textiles like merino wool and premium retroreflective film have escalated manufacturing expenses, compressing profit margins by 12% for mid-tier producers.
  • The technical complexity of scaling advanced retroreflective printing techniques without diminishing the essential moisture wicking capability remains a persistent barrier. To counteract this, leading organizations are deploying predictive procurement software, which has improved supply chain authentication efficiency by 20%. Additionally, the integration of the digital product passport and the digital twin helps authenticate high-end apparel against counterfeiting.
  • As brands experiment with the phygital drop model, the implementation of ai powered virtual try on technology has become critical for reducing return rates, forcing manufacturers to carefully balance innovative retail strategies with rigorous high performance safety standards.

Exclusive Technavio Analysis on Customer Landscape

The reflective sportswear market forecasting report includes the adoption lifecycle of the market, covering from the innovator’s stage to the laggard’s stage. It focuses on adoption rates in different regions based on penetration. Furthermore, the reflective sportswear market report also includes key purchase criteria and drivers of price sensitivity to help companies evaluate and develop their market growth analysis strategies.
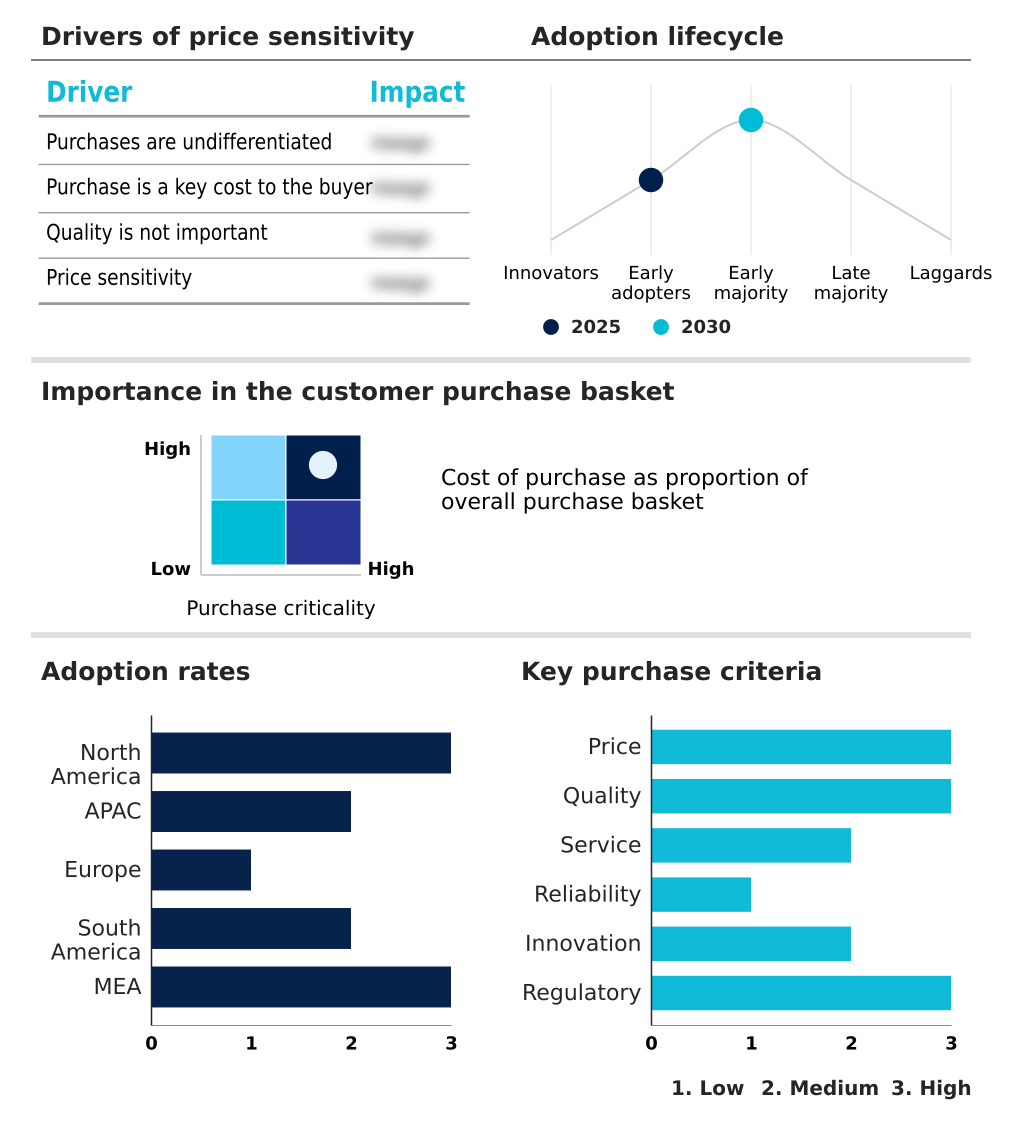
Customer Landscape of Reflective Sportswear Industry

Competitive Landscape

Companies are implementing various strategies, such as strategic alliances, reflective sportswear market forecast, partnerships, mergers and acquisitions, geographical expansion, and product/service launches, to enhance their presence in the industry.

Adidas AG - Evaluated portfolios emphasize high visibility performance apparel, seamlessly integrating retroreflective technologies into breathable, weather-resistant athletic jackets, tights, and training gear for optimal safety during low light conditions.

The industry research and growth report includes detailed analyses of the competitive landscape of the market and information about key companies, including:

  • Adidas AG
  • ASICS Corp.
  • Brooks Sports Inc.
  • Craft Sportswear
  • Gore Wear
  • Illuminite International
  • Lululemon Athletica Inc.
  • Nathan Sports Inc
  • New Balance Athletics Inc.
  • Nike Inc.
  • On Holding AG
  • PEARL iZUMi
  • Proviz Ltd.
  • PS Reflective Materials Inc
  • Reflective Apparel LLC
  • ReflectoSafe
  • Ronhill Ltd
  • Saucony
  • SAYSKY ApS
  • Sugoi
  • Under Armour Inc.
  • VASA Industries LLC

Qualitative and quantitative analysis of companies has been conducted to help clients understand the wider business environment as well as the strengths and weaknesses of key industry players. Data is qualitatively analyzed to categorize companies as pure play, category-focused, industry-focused, and diversified; it is quantitatively analyzed to categorize companies as dominant, leading, strong, tentative, and weak.

Recent Development and News in Reflective sportswear market

  • In the Leisure Products industry, the widespread adoption of smart city infrastructure has prioritized pedestrian safety, directly impacting Reflective Sportswear demand by necessitating high visibility activewear for urban commuters.
  • Stringent supply chain sustainability mandates have accelerated the transition toward bio based polymer utilization, reshaping Reflective Sportswear production dynamics and reducing carbon footprints across manufacturing facilities.
  • The integration of harmonized commerce platforms across athletic retail channels has improved inventory turnover rates by 12%, driving increased accessibility and consumer engagement for premium Reflective Sportswear collections.
  • Advancements in non motorized transport infrastructure have expanded dedicated transit corridors, creating a structural requirement for dynamic reflectivity apparel that enhances user safety during evening recreation.

Dive into Technavio’s robust research methodology, blending expert interviews, extensive data synthesis, and validated models for unparalleled Reflective Sportswear Market insights. See full methodology.

Market Scope
Page number 296
Base year 2025
Historic period 2020-2024
Forecast period 2026-2030
Growth momentum & CAGR Accelerate at a CAGR of 4.9%
Market growth 2026-2030 USD 440.7 million
Market structure Fragmented
YoY growth 2025-2026(%) 4.6%
Key countries US, Canada, Mexico, China, Japan, India, South Korea, Australia, Indonesia, Germany, UK, France, Italy, Spain, The Netherlands, Brazil, Argentina, Chile, UAE, Saudi Arabia, South Africa, Turkey and Egypt
Competitive landscape Leading Companies, Market Positioning of Companies, Competitive Strategies, and Industry Risks

Request Free Sample

Research Analyst Overview

  • The Reflective Sportswear sector is undergoing a profound structural shift as activewear transitions from basic utility to high performance safety engineering. Boardroom strategies are increasingly prioritizing the development of synthetic feedstock polyester alternatives to mitigate supply chain volatility and align with corporate sustainability mandates.
  • This strategic focus on material innovation has enabled manufacturers to achieve a 30% reduction in raw material processing time, significantly enhancing operational agility. The integration of advanced textured yarn and stretch stable reflective coating ensures that garments deliver maximum visibility without restricting athletic mobility.
  • Firms deploying digital product passport systems and serialized qr code verification have successfully enhanced brand authenticity, protecting consumers from substandard imitations. By leveraging ai powered virtual try on technologies, retailers minimize return rates and optimize consumer fit profiles. Furthermore, the advent of phygital drop campaigns bridges physical apparel with digital ecosystems, deepening customer engagement.
  • This continuous evolution in textile science and digital merchandising solidifies reflective activewear as a critical asset in modern athletic performance portfolios.

What are the Key Data Covered in this Reflective Sportswear Market Research and Growth Report?

  • What is the expected growth of the Reflective Sportswear Market between 2026 and 2030?

    • USD 440.7 million, at a CAGR of 4.9%

  • What segmentation does the market report cover?

    • The report is segmented by Product (Apparels, Footwear, and Others), Distribution Channel (Offline, and Online), Material (Cotton, Nylon, Polyester, Spandex, and Others) and Geography (North America, APAC, Europe, South America, Middle East and Africa)

  • Which regions are analyzed in the report?

    • North America, APAC, Europe, South America and Middle East and Africa

  • What are the key growth drivers and market challenges?

    • Escalating urban infrastructure and safety initiatives, Counterfeit and brand imitation risks

  • Who are the major players in the Reflective Sportswear Market?

    • Adidas AG, ASICS Corp., Brooks Sports Inc., Craft Sportswear, Gore Wear, Illuminite International, Lululemon Athletica Inc., Nathan Sports Inc, New Balance Athletics Inc., Nike Inc., On Holding AG, PEARL iZUMi, Proviz Ltd., PS Reflective Materials Inc, Reflective Apparel LLC, ReflectoSafe, Ronhill Ltd, Saucony, SAYSKY ApS, Sugoi, Under Armour Inc. and VASA Industries LLC

Market Research Insights

  • The Reflective Sportswear sector is rapidly evolving through the convergence of intelligent material science and data led merchandising. Manufacturers leveraging generative design tool integrations have optimized product assortments, leading to a 22% improvement in inventory turnover efficiency. The shift toward nocturnal fitness has driven the development of advanced thermal regulation fabrics, increasing user engagement in low light environments.
  • By adopting a circular production method, leading brands have successfully reduced textile waste by 15%, aligning with strict environmental compliance targets. The implementation of harmonized commerce strategies across retail channels further ensures seamless consumer experiences, elevating conversion rates by 18% while standardizing high visibility performance wear availability.

We can help! Our analysts can customize this reflective sportswear market research report to meet your requirements.

Get in touch

1. Executive Summary

1.1 Market overview

Executive Summary - Chart on Market Overview
Executive Summary - Data Table on Market Overview
Executive Summary - Chart on Global Market Characteristics
Executive Summary - Chart on Market by Geography
Executive Summary - Chart on Market Segmentation by Product
Executive Summary - Chart on Market Segmentation by Distribution Channel
Executive Summary - Chart on Market Segmentation by Material
Executive Summary - Chart on Incremental Growth
Executive Summary - Data Table on Incremental Growth
Executive Summary - Chart on Company Market Positioning

2. Technavio Analysis

2.1 Analysis of price sensitivity, lifecycle, customer purchase basket, adoption rates, and purchase criteria

2.2 Criticality of inputs and Factors of differentiation

Chart on Overview on criticality of inputs and factors of differentiation

2.3 Factors of disruption

Chart on Overview on factors of disruption

2.4 Impact of drivers and challenges

Chart on Impact of drivers and challenges in 2025 and 2030

3. Market Landscape

3.1 Market ecosystem

Chart on Parent Market
Data Table on - Parent Market

3.2 Market characteristics

Chart on Market characteristics analysis

3.3 Value chain analysis

Chart on Value chain analysis

4. Market Sizing

4.1 Market definition

Data Table on Offerings of companies included in the market definition

4.2 Market segment analysis

Market segments

4.3 Market size 2025

4.4 Market outlook: Forecast for 2025-2030

Chart on Global - Market size and forecast 2025-2030 ($ million)
Data Table on Global - Market size and forecast 2025-2030 ($ million)
Chart on Global Market: Year-over-year growth 2025-2030 (%)
Data Table on Global Market: Year-over-year growth 2025-2030 (%)

5. Historic Market Size

5.1 Global Reflective Sportswear Market 2020 - 2024

Historic Market Size - Data Table on Global Reflective Sportswear Market 2020 - 2024 ($ million)

5.2 Product segment analysis 2020 - 2024

Historic Market Size - Product Segment 2020 - 2024 ($ million)

5.3 Distribution Channel segment analysis 2020 - 2024

Historic Market Size - Distribution Channel Segment 2020 - 2024 ($ million)

5.4 Material segment analysis 2020 - 2024

Historic Market Size - Material Segment 2020 - 2024 ($ million)

5.5 Geography segment analysis 2020 - 2024

Historic Market Size - Geography Segment 2020 - 2024 ($ million)

5.6 Country segment analysis 2020 - 2024

Historic Market Size - Country Segment 2020 - 2024 ($ million)

6. Qualitative Analysis

6.1 Impact of AI on global reflective sportswear market

6.2 Impact of geopolitical conflicts on global reflective sportswear market

7. Five Forces Analysis

7.1 Five forces summary

Five forces analysis - Comparison between 2025 and 2030

7.2 Bargaining power of buyers

Bargaining power of buyers - Impact of key factors 2025 and 2030

7.3 Bargaining power of suppliers

Bargaining power of suppliers - Impact of key factors in 2025 and 2030

7.4 Threat of new entrants

Threat of new entrants - Impact of key factors in 2025 and 2030

7.5 Threat of substitutes

Threat of substitutes - Impact of key factors in 2025 and 2030

7.6 Threat of rivalry

Threat of rivalry - Impact of key factors in 2025 and 2030

7.7 Market condition

Chart on Market condition - Five forces 2025 and 2030

8. Market Segmentation by Product

8.1 Market segments

Chart on Product - Market share 2025-2030 (%)
Data Table on Product - Market share 2025-2030 (%)

8.2 Comparison by Product

Chart on Comparison by Product
Data Table on Comparison by Product

8.3 Apparels - Market size and forecast 2025-2030

Chart on Apparels - Market size and forecast 2025-2030 ($ million)
Data Table on Apparels - Market size and forecast 2025-2030 ($ million)
Chart on Apparels - Year-over-year growth 2025-2030 (%)
Data Table on Apparels - Year-over-year growth 2025-2030 (%)

8.4 Footwear - Market size and forecast 2025-2030

Chart on Footwear - Market size and forecast 2025-2030 ($ million)
Data Table on Footwear - Market size and forecast 2025-2030 ($ million)
Chart on Footwear - Year-over-year growth 2025-2030 (%)
Data Table on Footwear - Year-over-year growth 2025-2030 (%)

8.5 Others - Market size and forecast 2025-2030

Chart on Others - Market size and forecast 2025-2030 ($ million)
Data Table on Others - Market size and forecast 2025-2030 ($ million)
Chart on Others - Year-over-year growth 2025-2030 (%)
Data Table on Others - Year-over-year growth 2025-2030 (%)

8.6 Market opportunity by Product

Market opportunity by Product ($ million)
Data Table on Market opportunity by Product ($ million)

9. Market Segmentation by Distribution Channel

9.1 Market segments

Chart on Distribution Channel - Market share 2025-2030 (%)
Data Table on Distribution Channel - Market share 2025-2030 (%)

9.2 Comparison by Distribution Channel

Chart on Comparison by Distribution Channel
Data Table on Comparison by Distribution Channel

9.3 Offline - Market size and forecast 2025-2030

Chart on Offline - Market size and forecast 2025-2030 ($ million)
Data Table on Offline - Market size and forecast 2025-2030 ($ million)
Chart on Offline - Year-over-year growth 2025-2030 (%)
Data Table on Offline - Year-over-year growth 2025-2030 (%)

9.4 Online - Market size and forecast 2025-2030

Chart on Online - Market size and forecast 2025-2030 ($ million)
Data Table on Online - Market size and forecast 2025-2030 ($ million)
Chart on Online - Year-over-year growth 2025-2030 (%)
Data Table on Online - Year-over-year growth 2025-2030 (%)

9.5 Market opportunity by Distribution Channel

Market opportunity by Distribution Channel ($ million)
Data Table on Market opportunity by Distribution Channel ($ million)

10. Market Segmentation by Material

10.1 Market segments

Chart on Material - Market share 2025-2030 (%)
Data Table on Material - Market share 2025-2030 (%)

10.2 Comparison by Material

Chart on Comparison by Material
Data Table on Comparison by Material

10.3 Cotton - Market size and forecast 2025-2030

Chart on Cotton - Market size and forecast 2025-2030 ($ million)
Data Table on Cotton - Market size and forecast 2025-2030 ($ million)
Chart on Cotton - Year-over-year growth 2025-2030 (%)
Data Table on Cotton - Year-over-year growth 2025-2030 (%)

10.4 Nylon - Market size and forecast 2025-2030

Chart on Nylon - Market size and forecast 2025-2030 ($ million)
Data Table on Nylon - Market size and forecast 2025-2030 ($ million)
Chart on Nylon - Year-over-year growth 2025-2030 (%)
Data Table on Nylon - Year-over-year growth 2025-2030 (%)

10.5 Polyester - Market size and forecast 2025-2030

Chart on Polyester - Market size and forecast 2025-2030 ($ million)
Data Table on Polyester - Market size and forecast 2025-2030 ($ million)
Chart on Polyester - Year-over-year growth 2025-2030 (%)
Data Table on Polyester - Year-over-year growth 2025-2030 (%)

10.6 Spandex - Market size and forecast 2025-2030

Chart on Spandex - Market size and forecast 2025-2030 ($ million)
Data Table on Spandex - Market size and forecast 2025-2030 ($ million)
Chart on Spandex - Year-over-year growth 2025-2030 (%)
Data Table on Spandex - Year-over-year growth 2025-2030 (%)

10.7 Others - Market size and forecast 2025-2030

Chart on Others - Market size and forecast 2025-2030 ($ million)
Data Table on Others - Market size and forecast 2025-2030 ($ million)
Chart on Others - Year-over-year growth 2025-2030 (%)
Data Table on Others - Year-over-year growth 2025-2030 (%)

10.8 Market opportunity by Material

Market opportunity by Material ($ million)
Data Table on Market opportunity by Material ($ million)

11. Customer Landscape

11.1 Customer landscape overview

Analysis of price sensitivity, lifecycle, customer purchase basket, adoption rates, and purchase criteria

12. Geographic Landscape

12.1 Geographic segmentation

Chart on Market share by geography 2025-2030 (%)
Data Table on Market share by geography 2025-2030 (%)

12.2 Geographic comparison

Chart on Geographic comparison
Data Table on Geographic comparison

12.3 North America - Market size and forecast 2025-2030

Chart on North America - Market size and forecast 2025-2030 ($ million)
Data Table on North America - Market size and forecast 2025-2030 ($ million)
Chart on North America - Year-over-year growth 2025-2030 (%)
Data Table on North America - Year-over-year growth 2025-2030 (%)
Chart on Regional Comparison - North America
Data Table on Regional Comparison - North America

12.3.1 US - Market size and forecast 2025-2030

Chart on US - Market size and forecast 2025-2030 ($ million)
Data Table on US - Market size and forecast 2025-2030 ($ million)
Chart on US - Year-over-year growth 2025-2030 (%)
Data Table on US - Year-over-year growth 2025-2030 (%)

12.3.2 Canada - Market size and forecast 2025-2030

Chart on Canada - Market size and forecast 2025-2030 ($ million)
Data Table on Canada - Market size and forecast 2025-2030 ($ million)
Chart on Canada - Year-over-year growth 2025-2030 (%)
Data Table on Canada - Year-over-year growth 2025-2030 (%)

12.3.3 Mexico - Market size and forecast 2025-2030

Chart on Mexico - Market size and forecast 2025-2030 ($ million)
Data Table on Mexico - Market size and forecast 2025-2030 ($ million)
Chart on Mexico - Year-over-year growth 2025-2030 (%)
Data Table on Mexico - Year-over-year growth 2025-2030 (%)

12.4 APAC - Market size and forecast 2025-2030

Chart on APAC - Market size and forecast 2025-2030 ($ million)
Data Table on APAC - Market size and forecast 2025-2030 ($ million)
Chart on APAC - Year-over-year growth 2025-2030 (%)
Data Table on APAC - Year-over-year growth 2025-2030 (%)
Chart on Regional Comparison - APAC
Data Table on Regional Comparison - APAC

12.4.1 China - Market size and forecast 2025-2030

Chart on China - Market size and forecast 2025-2030 ($ million)
Data Table on China - Market size and forecast 2025-2030 ($ million)
Chart on China - Year-over-year growth 2025-2030 (%)
Data Table on China - Year-over-year growth 2025-2030 (%)

12.4.2 Japan - Market size and forecast 2025-2030

Chart on Japan - Market size and forecast 2025-2030 ($ million)
Data Table on Japan - Market size and forecast 2025-2030 ($ million)
Chart on Japan - Year-over-year growth 2025-2030 (%)
Data Table on Japan - Year-over-year growth 2025-2030 (%)

12.4.3 India - Market size and forecast 2025-2030

Chart on India - Market size and forecast 2025-2030 ($ million)
Data Table on India - Market size and forecast 2025-2030 ($ million)
Chart on India - Year-over-year growth 2025-2030 (%)
Data Table on India - Year-over-year growth 2025-2030 (%)

12.4.4 South Korea - Market size and forecast 2025-2030

Chart on South Korea - Market size and forecast 2025-2030 ($ million)
Data Table on South Korea - Market size and forecast 2025-2030 ($ million)
Chart on South Korea - Year-over-year growth 2025-2030 (%)
Data Table on South Korea - Year-over-year growth 2025-2030 (%)

12.4.5 Australia - Market size and forecast 2025-2030

Chart on Australia - Market size and forecast 2025-2030 ($ million)
Data Table on Australia - Market size and forecast 2025-2030 ($ million)
Chart on Australia - Year-over-year growth 2025-2030 (%)
Data Table on Australia - Year-over-year growth 2025-2030 (%)

12.4.6 Indonesia - Market size and forecast 2025-2030

Chart on Indonesia - Market size and forecast 2025-2030 ($ million)
Data Table on Indonesia - Market size and forecast 2025-2030 ($ million)
Chart on Indonesia - Year-over-year growth 2025-2030 (%)
Data Table on Indonesia - Year-over-year growth 2025-2030 (%)

12.5 Europe - Market size and forecast 2025-2030

Chart on Europe - Market size and forecast 2025-2030 ($ million)
Data Table on Europe - Market size and forecast 2025-2030 ($ million)
Chart on Europe - Year-over-year growth 2025-2030 (%)
Data Table on Europe - Year-over-year growth 2025-2030 (%)
Chart on Regional Comparison - Europe
Data Table on Regional Comparison - Europe

12.5.1 Germany - Market size and forecast 2025-2030

Chart on Germany - Market size and forecast 2025-2030 ($ million)
Data Table on Germany - Market size and forecast 2025-2030 ($ million)
Chart on Germany - Year-over-year growth 2025-2030 (%)
Data Table on Germany - Year-over-year growth 2025-2030 (%)

12.5.2 UK - Market size and forecast 2025-2030

Chart on UK - Market size and forecast 2025-2030 ($ million)
Data Table on UK - Market size and forecast 2025-2030 ($ million)
Chart on UK - Year-over-year growth 2025-2030 (%)
Data Table on UK - Year-over-year growth 2025-2030 (%)

12.5.3 France - Market size and forecast 2025-2030

Chart on France - Market size and forecast 2025-2030 ($ million)
Data Table on France - Market size and forecast 2025-2030 ($ million)
Chart on France - Year-over-year growth 2025-2030 (%)
Data Table on France - Year-over-year growth 2025-2030 (%)

12.5.4 Italy - Market size and forecast 2025-2030

Chart on Italy - Market size and forecast 2025-2030 ($ million)
Data Table on Italy - Market size and forecast 2025-2030 ($ million)
Chart on Italy - Year-over-year growth 2025-2030 (%)
Data Table on Italy - Year-over-year growth 2025-2030 (%)

12.5.5 Spain - Market size and forecast 2025-2030

Chart on Spain - Market size and forecast 2025-2030 ($ million)
Data Table on Spain - Market size and forecast 2025-2030 ($ million)
Chart on Spain - Year-over-year growth 2025-2030 (%)
Data Table on Spain - Year-over-year growth 2025-2030 (%)

12.5.6 The Netherlands - Market size and forecast 2025-2030

Chart on The Netherlands - Market size and forecast 2025-2030 ($ million)
Data Table on The Netherlands - Market size and forecast 2025-2030 ($ million)
Chart on The Netherlands - Year-over-year growth 2025-2030 (%)
Data Table on The Netherlands - Year-over-year growth 2025-2030 (%)

12.6 South America - Market size and forecast 2025-2030

Chart on South America - Market size and forecast 2025-2030 ($ million)
Data Table on South America - Market size and forecast 2025-2030 ($ million)
Chart on South America - Year-over-year growth 2025-2030 (%)
Data Table on South America - Year-over-year growth 2025-2030 (%)
Chart on Regional Comparison - South America
Data Table on Regional Comparison - South America

12.6.1 Brazil - Market size and forecast 2025-2030

Chart on Brazil - Market size and forecast 2025-2030 ($ million)
Data Table on Brazil - Market size and forecast 2025-2030 ($ million)
Chart on Brazil - Year-over-year growth 2025-2030 (%)
Data Table on Brazil - Year-over-year growth 2025-2030 (%)

12.6.2 Argentina - Market size and forecast 2025-2030

Chart on Argentina - Market size and forecast 2025-2030 ($ million)
Data Table on Argentina - Market size and forecast 2025-2030 ($ million)
Chart on Argentina - Year-over-year growth 2025-2030 (%)
Data Table on Argentina - Year-over-year growth 2025-2030 (%)

12.6.3 Chile - Market size and forecast 2025-2030

Chart on Chile - Market size and forecast 2025-2030 ($ million)
Data Table on Chile - Market size and forecast 2025-2030 ($ million)
Chart on Chile - Year-over-year growth 2025-2030 (%)
Data Table on Chile - Year-over-year growth 2025-2030 (%)

12.7 Middle East and Africa - Market size and forecast 2025-2030

Chart on Middle East and Africa - Market size and forecast 2025-2030 ($ million)
Data Table on Middle East and Africa - Market size and forecast 2025-2030 ($ million)
Chart on Middle East and Africa - Year-over-year growth 2025-2030 (%)
Data Table on Middle East and Africa - Year-over-year growth 2025-2030 (%)
Chart on Regional Comparison - Middle East and Africa
Data Table on Regional Comparison - Middle East and Africa

12.7.1 UAE - Market size and forecast 2025-2030

Chart on UAE - Market size and forecast 2025-2030 ($ million)
Data Table on UAE - Market size and forecast 2025-2030 ($ million)
Chart on UAE - Year-over-year growth 2025-2030 (%)
Data Table on UAE - Year-over-year growth 2025-2030 (%)

12.7.2 Saudi Arabia - Market size and forecast 2025-2030

Chart on Saudi Arabia - Market size and forecast 2025-2030 ($ million)
Data Table on Saudi Arabia - Market size and forecast 2025-2030 ($ million)
Chart on Saudi Arabia - Year-over-year growth 2025-2030 (%)
Data Table on Saudi Arabia - Year-over-year growth 2025-2030 (%)

12.7.3 South Africa - Market size and forecast 2025-2030

Chart on South Africa - Market size and forecast 2025-2030 ($ million)
Data Table on South Africa - Market size and forecast 2025-2030 ($ million)
Chart on South Africa - Year-over-year growth 2025-2030 (%)
Data Table on South Africa - Year-over-year growth 2025-2030 (%)

12.7.4 Turkey - Market size and forecast 2025-2030

Chart on Turkey - Market size and forecast 2025-2030 ($ million)
Data Table on Turkey - Market size and forecast 2025-2030 ($ million)
Chart on Turkey - Year-over-year growth 2025-2030 (%)
Data Table on Turkey - Year-over-year growth 2025-2030 (%)

12.7.5 Egypt - Market size and forecast 2025-2030

Chart on Egypt - Market size and forecast 2025-2030 ($ million)
Data Table on Egypt - Market size and forecast 2025-2030 ($ million)
Chart on Egypt - Year-over-year growth 2025-2030 (%)
Data Table on Egypt - Year-over-year growth 2025-2030 (%)

12.8 Market opportunity by geography

Market opportunity by geography ($ million)
Data Tables on Market opportunity by geography ($ million)

13. Drivers, Challenges, and Opportunity

13.1 Market drivers

Escalating urban infrastructure and safety initiatives
Technological advancements in material science
Increasing popularity of nocturnal and all weather outdoor fitness

13.2 Market challenges

Counterfeit and brand imitation risks
Rising raw material costs and supply chain volatility
Complexity of achieving scalable sustainability

13.3 Impact of drivers and challenges

Impact of drivers and challenges in 2025 and 2030

13.4 Market opportunities

Nanotechnology driven performance enhancements
Energy harvesting and self sufficient smart textiles
Growth of inclusive and gender fluid design philosophies

14. Competitive Landscape

14.1 Overview

14.2

Overview on criticality of inputs and factors of differentiation

14.3 Landscape disruption

Overview on factors of disruption

14.4 Industry risks

Impact of key risks on business

15. Competitive Analysis

15.1 Companies profiled

Companies covered

15.2 Company ranking index

15.3 Market positioning of companies

Matrix on companies position and classification

15.4 Adidas AG

Adidas AG - Overview
Adidas AG - Business segments
Adidas AG - Key offerings
Adidas AG - Segment focus
SWOT

15.5 ASICS Corp.

ASICS Corp. - Overview
ASICS Corp. - Business segments
ASICS Corp. - Key offerings
ASICS Corp. - Segment focus
SWOT

15.6 Brooks Sports Inc.

Brooks Sports Inc. - Overview
Brooks Sports Inc. - Product / Service
Brooks Sports Inc. - Key offerings
SWOT

15.7 Craft Sportswear

Craft Sportswear - Overview
Craft Sportswear - Product / Service
Craft Sportswear - Key offerings
SWOT

15.8 Gore Wear

Gore Wear - Overview
Gore Wear - Product / Service
Gore Wear - Key offerings
SWOT

15.9 Lululemon Athletica Inc.

Lululemon Athletica Inc. - Overview
Lululemon Athletica Inc. - Business segments
Lululemon Athletica Inc. - Key offerings
Lululemon Athletica Inc. - Segment focus
SWOT

15.10 New Balance Athletics Inc.

New Balance Athletics Inc. - Overview
New Balance Athletics Inc. - Product / Service
New Balance Athletics Inc. - Key offerings
SWOT

15.11 Nike Inc.

Nike Inc. - Overview
Nike Inc. - Business segments
Nike Inc. - Key offerings
Nike Inc. - Segment focus
SWOT

15.12 On Holding AG

On Holding AG - Overview
On Holding AG - Product / Service
On Holding AG - Key offerings
SWOT

15.13 PEARL iZUMi

PEARL iZUMi - Overview
PEARL iZUMi - Product / Service
PEARL iZUMi - Key offerings
SWOT

15.14 Saucony

Saucony - Overview
Saucony - Product / Service
Saucony - Key offerings
SWOT

15.15 SAYSKY ApS

SAYSKY ApS - Overview
SAYSKY ApS - Product / Service
SAYSKY ApS - Key offerings
SWOT

15.16 Sugoi

Sugoi - Overview
Sugoi - Product / Service
Sugoi - Key offerings
SWOT

15.17 Under Armour Inc.

Under Armour Inc. - Overview
Under Armour Inc. - Business segments
Under Armour Inc. - Key offerings
Under Armour Inc. - Segment focus
SWOT

15.18 VASA Industries LLC

VASA Industries LLC - Overview
VASA Industries LLC - Product / Service
VASA Industries LLC - Key offerings
SWOT

16. Appendix

16.1 Scope of the report

Market definition
Objectives
Notes and caveats

16.2 Inclusions and exclusions checklist

Inclusions checklist
Exclusions checklist

16.3 Currency conversion rates for US$

16.4 Research methodology

16.5 Data procurement

Information sources

16.6 Data validation

16.7 Validation techniques employed for market sizing

16.8 Data synthesis

16.9 360 degree market analysis

16.10 List of abbreviations

Research Methodology

Technavio presents a detailed picture of the market by way of study, synthesis, and summation of data from multiple sources. The analysts have presented the various facets of the market with a particular focus on identifying the key industry influencers. The data thus presented is comprehensive, reliable, and the result of extensive research, both primary and secondary.

INFORMATION SOURCES

Primary sources

  • Manufacturers and suppliers
  • Channel partners
  • Industry experts
  • Strategic decision makers

Secondary sources

  • Industry journals and periodicals
  • Government data
  • Financial reports of key industry players
  • Historical data
  • Press releases

DATA ANALYSIS

Data Synthesis

  • Collation of data
  • Estimation of key figures
  • Analysis of derived insights

Data Validation

  • Triangulation with data models
  • Reference against proprietary databases
  • Corroboration with industry experts

REPORT WRITING

Qualitative

  • Market drivers
  • Market challenges
  • Market trends
  • Five forces analysis

Quantitative

  • Market size and forecast
  • Market segmentation
  • Geographical insights
  • Competitive landscape

Interested in this report?

Get your sample now to see our research methodology and insights!

Download Now

Frequently Asked Questions

Reflective Sportswear market growth will increase by USD 440.7 million during 2026-2030.

The Reflective Sportswear market is expected to grow at a CAGR of 4.9% during 2026-2030.

Reflective Sportswear market is segmented by Product (Apparels, Footwear, Others) Distribution channel (Offline, Online) Material (Cotton, Nylon, Polyester, Spandex, Others)

Adidas AG, ASICS Corp., Brooks Sports Inc., Craft Sportswear, Gore Wear, Illuminite International, Lululemon Athletica Inc., Nathan Sports Inc, New Balance Athletics Inc., Nike Inc., On Holding AG, PEARL iZUMi, Proviz Ltd., PS Reflective Materials Inc, Reflective Apparel LLC, ReflectoSafe, Ronhill Ltd, Saucony, SAYSKY ApS, Sugoi, Under Armour Inc., VASA Industries LLC are a few of the key vendors in the Reflective Sportswear market.

APAC will register the highest growth rate of 33.6% among the other regions. Therefore, the Reflective Sportswear market in APAC is expected to garner significant business opportunities for the vendors during the forecast period.

US, Canada, Mexico, China, Japan, India, South Korea, Australia, Indonesia, Germany, UK, France, Italy, Spain, The Netherlands, Brazil, Argentina, Chile, UAE, Saudi Arabia, South Africa, Turkey, Egypt

  • Escalating urban infrastructure and safety initiatives is the driving factor this market.

The Reflective Sportswear market vendors should focus on grabbing business opportunities from the Product segment as it accounted for the largest market share in the base year.
RIA - Research AI Assistant
Ask RIA
