
Renal Biomarkers Market Size 2024-2028
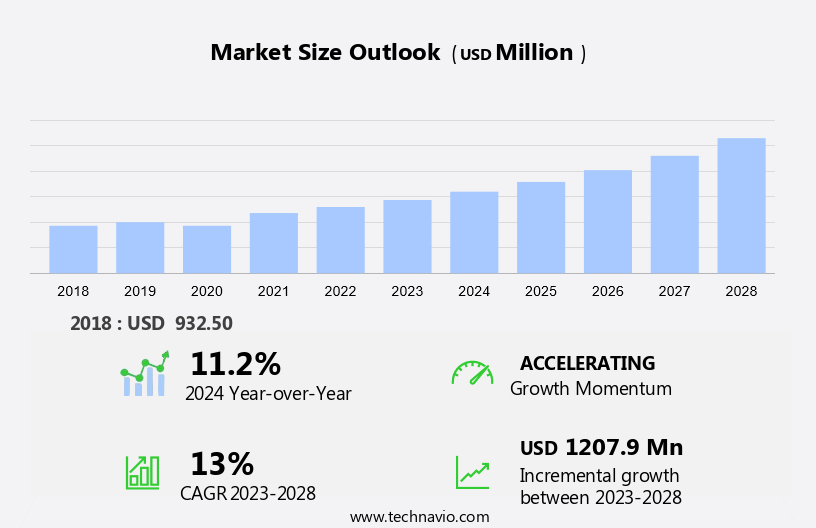
The renal biomarkers market size is forecast to increase by USD 1.21 billion at a CAGR of 13% between 2023 and 2028.
- The market is witnessing significant growth due to the rising prevalence of chronic kidney diseases and increasing awareness about kidney diseases. Chronic kidney diseases are a major health concern worldwide, and early diagnosis and treatment are crucial to prevent complications. Renal biomarkers play a vital role In the diagnosis and monitoring of kidney diseases, providing valuable insights into kidney function and damage. However, the market also faces challenges such as limitations and complications involved in renal biomarkers. Machine learning and artificial intelligence (AI) are increasingly integrated into diagnostic laboratories to enhance the accuracy and efficiency of renal biomarker testing. These include issues with sensitivity, specificity, and accuracy, as well as the need for invasive procedures and high costs. Despite these challenges, the market is expected to continue growing due to the increasing demand for early and accurate diagnosis and treatment of kidney diseases. The use of advanced technologies and innovations in renal biomarkers is also expected to drive market growth. In summary, the market is driven by the rising prevalence of chronic kidney diseases and increasing awareness about kidney diseases, but faces challenges related to limitations and complications of renal biomarkers.
What will be the Size of the Renal Biomarkers Market During the Forecast Period?
- The renal biomarker market encompasses the development, production, and application of biomarkers for the diagnosis, prognosis, and treatment of various kidney diseases. This market is driven by the growing incidence of chronic kidney disease (CKD), particularly In the geriatric population, and the need for early diagnosis and personalized medicine. Novel biomarkers, such as Neutrophil Gelatinase-Associated Lipocalin (NGAL), are gaining traction due to their ability to up-regulate proteins indicative of kidney injury.
- Moreover, diagnostic technologies, including ELISA and colorimetric assays, play a crucial role In the detection of these biomarkers in clinical practice. Hospitals and diagnostic laboratories are key end-users, as kidney function assessment is essential for patient care and management, including dialysis and kidney transplant. The market is expected to grow significantly due to the increasing demand for precise diagnostics and functional biomarkers to improve patient outcomes.
How is this Renal Biomarkers Industry segmented and which is the largest segment?
The renal biomarkers industry research report provides comprehensive data (region-wise segment analysis), with forecasts and estimates in "USD billion" for the period 2024-2028, as well as historical data from 2018-2022 for the following segments.
- End-user
- Hospitals
- Clinics and diagnostic laboratories
- Research laboratories
- Geography
- North America
- Canada
- US
- Europe
- Germany
- UK
- Asia
- Rest of World (ROW)
- North America
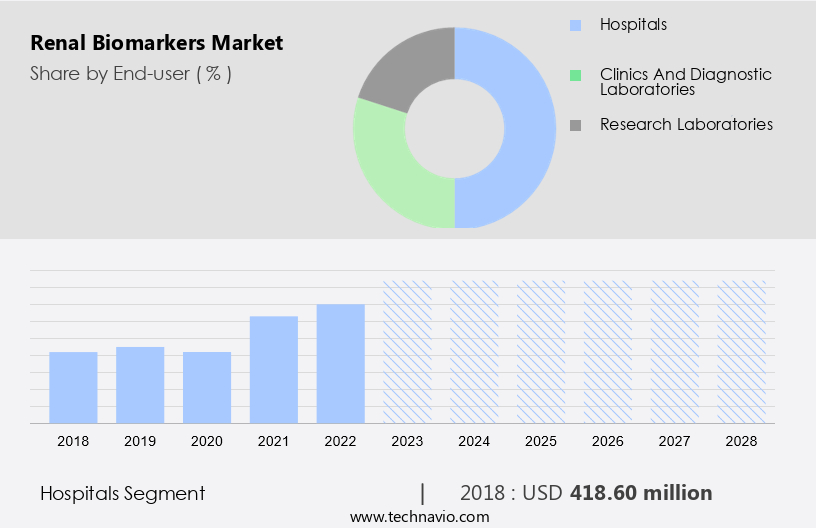
By End-user Insights
- The hospitals segment is estimated to witness significant growth during the forecast period.
The market witnessed significant growth in 2023, with hospitals being the largest revenue contributor. The availability of clinical expertise and advanced diagnostic technologies in hospitals attract patients seeking accurate kidney function assessments. The increasing prevalence of chronic kidney disease (CKD) and acute kidney injury (AKI) among the geriatric population fuels the demand for renal biomarkers in hospitals. Renal biomarkers, such as Cystatin C, NGAL, and serum creatinine, aid In the early diagnosis of kidney diseases, including diabetes and hypertension. Functional biomarkers, up-regulated proteins, and enzyme-linked immunosorbent assays (ELISA) are commonly used diagnostic techniques in hospitals.
Get a glance at the Renal Biomarkers Industry report of share of various segments Request Free Sample
The hospitals segment was valued at USD 418.60 million in 2018 and showed a gradual increase during the forecast period.
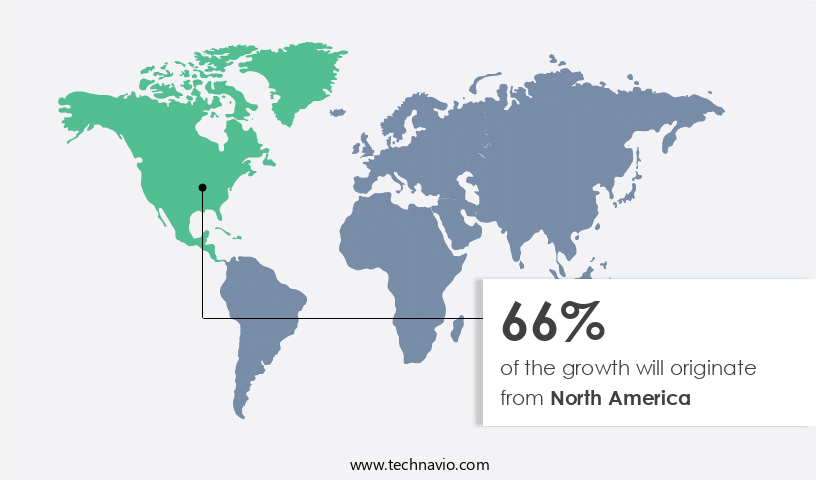
Regional Analysis
- North America is estimated to contribute 66% to the growth of the global market during the forecast period.
Technavio's analysts have elaborately explained the regional trends and drivers that shape the market during the forecast period.
For more insights on the market share of various regions, Request Free Sample
The US and Canadian markets hold significant shares In the market due to the high prevalence of kidney diseases such as chronic kidney disease (CKD), diabetes, and hypertension. Renal biomarker testing is a crucial diagnostic tool for kidney function assessment and injury detection. With advancements in biotechnology, healthcare institutions and clinical laboratories have access to novel biomarkers and diagnostic technologies, enabling early diagnosis and personalized treatment. Functional biomarkers like Cystatin C, NGAL, and serum creatinine are commonly used for kidney function evaluation and disease progression monitoring. AI and machine learning technologies are increasingly integrated into diagnostic assays and clinical research for improved patient outcomes.
Market Dynamics
Our researchers analyzed the data with 2023 as the base year, along with the key drivers, trends, and challenges. A holistic analysis of drivers will help companies refine their marketing strategies to gain a competitive advantage.
What are the key market drivers leading to the rise In the adoption of Renal Biomarkers Industry?
Rising prevalence of chronic kidney diseases is the key driver of the market.
- The renal biomarker market holds significance due to the increasing prevalence of kidney diseases worldwide. Chronic kidney diseases, such as polycystic kidney disease, diabetes, and hypertension, affect approximately 10% of the global population, resulting in millions of deaths annually due to lack of affordable treatment. In the US, 37 million adults are estimated to have chronic kidney disease. Novel biomarkers and diagnostic technologies are crucial for early diagnosis, treatment, and prognosis of kidney diseases. Biomarker technologies, including functional biomarkers like Cystatin C and NGAL, are up-regulated in response to kidney injury. Clinical practice relies on diagnostic techniques like enzyme-linked immunosorbent assay (ELISA) and colorimetric assays in diagnostic laboratories, hospitals, outpatient clinics, and research centers.
- Biotechnology and healthcare industries are investing in translational research to develop diagnostic assays and therapeutic interventions. High-throughput screening and omics technologies, such as multiplexed assays, are essential for identifying disease mechanisms and therapeutic targets. Artificial Intelligence and machine learning are being integrated into diagnostic techniques to improve patient outcomes and personalized medicine. Digital biomarkers are also gaining importance in healthcare, especially for the geriatric population. The research ecosystem requires clinical expertise and disease understanding to advance our knowledge of kidney function and kidney injury.
What are the market trends shaping the Renal Biomarkers Industry?
Increasing awareness about kidney diseases is the upcoming market trend.
- The renal biomarker market is experiencing significant growth due to the increasing focus on early diagnosis and personalized treatment of kidney diseases. Biotechnology companies and clinical laboratories are investing in novel biomarker technologies to improve diagnostic techniques and therapeutic interventions. Clinical practice is increasingly relying on functional biomarkers such as serum creatinine, NGAL, and Cystatin C for the detection and prognosis of chronic kidney disease (CKD), acute kidney injury (AKI), and renal transplant rejection. High-throughput screening and omics technologies, including multiplexed assays, are being utilized for research ecosystems to identify up-regulated proteins as potential therapeutic targets. Clinical expertise and disease mechanisms are being leveraged to develop diagnostic assays and therapeutic interventions.
- Digital biomarkers and artificial intelligence (AI) are also being explored for patient outcomes and healthcare management. The geriatric population, which is disproportionately affected by diabetes and hypertension, is a significant market driver. Diagnostic laboratories, hospitals, outpatient clinics, research centers, and home testing are key channels for the distribution of renal biomarker tests. The incidence of kidney disease, including CKD and dialysis, is increasing globally, creating a large and growing market opportunity.
What challenges does the Renal Biomarkers Industry face during its growth?
Limitations of and complications involved in renal biomarkers is a key challenge affecting the industry growth.
- The renal biomarker market holds significant importance In the healthcare industry due to its role in early diagnosis, treatment, and prognosis of kidney diseases. Biomarker technologies have emerged as essential tools in clinical practice, enabling precise diagnostic techniques and personalized medicine. Novel biomarkers, such as functional biomarkers, are up-regulated proteins that provide valuable insights into kidney function and injury. Serum creatinine, NGAL, and Cystatin C are commonly used renal biomarkers for diagnosing chronic kidney disease (CKD), acute kidney injury (AKI), and renal transplant rejection. Diagnostic technologies, including enzyme-linked immunosorbent assay (ELISA) and colorimetric assay, are widely used in diagnostic laboratories, hospitals, outpatient clinics, and research centers for routine screening and specialty consultations.
- Biomarker insights have been instrumental in advancing our understanding of disease mechanisms and therapeutic targets. High-throughput screening and omics technologies, such as proteomics and genomics, have facilitated the discovery of new biomarkers and diagnostic assays. Machine learning and artificial intelligence are being employed to improve diagnostic accuracy and precision. The renal biomarker market is driven by the increasing incidence of diabetes and hypertension, the growing geriatric population, and the need for minimally invasive diagnostic techniques. However, challenges such as vascular access dysfunction, immune system activation, and fluid balance errors must be addressed to ensure optimal patient outcomes. The research ecosystem, including biotechnology companies, healthcare providers, and academic institutions, is collaborating to develop novel biomarkers and therapeutic interventions.
Exclusive Customer Landscape
The renal biomarkers market forecasting report includes the adoption lifecycle of the market, covering from the innovator's stage to the laggard's stage. It focuses on adoption rates in different regions based on penetration. Furthermore, the renal biomarkers market report also includes key purchase criteria and drivers of price sensitivity to help companies evaluate and develop their market growth analysis strategies.
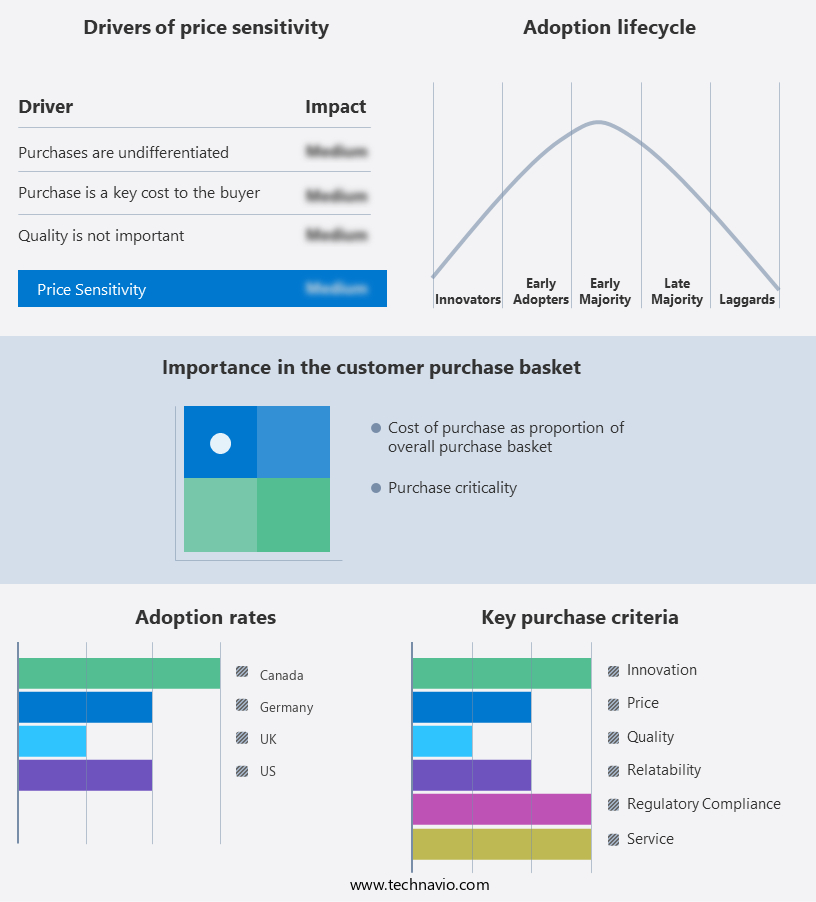
Customer Landscape
Key Companies & Market Insights
Companies are implementing various strategies, such as strategic alliances, renal biomarkers market forecast, partnerships, mergers and acquisitions, geographical expansion, and product/service launches, to enhance their presence in the industry.
The industry research and growth report includes detailed analyses of the competitive landscape of the market and information about key companies, including:
- Abbott Laboratories
- BioMerieux SA
- BioPorto AS
- COBO SCIENTIFIC ApS
- EKF Diagnostics Holdings Plc
- F. Hoffmann La Roche Ltd.
- IQVIA Holdings Inc.
- Randox Laboratories Ltd.
- RenalSense Ltd.
- Siemens AG
- SphingoTec GmbH
- Thermo Fisher Scientific Inc.
Qualitative and quantitative analysis of companies has been conducted to help clients understand the wider business environment as well as the strengths and weaknesses of key industry players. Data is qualitatively analyzed to categorize companies as pure play, category-focused, industry-focused, and diversified; it is quantitatively analyzed to categorize companies as dominant, leading, strong, tentative, and weak.
Research Analyst Overview
The renal biomarker market encompasses a broad range of biomarkers used for the diagnosis and monitoring of kidney diseases. These biomarkers play a crucial role In the early identification of kidney injuries and chronic kidney disease (CKD), enabling timely intervention and improved patient outcomes. The use of renal biomarkers in clinical practice has gained significant attention due to their potential in personalized medicine and precision diagnostics. Biomarker technologies have revolutionized the diagnostic landscape, providing functional biomarkers that up-regulate proteins and enzymes indicative of kidney injury or dysfunction. Technologies such as enzyme-linked immunosorbent assay (ELISA) and colorimetric assays are commonly used in diagnostic laboratories for the detection and quantification of these biomarkers.
In addition, the clinical research community has been actively exploring the potential of novel biomarkers for the diagnosis and prognosis of various kidney diseases. These biomarkers include cystatin C, N-acetyl-?-D-glucosaminidase (NAG), and neutrophil gelatinase-associated lipocalin (NGAL), among others. These biomarkers have shown promise In the early detection of acute kidney injury (AKI) and CKD, particularly in patient populations with diabetes and hypertension. The diagnostic techniques used for the detection of renal biomarkers have evolved significantly in recent years. High-throughput screening and omics technologies, such as proteomics and metabolomics, have enabled the identification of multiple biomarkers simultaneously, increasing the efficiency and accuracy of diagnostic assays.
Moreover, multiplexed assays have also gained popularity due to their ability to measure multiple biomarkers in a single test, reducing the need for multiple tests and improving patient convenience. The research ecosystem surrounding renal biomarkers is diverse and collaborative, involving clinical expertise, translational research, and biopharma companies. This collaborative approach has led to the development of therapeutic interventions targeting specific disease mechanisms and biomarkers, offering new opportunities for the treatment of kidney diseases. Routine screening for renal biomarkers is becoming increasingly common in hospitals and outpatient clinics, as well as in research centers and diagnostic laboratories. The use of digital biomarkers and health records has further facilitated the integration of renal biomarker testing into clinical practice, enabling more accurate and timely diagnosis and monitoring of kidney diseases.
Furthermore, the geriatric population represents a significant portion of the renal biomarker market, given the high incidence of kidney diseases in this demographic. Dialysis and kidney transplantation are common therapeutic interventions for advanced kidney diseases, and the use of renal biomarkers can help optimize these treatments by improving patient selection and monitoring. The use of functional biomarkers and advanced diagnostic techniques has revolutionized the diagnostic landscape, enabling personalized medicine and precision diagnostics. The collaborative efforts of the clinical research community, biopharma companies, and diagnostic laboratories are paving the way for new therapeutic interventions and improved patient outcomes.
|
Market Scope |
|
|
Report Coverage |
Details |
|
Page number |
164 |
|
Base year |
2023 |
|
Historic period |
2018-2022 |
|
Forecast period |
2024-2028 |
|
Growth momentum & CAGR |
Accelerate at a CAGR of 13% |
|
Market growth 2024-2028 |
USD 1.21 billion |
|
Market structure |
Concentrated |
|
YoY growth 2023-2024(%) |
11.2 |
|
Key countries |
US, Canada, Germany, and UK |
|
Competitive landscape |
Leading Companies, market growth and forecasting, Market Positioning of Companies, Competitive Strategies, and Industry Risks |
What are the Key Data Covered in this Renal Biomarkers Market Research and Growth Report?
- CAGR of the Renal Biomarkers industry during the forecast period
- Detailed information on factors that will drive the growth and forecasting between 2024 and 2028
- Precise estimation of the size of the market and its contribution of the industry in focus to the parent market
- Accurate predictions about upcoming growth and trends and changes in consumer behaviour
- Growth of the market across North America, Europe, Asia, and Rest of World (ROW)
- Thorough analysis of the market's competitive landscape and detailed information about companies
- Comprehensive analysis of factors that will challenge the renal biomarkers market growth of industry companies
We can help! Our analysts can customize this renal biomarkers market research report to meet your requirements.
 RIA -
RIA - 
