
Renewable Energy Inverters Market Size 2024-2028
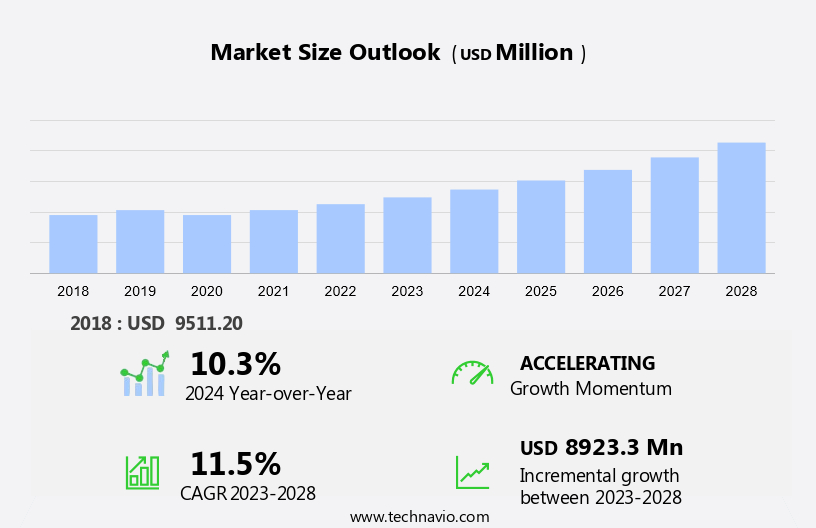
The renewable energy inverters market size is forecast to increase by USD 8.92 billion at a CAGR of 11.5% between 2023 and 2028.
- The market is experiencing significant growth due to the declining cost of solar and wind power generation. This trend is driving advancements in power electronics used in solar photovoltaic (PV) systems. Inverter manufacturers are focusing on improving the efficiency and reliability of inverters to ensure optimal energy conversion from renewable sources. However, safety compliances remain a critical challenge in the market, particularly in the electric vehicle (EV) charging infrastructure sector. Inverter failures in solar PV systems can lead to significant losses and even pose safety hazards, such as arc flash risks. Additionally, the increasing adoption of batteries in renewable energy systems and vehicle inverters is adding complexity to the market. The electric vehicle market is expected to be a significant growth area for inverter manufacturers, as the demand for charging infrastructure continues to rise. To stay competitive, companies must prioritize safety compliances, reliability, and efficiency in their inverter designs.
What will the size of the market be during the forecast period?
- The market is witnessing significant growth due to the increasing adoption of renewable energy sources and the need for energy efficiency and sustainability. Renewable energy systems, such as solar and wind, require inverters to convert direct current (DC) electricity generated from renewable sources into alternating current (AC) electricity that can be used by homes and businesses. Solar energy, in particular, is driving the demand for renewable energy inverters. The benefits of solar energy, including energy independence, cost savings, and environmental sustainability, have led to its widespread adoption. According to the U.S. Energy Information Administration, solar is the fastest-growing source of renewable electricity in the United States. Energy efficiency is another key factor driving the market. Inverters play a crucial role in optimizing the performance of renewable energy systems by converting DC electricity into AC electricity at the optimal voltage and frequency. This helps reduce energy losses and improve overall system efficiency. The clean energy transition is a major trend in the energy sector, and renewable energy inverters are an essential component of this transition.
How is this market segmented and which is the largest segment?
The market research report provides comprehensive data (region-wise segment analysis), with forecasts and estimates in "USD million" for the period 2024-2028, as well as historical data from 2018-2022 for the following segments.
- Application
- Solar PV
- EV
- Wind
- Geography
- APAC
- China
- India
- Japan
- Europe
- North America
- Canada
- US
- South America
- Middle East and Africa
- APAC
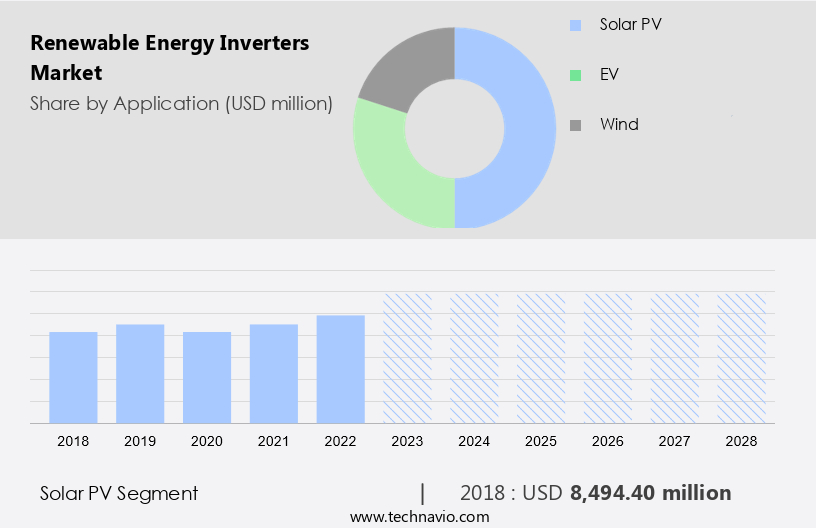
By Application Insights
- The solar PV segment is estimated to witness significant growth during the forecast period.
Inverters play a crucial role in solar photovolvoltaic (PV) systems by converting the direct current (DC) produced by the solar PV modules into alternating current (AC). The expansion of the solar PV market is driven by the decrease in the cost of solar energy generation, which is attributed to the falling prices of solar PV modules and other related components. This trend is anticipated to persist throughout the forecast period due to the heightened focus on reducing greenhouse gas (GHG) emissions and addressing environmental concerns. Inverter manufacturers are capitalizing on this growth by producing advanced electronic systems to ensure safety compliances and compatibility with energy storage and charging infrastructure.
Additionally, the increasing popularity of electric vehicles (EVs) is fueling demand for vehicle inverters and batteries. The renewable energy sector, including solar and EV markets, is expected to witness significant growth in the US market. Inverters are essential for the efficient conversion and safe utilization of renewable energy.
Get a glance at the market report of share of various segments Request Free Sample
The solar PV segment was valued at USD 8.49 billion in 2018 and showed a gradual increase during the forecast period.
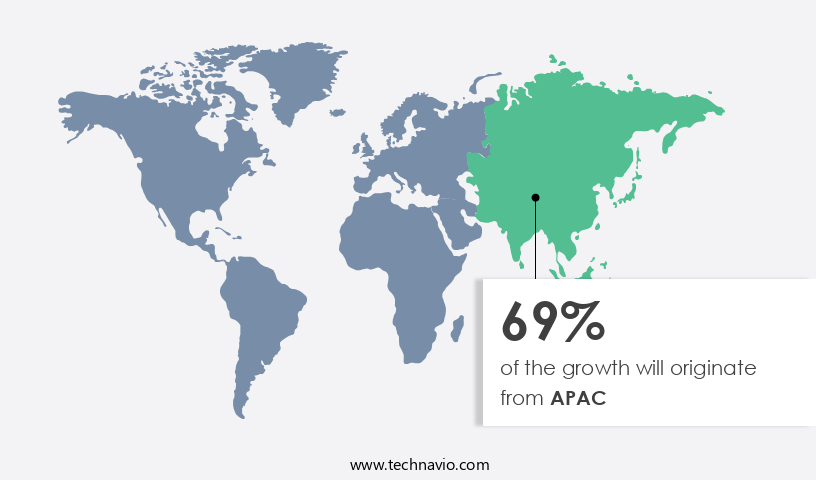
Regional Analysis
- APAC is estimated to contribute 69% to the growth of the global market during the forecast period.
Technavio's analysts have elaborately explained the regional trends and drivers that shape the market during the forecast period.
For more insights on the market share of various regions Request Free Sample
The market experienced significant growth in APAC in 2023, driven by the increasing adoption of solar photovoltaic (PV) systems and the expanding electric vehicle (EV) market in the region. China, India, Japan, and Australia were the major contributors to the market's expansion in APAC. The implementation of financial incentive programs, such as feed-in tariffs (FITs) in China and Japan, fueled the demand for solar PV systems and, consequently, renewable energy inverters. Moreover, the high levels of greenhouse gas (GHG) emissions in China and India have led to a shift towards renewable energy sources for power generation and clean transportation alternatives, such as EVs. Environmental regulations continue to drive the transition away from fossil fuels and nuclear power towards clean energy sources. DC cables are essential components in renewable energy systems, connecting solar PV systems to inverters and grids. The market for renewable energy inverters is expected to continue its growth trajectory, offering substantial investment opportunities.
Market Dynamics
Our researchers analyzed the data with 2023 as the base year, along with the key drivers, trends, and challenges. A holistic analysis of drivers will help companies refine their marketing strategies to gain a competitive advantage.
What are the key market drivers leading to the rise in adoption of Renewable Energy Inverters Market?
Declining cost of solar and wind power generation is the key driver of the market.
- Over the last decade, renewable power sources, specifically solar and wind, have gained significant traction in the energy sector. The cost-effectiveness of these sources is a major factor, driven by increased production scales and intense competition among companies in the global renewable energy market. Energy storage systems (ESS), which address the intermittency issue of solar photovoltaic (PV) systems and wind turbines during non-productive hours, have further accelerated the adoption of renewable energy.
- The US Department of Energy's Solar Energy Technologies Office (SETO) has launched various initiatives to support this transition, recognizing the importance of clean energy investment and engineering advancements in solar installations and distributed solar resources. Additionally, the automobile industry is exploring the use of power inverters in electric vehicles, further expanding the market for renewable energy technologies. Grid stability remains a crucial consideration, as renewable energy sources continue to grow in importance.
What are the market trends shaping the Renewable Energy Inverters Market?
Advances in power electronics used in solar PV systems is the upcoming trend in the market.
- Power, utilizing semiconductor switching devices. This technology has significantly transformed the energy sector by enhancing product efficiency and optimizing the manufacturing process for components like solar PV inverters and battery chargers or dischargers. Solar PV inverters are essential for converting DC power generated from solar panels into AC power for residential and commercial use. Moreover, power electronics have enabled advanced technologies for grid modernization and solar grid integration in utility-scale renewable energy projects, such as solar power plants. Maintaining and repairing renewable energy inverters is essential to ensure the longevity and optimal performance of sustainable power generation systems. Thus, such trends will shape the growth of the market during the forecast period.
What challenges does Renewable Energy Inverters Market face during the growth?
Inverter associated solar PV system failures is a key challenge affecting the market growth.
- Solar energy systems, including decentralized and rooftop installations, rely on inverters to convert direct current (DC) electricity generated from solar panels into alternating current (AC) for use in the grid infrastructure. Inverters are essential components of these systems, and their failure can significantly impact the output power rating and efficiency of the solar energy setup. Common causes of inverter failure include capacitor degradation, overuse, voltage and current overloads, ultrasonic vibrations, and incorrect installation. Maintaining and replacing inverters in solar energy systems can be costly, despite their relatively low initial cost. The importance of this component in solar PV systems makes it a critical focus for system owners and maintenance teams.
- Factors such as solar subsidies, tax credits, and the shift away from fossil fuels are driving the growth of the renewable energy market in the US and North America. As the demand for solar energy continues to increase, the need for reliable and efficient inverters will remain a priority. In summary, inverter failure is a common issue in solar PV systems that can negatively impact the power output and overall performance of the system.
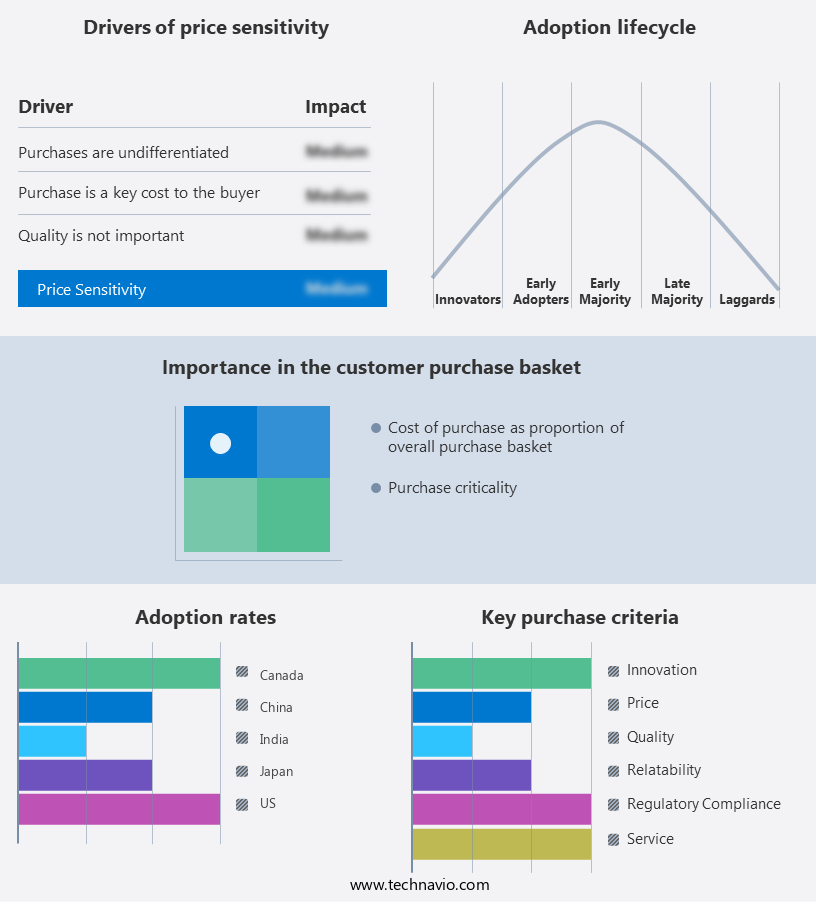
Exclusive Customer Landscape
The market forecasting report includes the adoption lifecycle of the market, covering from the innovator's stage to the laggard's stage. It focuses on adoption rates in different regions based on penetration. Furthermore, the market report also includes key purchase criteria and drivers of price sensitivity to help companies evaluate and develop their market growth analysis strategies.
Customer Landscape
Key Companies & Market Insights
Companies are implementing various strategies, such as strategic alliances, market forecast , partnerships, mergers and acquisitions, geographical expansion, and product/service launches, to enhance their presence in the market. The market research and growth report includes detailed analyses of the competitive landscape of the market and information about key companies, including:
- Eaton Corp plc
- Elpower Srl
- Enphase Energy Inc.
- Fimer SpA
- Fronius International GmbH
- General Electric Co.
- GoodWe Technologies Co. Ltd.
- Huawei Technologies Co. Ltd.
- Ingeteam Corp. S.A.
- KEB America Inc.
- Layer Electronics Srl
- Panasonic Holdings Corp.
- Power Electronics Espana SLU
- Schneider Electric SE
- Siemens AG
- Sineng Electric Co. Ltd.
- SMA Solar Technology AG
- SolarEdge Technologies Inc.
- Sungrow Power Supply Co. Ltd.
- TBEA Co. Ltd.
Qualitative and quantitative analysis of companies has been conducted to help clients understand the wider business environment as well as the strengths and weaknesses of key market players. Data is qualitatively analyzed to categorize companies as pure play, category-focused, industry-focused, and diversified; it is quantitatively analyzed to categorize companies as dominant, leading, strong, tentative, and weak.
Research Analyst Overview
Renewable energy inverters play a crucial role in sustainable power generation by converting direct current (DC) electricity from renewable energy sources like solar panels into alternating current (AC) electricity for use in homes and industries. Inverter technology has been instrumental in the electrification of various sectors, including residential applications, industrial motors, and electric vehicles. The market is driven by the growing demand for clean energy and the need to reduce harmful gas emissions. The increasing focus on efficiency improvements and safety compliances has led to the development of advanced inverter systems that offer better performance, reliability, and longevity. Inverter manufacturers are investing in research and development to meet the evolving needs of the energy sector and cater to the growing demand for decentralized energy systems. The market for renewable energy inverters is expected to grow significantly due to the increasing adoption of renewable energy sources, grid modernization, and the expanding electric vehicle market.
Furthermore, the market is experiencing strong growth driven by the increasing adoption of solar power for homes and solar power for businesses. Solar panel inverters, including grid-tied inverters and off-grid solar systems, are essential for converting DC to AC power, ensuring efficient solar energy installation and solar power generation. The rise of hybrid energy systems and microgrid solutions is enhancing energy security and supporting energy conservation. Governments worldwide are backing renewable energy policy initiatives, spurring investment in solar panel maintenance, energy storage solutions, and smart grid technology. As solar panel efficiency improves, solar panel installation costs are decreasing, making solar energy benefits more accessible. Energy innovation, including battery management systems and inverter prices, is driving renewable energy adoption, reducing carbon emissions, and supporting the green energy transition. Solar incentives and energy management systems are accelerating the growth of the solar energy industry.
|
Market Scope |
|
|
Report Coverage |
Details |
|
Page number |
176 |
|
Base year |
2023 |
|
Historic period |
2018-2022 |
|
Forecast period |
2024-2028 |
|
Growth momentum & CAGR |
Accelerate at a CAGR of 11.5% |
|
Market growth 2024-2028 |
USD 8.92 billion |
|
Market structure |
Fragmented |
|
YoY growth 2023-2024(%) |
10.3 |
|
Key countries |
China, US, Japan, India, and Canada |
|
Competitive landscape |
Leading Companies, Market Positioning of Companies, Competitive Strategies, and Industry Risks |
What are the Key Data Covered in this Market Research and Growth Report?
- CAGR of the market during the forecast period
- Detailed information on factors that will drive the market growth and forecasting between 2024 and 2028
- Precise estimation of the size of the market and its contribution of the market in focus to the parent market
- Accurate predictions about upcoming market growth and trends and changes in consumer behaviour
- Growth of the market across APAC, Europe, North America, South America, and Middle East and Africa
- Thorough analysis of the market's competitive landscape and detailed information about companies
- Comprehensive analysis of factors that will challenge the growth of market companies
We can help! Our analysts can customize this market research report to meet your requirements. Get in touch
 RIA -
RIA - 
