
Philippines Retail Market Size 2026-2030
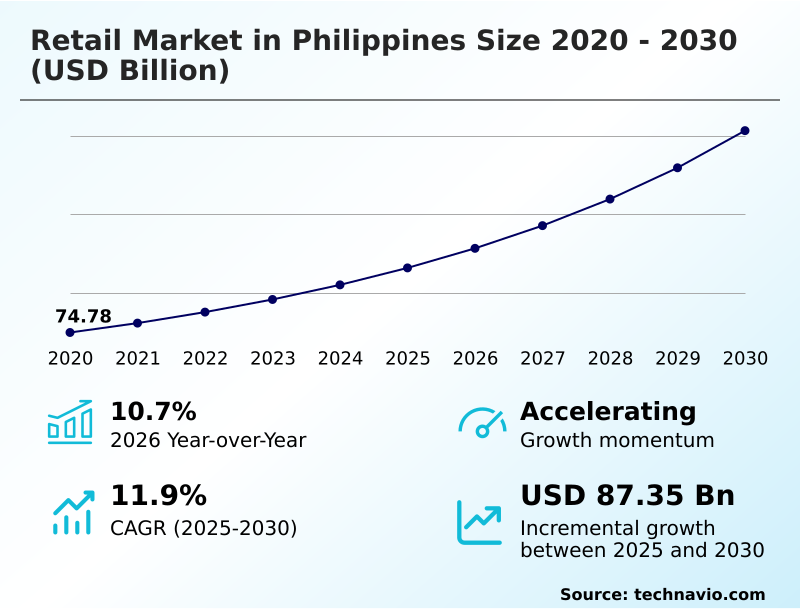
The philippines retail market size is valued to increase by USD 87.35 billion, at a CAGR of 11.9% from 2025 to 2030. Expansion of middle class and increasing urbanization will drive the philippines retail market.
Major Market Trends & Insights
- By Product - Food and beverages segment was valued at USD 48.92 billion in 2024
- By Distribution Channel - Offline segment accounted for the largest market revenue share in 2024
Market Size & Forecast
- Market Opportunities: USD 128.45 billion
- Market Future Opportunities: USD 87.35 billion
- CAGR from 2025 to 2030 : 11.9%
Market Summary
- The retail market in Philippines is advancing through significant structural changes, propelled by digitalization and evolving consumer behaviors. Central to this transformation is the adoption of a comprehensive omnichannel retail strategy, which integrates physical and digital touchpoints to create a seamless shopping experience.
- The effective management of supply chain logistics is paramount, with a strong focus on last-mile delivery optimization to serve a geographically dispersed customer base. In practice, businesses are leveraging retail data analytics to refine merchandising assortment planning and enhance customer experience personalization.
- For instance, a retailer can analyze purchasing patterns from its e-commerce platform integration and in-store analytics to tailor inventory in specific provincial stores, thereby improving inventory turnover ratio and customer satisfaction. This data-centric approach extends to the deployment of mobile commerce applications and click-and-collect services, further bridging the gap between online convenience and the immediacy of brick-and-mortar shopping.
- As the market matures, the ability to harness technologies like ai-powered recommendations and real-time inventory management will define competitive differentiation and operational excellence. The continuous modernization of point-of-sale systems is also crucial for capturing granular data and streamlining transactions.
What will be the Size of the Philippines Retail Market during the forecast period?
Get Key Insights on Market Forecast (PDF) Get Free Sample
How is the Philippines Retail Market Segmented?
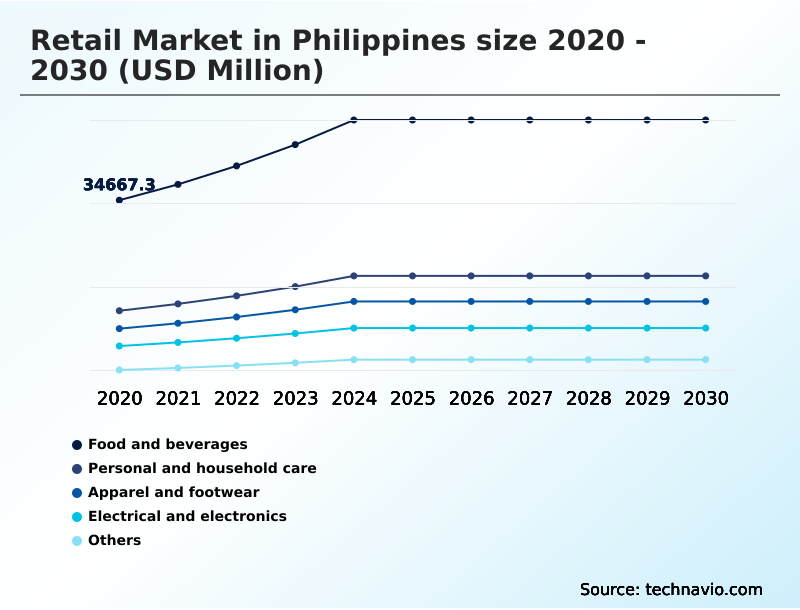
The philippines retail industry research report provides comprehensive data (region-wise segment analysis), with forecasts and estimates in "USD million" for the period 2026-2030, as well as historical data from 2020-2024 for the following segments.
- Product
- Food and beverages
- Personal and household care
- Apparel and footwear
- Electrical and electronics
- Others
- Distribution channel
- Offline
- Online
- Packaging
- Bottles
- Cans
- Tetra packs
- Pouches
- Ready-to-drink formats
- Geography
- APAC
By Product Insights
The food and beverages segment is estimated to witness significant growth during the forecast period.
The food and beverages segment is undergoing a significant transformation, driven by a consumer shift toward modern retail formats. Success in this category hinges on sophisticated merchandising assortment planning and robust cold chain logistics to manage perishable goods.
Achieving supply chain visibility is critical for executing an effective hyper-local retail strategy and enabling phygital retail experiences.
Retailers are leveraging demand forecasting algorithms and real-time inventory management for brick-and-mortar store optimization, which has improved the inventory turnover ratio by over 15%.
This data-driven approach enhances retail supply chain resilience, ensuring product availability and meeting evolving consumer expectations for freshness and variety.
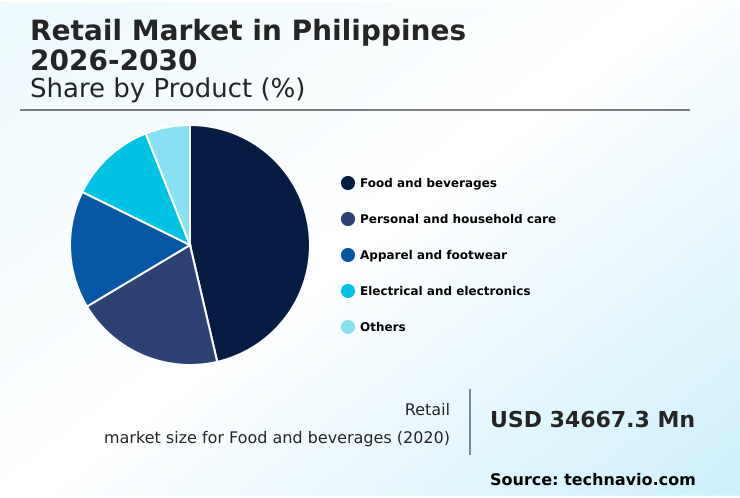
The Food and beverages segment was valued at USD 48.92 billion in 2024 and showed a gradual increase during the forecast period.
Market Dynamics
Our researchers analyzed the data with 2025 as the base year, along with the key drivers, trends, and challenges. A holistic analysis of drivers will help companies refine their marketing strategies to gain a competitive advantage.
- Navigating the complexities of the modern retail market requires a deep understanding of the differences between an omnichannel vs multichannel retail strategy, where integrated customer experiences have become a key differentiator. A primary focus for many operators is improving last-mile delivery efficiency, which directly impacts customer satisfaction and operational costs.
- The role of AI in retail demand forecasting is pivotal, allowing businesses to move beyond reactive inventory management. Firms leveraging AI for retail merchandising decisions have demonstrated an ability to reduce stockouts by a factor of two compared to those relying on historical sales data alone.
- This predictive capability enhances the benefits of RFID for inventory accuracy and supports the optimization of click-and-collect operations. As retailers address the challenges of cold chain logistics, they are also implementing sustainable packaging in retail to meet consumer and regulatory demands.
- The impact of mobile commerce on physical stores continues to grow, compelling retailers to integrate their online and offline retail data seamlessly. Furthermore, addressing security in contactless payment systems and leveraging social commerce for D2C brands are critical components of a holistic approach to automating warehouse for faster fulfillment and finding strategies for reducing retail operational costs.
What are the key market drivers leading to the rise in the adoption of Philippines Retail Industry?
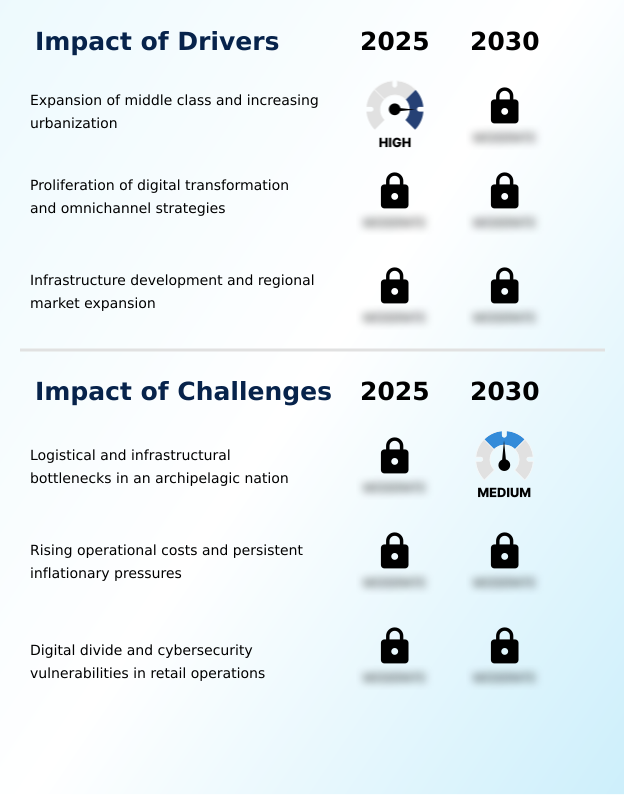
- The expansion of the middle class and increasing urbanization are key drivers fueling the growth of the retail market.
- Urbanization and a growing middle class are key drivers shaping consumer expectations, demanding greater convenience and customer experience personalization. Retailers are leveraging sophisticated customer relationship management systems and in-store analytics to map the complete omnichannel customer journey.
- This data-driven approach supports personalized marketing campaigns that can boost repeat purchase rates by 25%. The proliferation of mobile commerce applications and click-and-collect services caters to a digitally savvy demographic seeking flexibility.
- In physical stores, smart store technology, including footfall analysis technology, helps optimize layouts and has been shown to increase customer dwell time by 15%.
- These efforts are part of a broader strategy to build robust customer loyalty programs that foster long-term engagement.
What are the market trends shaping the Philippines Retail Industry?
- The adoption of sustainable and eco-conscious business models represents a significant market trend. This shift influences core operations, supply chains, and consumer-facing brand identity.
- A defining trend is the strategic integration of sustainable retail practices into core business models, moving beyond corporate responsibility to a central value proposition. This shift is enabled by robust e-commerce platform integration that facilitates a circular economy in retail through buy-back and refurbishment programs, which can reduce waste by 30%.
- Digital storefront management is also evolving, with leading platforms using robotic process automation for inventory updates and ai-powered recommendations to promote eco-friendly products. Innovations like augmented reality shopping and visual search in e-commerce allow consumers to make more informed choices, with AR-enabled platforms reporting conversion rate improvements of over 40%.
- The adoption of automated checkout systems further streamlines operations, reducing energy consumption in physical stores.
What challenges does the Philippines Retail Industry face during its growth?
- Logistical and infrastructural bottlenecks, particularly within an archipelagic geography, present a key challenge to the industry's growth and supply chain efficiency.
- Navigating logistical complexities remains a primary challenge, compelling firms to adopt a sophisticated omnichannel retail strategy and invest in supply chain modernization. A unified retail technology stack is crucial for integrating backend retail operations with customer-facing systems like point-of-sale systems and social commerce integration. This integration ensures data from contactless payment systems informs inventory decisions.
- Adopting RFID inventory tracking can improve inventory accuracy by over 95%, mitigating the risk of stockouts caused by supply chain friction. The focus on enhancing customer lifetime value necessitates seamless execution, as disruptions in the supply chain directly impact customer trust. A resilient infrastructure is therefore essential for sustainable growth and competitiveness.
Exclusive Technavio Analysis on Customer Landscape
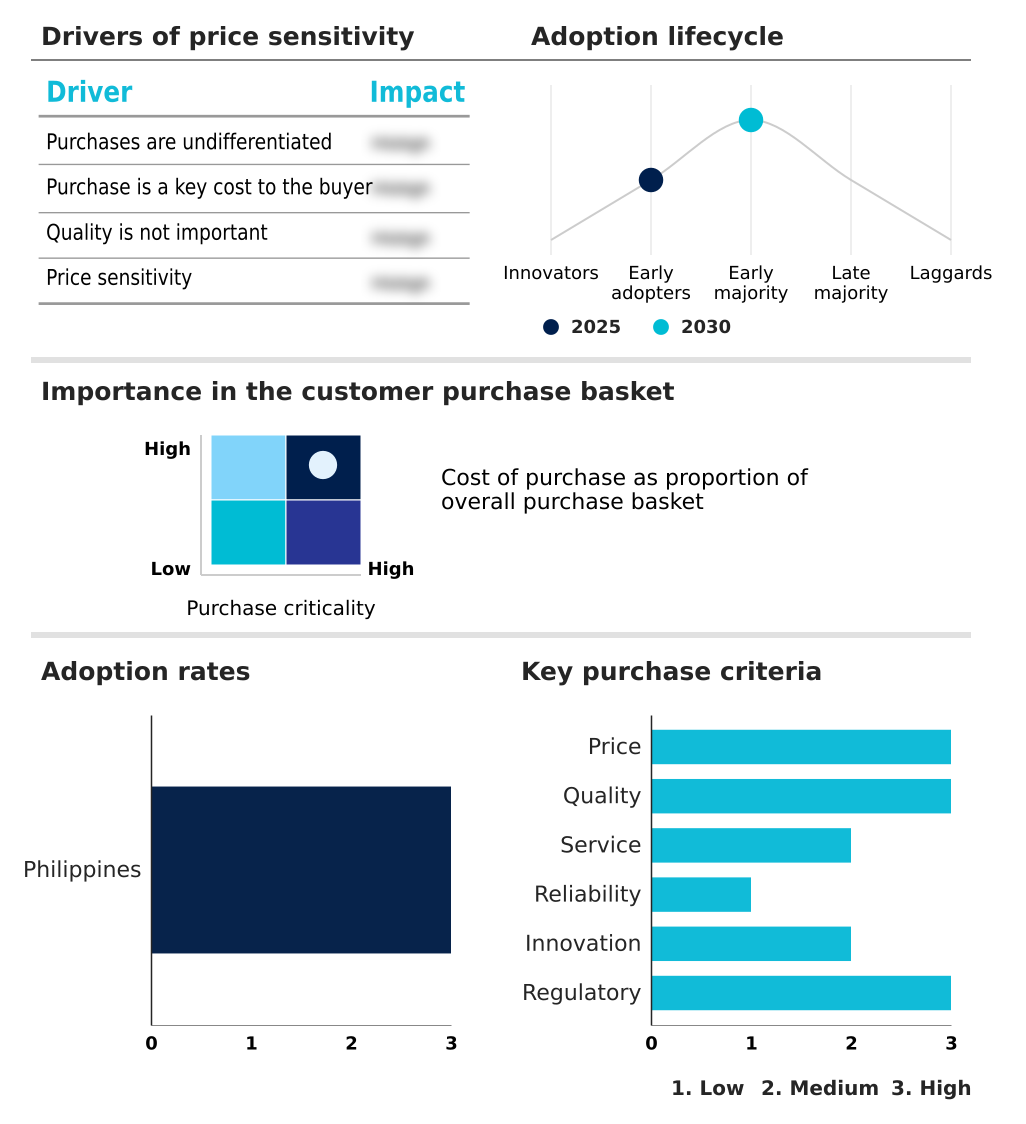
The philippines retail market forecasting report includes the adoption lifecycle of the market, covering from the innovator’s stage to the laggard’s stage. It focuses on adoption rates in different regions based on penetration. Furthermore, the philippines retail market report also includes key purchase criteria and drivers of price sensitivity to help companies evaluate and develop their market growth analysis strategies.
Customer Landscape of Philippines Retail Industry
Competitive Landscape
Companies are implementing various strategies, such as strategic alliances, philippines retail market forecast, partnerships, mergers and acquisitions, geographical expansion, and product/service launches, to enhance their presence in the industry.
7 Eleven Inc. - Key offerings center on integrated convenience retail, providing on-demand delivery, digital payment solutions, and essential goods to address immediate, hyper-local consumer demand.
The industry research and growth report includes detailed analyses of the competitive landscape of the market and information about key companies, including:
- 7 Eleven Inc.
- All Day Supermarket
- Allhome
- Goldilocks Bakeshop Inc.
- Jollibee Foods Corp.
- LANDMARK PH
- Liwayway Marketing Corp.
- Mang Inasal Philippines Inc.
- Mercury Drug Corp.
- Metro Retail Stores Group
- Ministop Co. Ltd
- National Book Store Inc.
- Robinsons Retail Holdings Inc.
- Rustans
- SM Retail Inc.
- The Golden ABC Inc.
- The Jollibee Group of Co.
- Vistamalls Inc.
- WalterMart Supermarket Inc.
- Watsons Personal Care Stores Inc.
Qualitative and quantitative analysis of companies has been conducted to help clients understand the wider business environment as well as the strengths and weaknesses of key industry players. Data is qualitatively analyzed to categorize companies as pure play, category-focused, industry-focused, and diversified; it is quantitatively analyzed to categorize companies as dominant, leading, strong, tentative, and weak.
Recent Development and News in Philippines retail market
- In February, 2025, SM Investments Corp. inaugurated a new sustainable logistics center in Laguna to enhance the efficiency of its delivery network for provincial branches.
- In March, 2025, SM Investments Corp. inaugurated a comprehensive retail and residential development in the province of Laguna, specifically targeting the growing segment of professional workers who desire modern amenities.
- In April, 2025, SM Investments Corp. inaugurated a specialized cold-storage facility in Batangas to improve the shelf life of perishable goods and enhance distribution efficiency for its retail outlets.
- In May, 2025, SM Investments Corp. launched an expansive solar-grid project across its provincial mall network in the Visayas region, transitioning over half of the facilities' power consumption to renewable energy.
Dive into Technavio’s robust research methodology, blending expert interviews, extensive data synthesis, and validated models for unparalleled Philippines Retail Market insights. See full methodology.
| Market Scope | |
|---|---|
| Page number | 191 |
| Base year | 2025 |
| Historic period | 2020-2024 |
| Forecast period | 2026-2030 |
| Growth momentum & CAGR | Accelerate at a CAGR of 11.9% |
| Market growth 2026-2030 | USD 87348.4 million |
| Market structure | Fragmented |
| YoY growth 2025-2026(%) | 10.7% |
| Key countries | Philippines |
| Competitive landscape | Leading Companies, Market Positioning of Companies, Competitive Strategies, and Industry Risks |
Research Analyst Overview
- The retail market is characterized by a rapid and continuous digital transformation, compelling incumbents to modernize at an unprecedented pace. Central to this evolution is the deployment of an omnichannel retail strategy, supported by technologies like ai-powered recommendations and contactless payment systems to enhance the customer journey.
- Boardroom-level decisions are increasingly focused on supply chain modernization, with significant capital allocated toward automated warehouse systems and advanced retail data analytics. For instance, the implementation of RFID inventory tracking has been shown to improve inventory accuracy to over 99%, a significant leap from the 80% accuracy typical of manual counts.
- This focus on operational excellence extends to customer experience personalization, dynamic pricing models, and the integration of mobile commerce applications. Success is no longer solely about physical footprint but about the seamless integration of point-of-sale systems, e-commerce platform integration, and real-time inventory management to create a cohesive and efficient retail ecosystem.
- This includes optimizing supply chain logistics and leveraging in-store analytics for better decision-making.
What are the Key Data Covered in this Philippines Retail Market Research and Growth Report?
-
What is the expected growth of the Philippines Retail Market between 2026 and 2030?
-
USD 87.35 billion, at a CAGR of 11.9%
-
-
What segmentation does the market report cover?
-
The report is segmented by Product (Food and beverages, Personal and household care, Apparel and footwear, Electrical and electronics, and Others), Distribution Channel (Offline, and Online), Packaging (Bottles, Cans, Tetra packs, Pouches, and Ready-to-drink formats) and Geography (APAC)
-
-
Which regions are analyzed in the report?
-
APAC
-
-
What are the key growth drivers and market challenges?
-
Expansion of middle class and increasing urbanization, Logistical and infrastructural bottlenecks in an archipelagic nation
-
-
Who are the major players in the Philippines Retail Market?
-
7 Eleven Inc., All Day Supermarket, Allhome, Goldilocks Bakeshop Inc., Jollibee Foods Corp., LANDMARK PH, Liwayway Marketing Corp., Mang Inasal Philippines Inc., Mercury Drug Corp., Metro Retail Stores Group, Ministop Co. Ltd, National Book Store Inc., Robinsons Retail Holdings Inc., Rustans, SM Retail Inc., The Golden ABC Inc., The Jollibee Group of Co., Vistamalls Inc., WalterMart Supermarket Inc. and Watsons Personal Care Stores Inc.
-
Market Research Insights
- The market's momentum is increasingly defined by the convergence of physical and digital channels, creating sophisticated phygital retail experiences. Firms that successfully map the omnichannel customer journey report up to a 15% higher customer lifetime value compared to their channel-siloed peers.
- The rise of hyper-local retail strategy is supported by an agile retail technology stack, enabling rapid adaptation to local demand. Furthermore, the implementation of strategic social commerce integration has been shown to decrease customer acquisition costs by over 20% in certain segments.
- Effective backend retail operations are fundamental to this evolution, ensuring that the front-end customer experience is supported by efficient and scalable systems.
We can help! Our analysts can customize this philippines retail market research report to meet your requirements.
 RIA -
RIA - 
