Retail Media Networks Market Analysis, Size, and Forecast 2025-2029: North America (US, Canada, and Mexico), Europe (Germany, UK, and France), APAC (China, Japan, and India), Middle East and Africa (Saudi Arabia, UAE, and South Africa), South America (Brazil, Argentina, and Colombia), and Rest of World (ROW)

Retail Media Networks Market Analysis, Size, and Forecast 2025-2029:
North America (US, Canada, and Mexico), Europe (Germany, UK, and France), APAC (China, Japan, and India), Middle East and Africa (Saudi Arabia, UAE, and South Africa), South America (Brazil, Argentina, and Colombia), and Rest of World (ROW)

Published: Dec 2025 308 Pages SKU: IRTNTR81136

Market Overview at a Glance

$18.80 B
Market Opportunity
11.2%
CAGR 2024 - 2029
36.9%
North America Growth
$15.98 B
Retailer owned networks segment 2023

Retail Media Networks Market Size 2025-2029

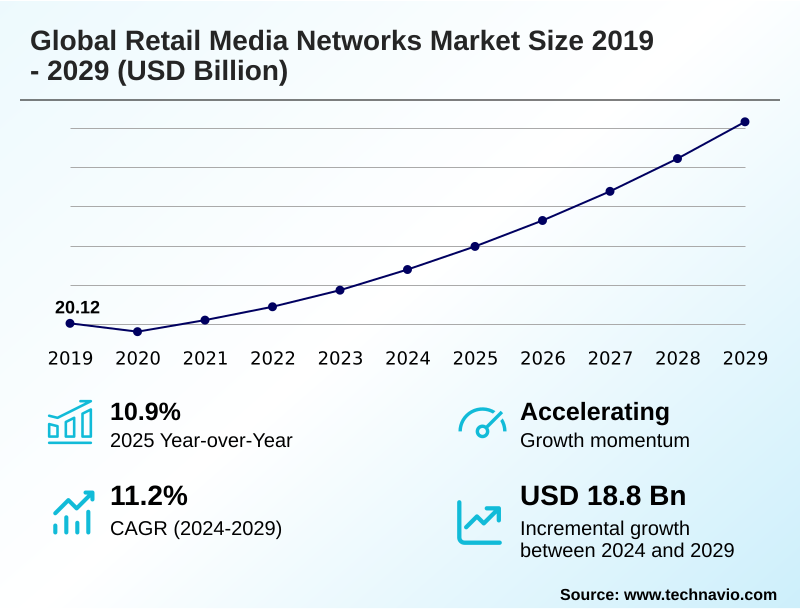
The retail media networks market size is valued to increase by USD 18.80 billion, at a CAGR of 11.2% from 2024 to 2029. Proliferation of first-party data amidst third-party cookie depreciation will drive the retail media networks market.

Major Market Trends & Insights

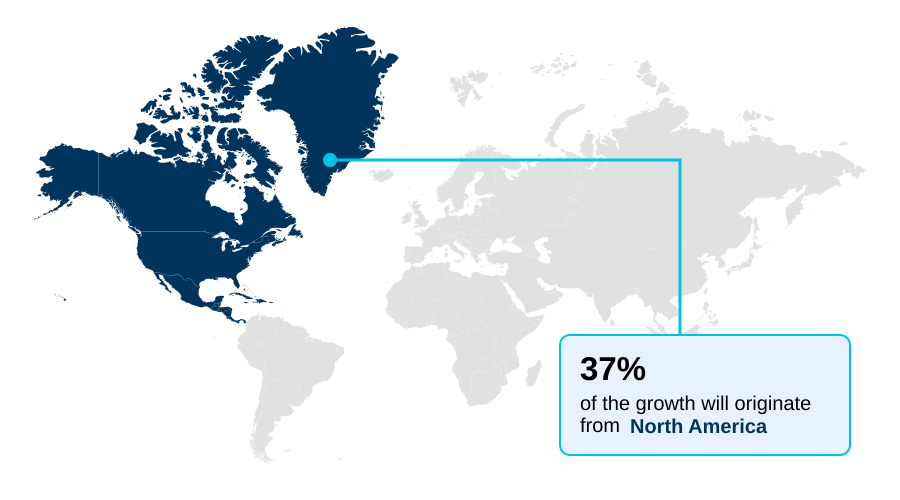
  • North America dominated the market and accounted for a 36.9% growth during the forecast period.
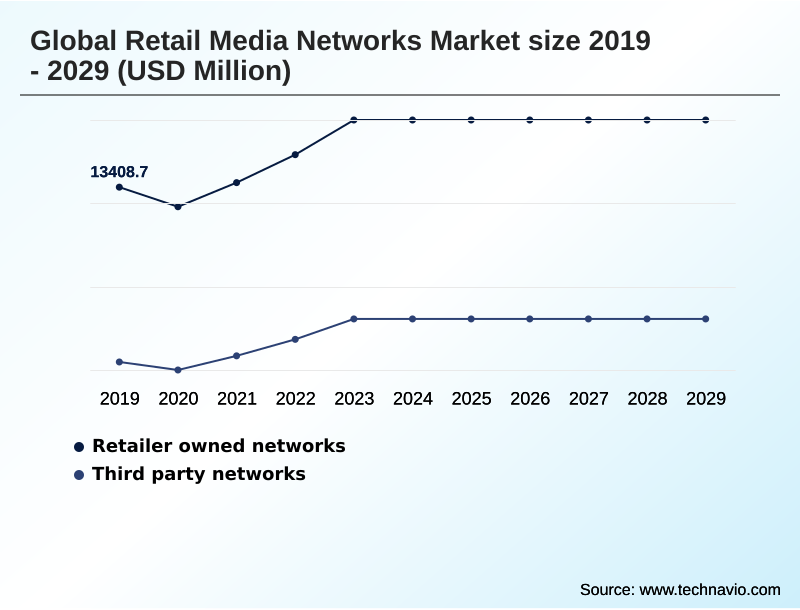
  • By Platform - Retailer owned networks segment was valued at USD 15.98 billion in 2023
  • By Type - Display ads segment accounted for the largest market revenue share in 2023

Market Size & Forecast

  • Market Opportunities: USD 25.66 billion
  • Market Future Opportunities: USD 18.80 billion
  • CAGR from 2024 to 2029 : 11.2%

Market Summary

  • The retail media networks market is undergoing a significant transformation, moving from a niche advertising channel to a central pillar of digital marketing strategy. This shift is primarily fueled by the diminishing effectiveness of traditional tracking methods, making retailer-owned first-party data a highly valuable asset.
  • Advertisers are increasingly turning to these networks to achieve closed-loop attribution, directly linking media spend to sales outcomes. Key trends include the expansion of advertising capabilities beyond retailers' owned websites to include connected TV and social media, alongside the digitization of the in-store experience.
  • For example, a consumer packaged goods company can now launch a new product using a retailer's self-service ad platform, targeting specific shopper segments with personalized video ads, and subsequently use in-store attribution data to measure how those digital campaigns influenced physical purchases.
  • However, the industry grapples with challenges such as measurement standardization and the need to balance ad load with a positive customer experience. Success in the retail media networks market requires navigating this complex ecosystem to deliver relevant, performance-driven campaigns.

What will be the Size of the Retail Media Networks Market during the forecast period?

Get Key Insights on Market Forecast (PDF) Request Free Sample

How is the Retail Media Networks Market Segmented?

The retail media networks industry research report provides comprehensive data (region-wise segment analysis), with forecasts and estimates in "USD million" for the period 2025-2029, as well as historical data from 2019-2023 for the following segments.

  • Platform
    • Retailer owned networks
    • Third party networks
  • Type
    • Display ads
    • Sponsored products
    • Video ads
    • Others
  • End-user
    • Consumer packaged goods
    • Electronics and technology
    • Apparel and fashion
    • Grocery and food delivery
    • Others
  • Geography
    • North America
      • US
      • Canada
      • Mexico
    • Europe
      • Germany
      • UK
      • France
    • APAC
      • China
      • Japan
      • India
    • Middle East and Africa
      • Saudi Arabia
      • UAE
      • South Africa
    • South America
      • Brazil
      • Argentina
      • Colombia
    • Rest of World (ROW)

By Platform Insights

The retailer owned networks segment is estimated to witness significant growth during the forecast period.

Retailer-owned networks are a dominant force, characterized by proprietary advertising platforms that grant operators full control over first-party data activation and the overall advertiser experience. These networks are built on significant infrastructure investments to enable sophisticated shopper data monetization.

This model, which now accounts for over 65% of total market activity, leverages loyalty program data to offer advanced capabilities like programmatic display ads and detailed omnichannel measurement.

As third-party cookie depreciation continues, the value of these walled-garden ecosystems increases, providing a competitive edge through superior cookieless audience targeting.

Effective ad load management is critical to balance this advertising revenue stream with a positive shopping journey, ensuring long-term platform viability and delivering strong return on ad spend for partners.

Request Free Sample

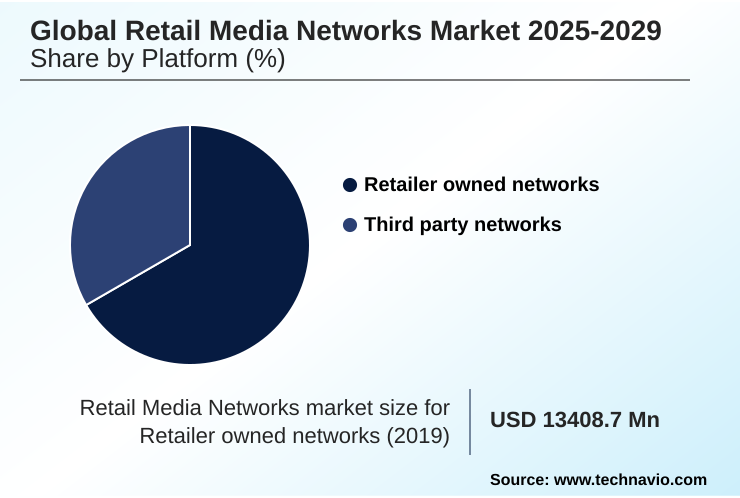
The Retailer owned networks segment was valued at USD 15.98 billion in 2023 and showed a gradual increase during the forecast period.

Request Free Sample

Regional Analysis

North America is estimated to contribute 36.9% to the growth of the global market during the forecast period.Technavio’s analysts have elaborately explained the regional trends and drivers that shape the market during the forecast period.

See How Retail Media Networks Market Demand is Rising in North America Request Free Sample

The market's geographic landscape is led by North America, which is projected to contribute nearly 37% of the total incremental growth, underscoring its maturity and high adoption rate of full-funnel marketing solutions.

In this region, advanced commerce media platforms have demonstrated up to a 20% increase in campaign efficiency through superior data-driven optimization. Following closely, APAC and Europe represent dynamic growth fronts, together accounting for over 53% of the market opportunity.

The APAC market is characterized by mobile-first ecosystems and the integration of AI-powered recommendations. Europe's development is shaped by strict data privacy regulations, which has accelerated the demand for consent-based supplier-funded advertising and effective technology stack integration.

The remaining regions, including South America and the Middle East and Africa, are emerging markets focused on building foundational retail media APIs and infrastructure.

Market Dynamics

Our researchers analyzed the data with 2024 as the base year, along with the key drivers, trends, and challenges. A holistic analysis of drivers will help companies refine their marketing strategies to gain a competitive advantage.

  • Successfully navigating the evolving digital advertising landscape requires a deep understanding of how to execute a full-funnel retail media strategy, particularly for consumer packaged goods (CPG) brands. A central challenge is connecting digital ads to in-store sales, a task that demands robust omnichannel attribution for sponsored search ads.
  • The solution often involves leveraging loyalty data for programmatic advertising, which allows for precise targeting. However, this approach highlights the persistent challenges of retail media network standardization, making it difficult to compare performance across different platforms. Accurately measuring incremental lift in retail media is therefore paramount, as it distinguishes true advertising impact from sales that would have occurred anyway.
  • Advanced strategies are now integrating retail data with connected TV targeting, creating a powerful combination of reach and relevance. The future of in-store retail media technology and the role of AI in retail media personalization will further enhance these capabilities. Moreover, the industry is exploring how to effectively target non-endemic brands on retail sites.
  • Firms that master the art of managing campaign fragmentation across networks and can prove a clear return on investment by enhancing ROAS with first-party shopper data will gain a significant competitive advantage. As programmatic buying in walled garden environments becomes more sophisticated, analyzing shoppable video ad performance measurement will be key to optimizing media budgets.
  • Ultimately, the ability to balance ad revenue with customer experience will define long-term success.

What are the key market drivers leading to the rise in the adoption of Retail Media Networks Industry?

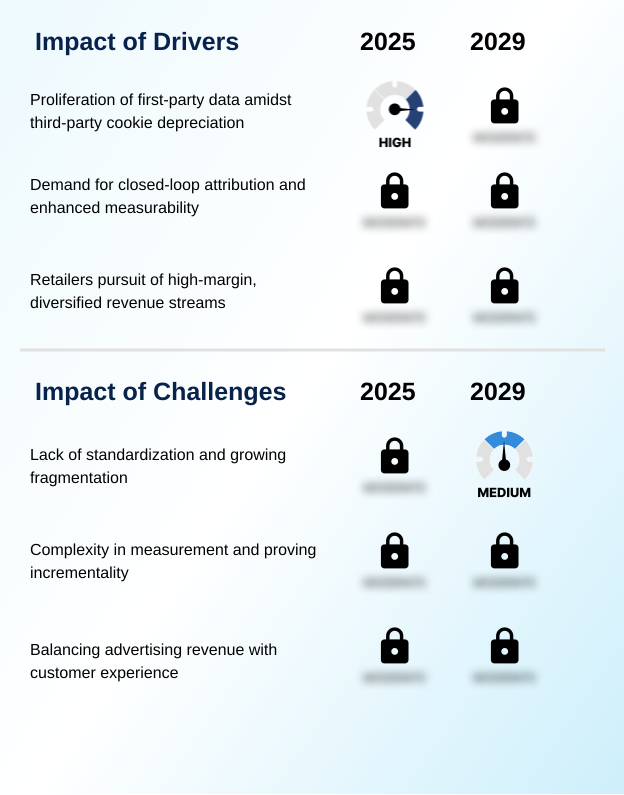
  • The proliferation of retailer-owned first-party data, spurred by the depreciation of third-party cookies, is a primary driver of market growth.

  • Market growth is primarily driven by the high demand for measurable advertising outcomes and new revenue streams for retailers.
  • The deprecation of third-party cookies has made first-party data the cornerstone of digital advertising, with platforms leveraging loyalty program data improving audience targeting accuracy by over 50%.
  • This enables precise, performance-based campaigns and robust closed-loop attribution, allowing brands to justify trade marketing budgets with concrete sales data.
  • For retailers, the development of an advertising revenue stream provides a high-margin business that improves overall profitability, with advertising contributing up to 5% of total EBIT in mature operations.
  • This dynamic is shifting budgets toward channels that offer clear marketing mix optimization and shopper marketing insights.

What are the market trends shaping the Retail Media Networks Industry?

  • A defining market trend involves the strategic expansion of advertising capabilities beyond retailers' owned digital properties. This evolution transforms retail media into a full-funnel marketing tool by leveraging first-party data across the open internet.

  • Key market trends are redefining advertising effectiveness, with a notable shift toward off-site media extension and omnichannel retail strategy. The strategic push to activate shopper data beyond a retailer’s own properties through connected TV advertising and other channels is expanding the scope of performance-based campaigns.
  • This integration is delivering measurable results, with campaigns that span online and in-store digital media showing up to a 20% uplift in customer lifetime value. Concurrently, the proliferation of self-service ad platforms is democratizing access, enabling smaller brands to reduce campaign setup times by over 40%.
  • This trend toward campaign automation and media network consolidation fosters a more agile and competitive environment, allowing for more dynamic creative optimization.

What challenges does the Retail Media Networks Industry face during its growth?

  • The lack of standardization across a rapidly fragmenting landscape of distinct retail media platforms presents a significant challenge to market scalability and efficiency.

  • The market faces significant operational hurdles, primarily stemming from the lack of retail media standardization and the complexities of omnichannel measurement. The fragmentation across walled-garden ecosystems can increase operational overhead for agencies by up to 35% when managing campaigns across multiple retailers.
  • Proving the true impact of spend is another issue, as default attribution models often fail to provide accurate incrementality measurement. Furthermore, retailers must carefully balance ad revenue with user experience optimization, as A/B testing reveals that excessive ad loads can decrease organic conversion rates by 10%.
  • These factors necessitate a greater focus on media mix modeling and create challenges in achieving a holistic view of campaign performance metrics.

Exclusive Technavio Analysis on Customer Landscape

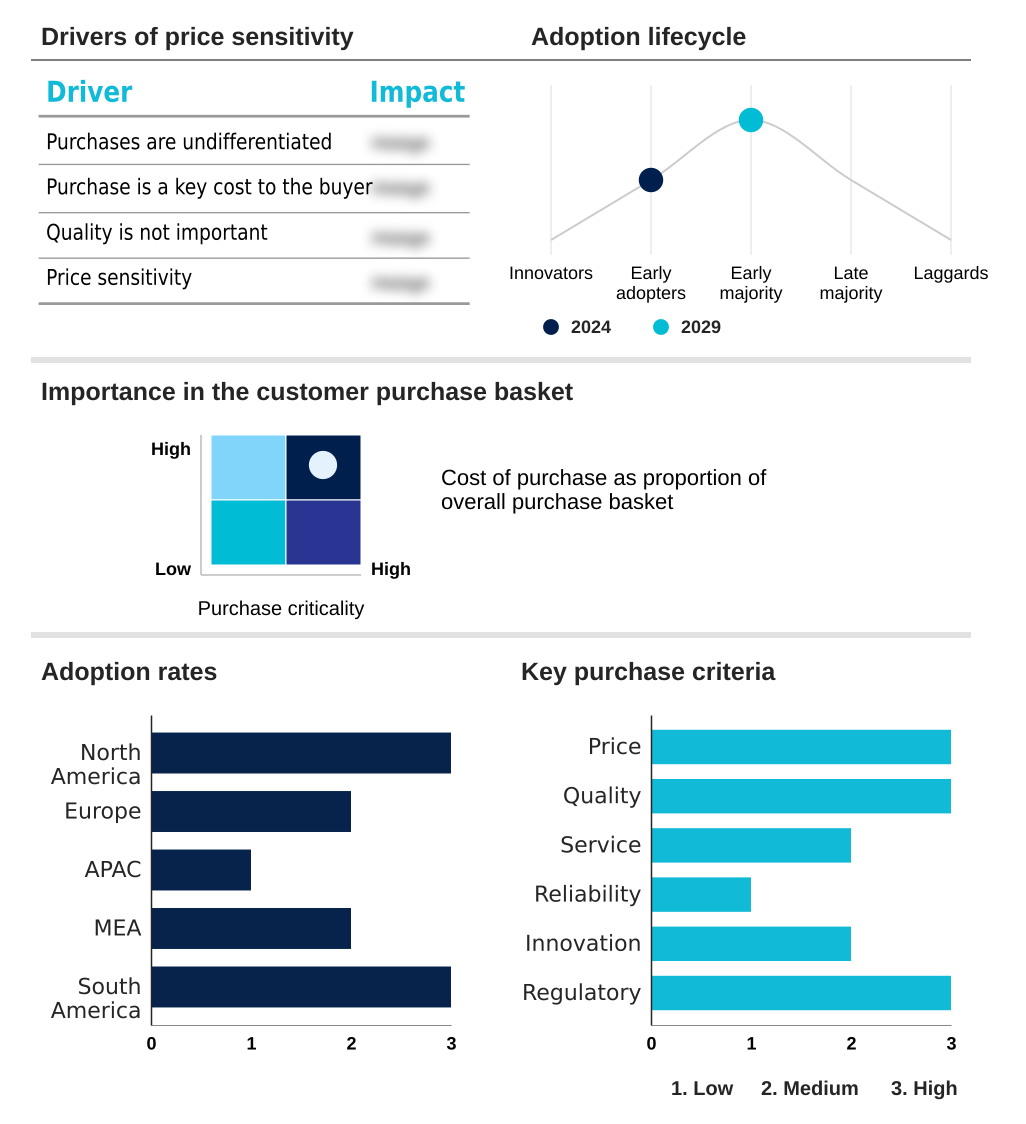
The retail media networks market forecasting report includes the adoption lifecycle of the market, covering from the innovator’s stage to the laggard’s stage. It focuses on adoption rates in different regions based on penetration. Furthermore, the retail media networks market report also includes key purchase criteria and drivers of price sensitivity to help companies evaluate and develop their market growth analysis strategies.

Customer Landscape of Retail Media Networks Industry

Competitive Landscape

Companies are implementing various strategies, such as strategic alliances, retail media networks market forecast, partnerships, mergers and acquisitions, geographical expansion, and product/service launches, to enhance their presence in the industry.

Albertsons Co. Inc - Offerings include integrated advertising platforms with sponsored products and display ads, designed to engage high-intent shoppers directly within a vast e-commerce ecosystem.

The industry research and growth report includes detailed analyses of the competitive landscape of the market and information about key companies, including:

  • Albertsons Co. Inc
  • Alibaba Group Holding Ltd.
  • Amazon.com Inc.
  • Best Buy Co. Inc.
  • Carrefour SA
  • CVS Health Corp.
  • eBay Inc.
  • JD.com Inc.
  • Lowes Co. Inc.
  • Macys Inc.
  • Maplebear Inc.
  • Target Corp.
  • Tesco Plc
  • The Home Depot Inc.
  • The Kroger Co.
  • Walmart Inc.
  • Wayfair Inc.

Qualitative and quantitative analysis of companies has been conducted to help clients understand the wider business environment as well as the strengths and weaknesses of key industry players. Data is qualitatively analyzed to categorize companies as pure play, category-focused, industry-focused, and diversified; it is quantitatively analyzed to categorize companies as dominant, leading, strong, tentative, and weak.

Recent Development and News in Retail media networks market

  • In August 2024, Macy's Media Network expanded its partnership with marketing technology firm Rokt to utilize AI for personalizing the post-purchase customer journey.
  • In September 2024, Tesco Media and Insight Platform extended its partnership with The Trade Desk to allow advertisers to use anonymized Tesco Clubcard data for targeting audiences on the open internet.
  • In October 2024, The Home Depot launched Orange Access, a new self-service platform designed to simplify campaign planning and management for its supplier partners on the Orange Apron Media network.
  • In May 2025, Unlimitail announced a partnership with Pacvue to enhance self-service capabilities for brands and agencies, starting with the Carrefour platform in France.

Dive into Technavio’s robust research methodology, blending expert interviews, extensive data synthesis, and validated models for unparalleled Retail Media Networks Market insights. See full methodology.

Market Scope
Page number 308
Base year 2024
Historic period 2019-2023
Forecast period 2025-2029
Growth momentum & CAGR Accelerate at a CAGR of 11.2%
Market growth 2025-2029 USD 18804.4 million
Market structure Fragmented
YoY growth 2024-2025(%) 10.9%
Key countries US, Canada, Mexico, Germany, UK, France, Italy, Spain, The Netherlands, China, Japan, India, Australia, South Korea, Indonesia, Saudi Arabia, UAE, South Africa, Turkey, Israel, Brazil, Argentina and Colombia
Competitive landscape Leading Companies, Market Positioning of Companies, Competitive Strategies, and Industry Risks

Request Free Sample

Research Analyst Overview

  • The retail media networks market's trajectory is fundamentally shaped by the industry-wide third-party cookie depreciation, which has elevated the strategic value of first-party data activation. Retailer-owned networks are at the forefront, enabling sophisticated shopper data monetization through proprietary self-service ad platforms.
  • Advertisers are deploying sponsored product ads and programmatic display ads to achieve closed-loop attribution and precisely measure return on ad spend. The critical boardroom decision now revolves around investment in omnichannel measurement, which is essential for bridging the digital and physical divide. Advanced platforms using cookieless audience targeting have already demonstrated a 30% greater efficiency in reaching qualified buyers.
  • The pursuit of true incrementality measurement and the use of data clean rooms are becoming standard practice. As the landscape matures, the focus is shifting toward full-funnel marketing solutions, including shoppable video ads and connected TV advertising, creating a more cohesive and measurable advertising revenue stream for retailers.

What are the Key Data Covered in this Retail Media Networks Market Research and Growth Report?

  • What is the expected growth of the Retail Media Networks Market between 2025 and 2029?

    • USD 18.80 billion, at a CAGR of 11.2%

  • What segmentation does the market report cover?

    • The report is segmented by Platform (Retailer owned networks, and Third party networks), Type (Display ads, Sponsored products, Video ads, and Others), End-user (Consumer goods, Electronics and technology, Apparel and fashion, Grocery and food delivery, and Others) and Geography (North America, Europe, APAC, Middle East and Africa, South America)

  • Which regions are analyzed in the report?

    • North America, Europe, APAC, Middle East and Africa and South America

  • What are the key growth drivers and market challenges?

    • Proliferation of first-party data amidst third-party cookie depreciation, Lack of standardization and growing fragmentation

  • Who are the major players in the Retail Media Networks Market?

    • Albertsons Co. Inc, Alibaba Group Holding Ltd., Amazon.com Inc., Best Buy Co. Inc., Carrefour SA, CVS Health Corp., eBay Inc., JD.com Inc., Lowes Co. Inc., Macys Inc., Maplebear Inc., Target Corp., Tesco Plc, The Home Depot Inc., The Kroger Co., Walmart Inc. and Wayfair Inc.

Market Research Insights

  • The market's dynamics are driven by a strategic shift toward performance-based campaigns and data-driven optimization, where advertisers demand tangible results. This focus on efficiency is reshaping shopper marketing insights, with leading platforms showing that advanced audience segmentation can improve click-through rates by up to 30%.
  • Digital shelf optimization is also critical, as premium ad placements have been linked to a 20% lift in product consideration. As competition intensifies, advertisers are using brand term targeting and other sophisticated tactics to protect and grow market share. Furthermore, the push for advertiser self-service is accelerating, with self-managed campaigns achieving a 15% faster route to market compared to managed services.
  • These shifts underscore a move toward greater transparency, control, and accountability in advertising spend.

We can help! Our analysts can customize this retail media networks market research report to meet your requirements.

Get in touch

1. Executive Summary

1.1 Market overview

Executive Summary - Chart on Market Overview
Executive Summary - Data Table on Market Overview
Executive Summary - Chart on Global Market Characteristics
Executive Summary - Chart on Market by Geography
Executive Summary - Chart on Market Segmentation by Platform
Executive Summary - Chart on Market Segmentation by Type
Executive Summary - Chart on Market Segmentation by End-user
Executive Summary - Chart on Incremental Growth
Executive Summary - Data Table on Incremental Growth
Executive Summary - Chart on Company Market Positioning

2. Technavio Analysis

2.1 Analysis of price sensitivity, lifecycle, customer purchase basket, adoption rates, and purchase criteria

2.2 Criticality of inputs and Factors of differentiation

Chart on Overview on criticality of inputs and factors of differentiation

2.3 Factors of disruption

Chart on Overview on factors of disruption

2.4 Impact of drivers and challenges

Chart on Impact of drivers and challenges in 2024 and 2029

3. Market Landscape

3.1 Market ecosystem

Chart on Parent Market
Data Table on - Parent Market

3.2 Market characteristics

Chart on Market characteristics analysis

3.3 Value chain analysis

Chart on Value chain analysis

4. Market Sizing

4.1 Market definition

Data Table on Offerings of companies included in the market definition

4.2 Market segment analysis

Market segments

4.3 Market size 2024

4.4 Market outlook: Forecast for 2024-2029

Chart on Global - Market size and forecast 2024-2029 ($ million)
Data Table on Global - Market size and forecast 2024-2029 ($ million)
Chart on Global Market: Year-over-year growth 2024-2029 (%)
Data Table on Global Market: Year-over-year growth 2024-2029 (%)

5. Historic Market Size

5.1 Global Retail Media Networks Market 2019 - 2023

Historic Market Size - Data Table on Global Retail Media Networks Market 2019 - 2023 ($ million)

5.2 Platform segment analysis 2019 - 2023

Historic Market Size - Platform Segment 2019 - 2023 ($ million)

5.3 Type segment analysis 2019 - 2023

Historic Market Size - Type Segment 2019 - 2023 ($ million)

5.4 End-user segment analysis 2019 - 2023

Historic Market Size - End-user Segment 2019 - 2023 ($ million)

5.5 Geography segment analysis 2019 - 2023

Historic Market Size - Geography Segment 2019 - 2023 ($ million)

5.6 Country segment analysis 2019 - 2023

Historic Market Size - Country Segment 2019 - 2023 ($ million)

6. Qualitative Analysis

6.1 The AI impact on global retail media networks market

7. Five Forces Analysis

7.1 Five forces summary

Five forces analysis - Comparison between 2024 and 2029

7.2 Bargaining power of buyers

Bargaining power of buyers - Impact of key factors 2024 and 2029

7.3 Bargaining power of suppliers

Bargaining power of suppliers - Impact of key factors in 2024 and 2029

7.4 Threat of new entrants

Threat of new entrants - Impact of key factors in 2024 and 2029

7.5 Threat of substitutes

Threat of substitutes - Impact of key factors in 2024 and 2029

7.6 Threat of rivalry

Threat of rivalry - Impact of key factors in 2024 and 2029

7.7 Market condition

Chart on Market condition - Five forces 2024 and 2029

8. Market Segmentation by Platform

8.1 Market segments

Chart on Platform - Market share 2024-2029 (%)
Data Table on Platform - Market share 2024-2029 (%)

8.2 Comparison by Platform

Chart on Comparison by Platform
Data Table on Comparison by Platform

8.3 Retailer owned networks - Market size and forecast 2024-2029

Chart on Retailer owned networks - Market size and forecast 2024-2029 ($ million)
Data Table on Retailer owned networks - Market size and forecast 2024-2029 ($ million)
Chart on Retailer owned networks - Year-over-year growth 2024-2029 (%)
Data Table on Retailer owned networks - Year-over-year growth 2024-2029 (%)

8.4 Third party networks - Market size and forecast 2024-2029

Chart on Third party networks - Market size and forecast 2024-2029 ($ million)
Data Table on Third party networks - Market size and forecast 2024-2029 ($ million)
Chart on Third party networks - Year-over-year growth 2024-2029 (%)
Data Table on Third party networks - Year-over-year growth 2024-2029 (%)

8.5 Market opportunity by Platform

Market opportunity by Platform ($ million)
Data Table on Market opportunity by Platform ($ million)

9. Market Segmentation by Type

9.1 Market segments

Chart on Type - Market share 2024-2029 (%)
Data Table on Type - Market share 2024-2029 (%)

9.2 Comparison by Type

Chart on Comparison by Type
Data Table on Comparison by Type

9.3 Display ads - Market size and forecast 2024-2029

Chart on Display ads - Market size and forecast 2024-2029 ($ million)
Data Table on Display ads - Market size and forecast 2024-2029 ($ million)
Chart on Display ads - Year-over-year growth 2024-2029 (%)
Data Table on Display ads - Year-over-year growth 2024-2029 (%)

9.4 Sponsored products - Market size and forecast 2024-2029

Chart on Sponsored products - Market size and forecast 2024-2029 ($ million)
Data Table on Sponsored products - Market size and forecast 2024-2029 ($ million)
Chart on Sponsored products - Year-over-year growth 2024-2029 (%)
Data Table on Sponsored products - Year-over-year growth 2024-2029 (%)

9.5 Video ads - Market size and forecast 2024-2029

Chart on Video ads - Market size and forecast 2024-2029 ($ million)
Data Table on Video ads - Market size and forecast 2024-2029 ($ million)
Chart on Video ads - Year-over-year growth 2024-2029 (%)
Data Table on Video ads - Year-over-year growth 2024-2029 (%)

9.6 Others - Market size and forecast 2024-2029

Chart on Others - Market size and forecast 2024-2029 ($ million)
Data Table on Others - Market size and forecast 2024-2029 ($ million)
Chart on Others - Year-over-year growth 2024-2029 (%)
Data Table on Others - Year-over-year growth 2024-2029 (%)

9.7 Market opportunity by Type

Market opportunity by Type ($ million)
Data Table on Market opportunity by Type ($ million)

10. Market Segmentation by End-user

10.1 Market segments

Chart on End-user - Market share 2024-2029 (%)
Data Table on End-user - Market share 2024-2029 (%)

10.2 Comparison by End-user

Chart on Comparison by End-user
Data Table on Comparison by End-user

10.3 Consumer packaged goods - Market size and forecast 2024-2029

Chart on Consumer packaged goods - Market size and forecast 2024-2029 ($ million)
Data Table on Consumer packaged goods - Market size and forecast 2024-2029 ($ million)
Chart on Consumer packaged goods - Year-over-year growth 2024-2029 (%)
Data Table on Consumer packaged goods - Year-over-year growth 2024-2029 (%)

10.4 Electronics and technology - Market size and forecast 2024-2029

Chart on Electronics and technology - Market size and forecast 2024-2029 ($ million)
Data Table on Electronics and technology - Market size and forecast 2024-2029 ($ million)
Chart on Electronics and technology - Year-over-year growth 2024-2029 (%)
Data Table on Electronics and technology - Year-over-year growth 2024-2029 (%)

10.5 Apparel and fashion - Market size and forecast 2024-2029

Chart on Apparel and fashion - Market size and forecast 2024-2029 ($ million)
Data Table on Apparel and fashion - Market size and forecast 2024-2029 ($ million)
Chart on Apparel and fashion - Year-over-year growth 2024-2029 (%)
Data Table on Apparel and fashion - Year-over-year growth 2024-2029 (%)

10.6 Grocery and food delivery - Market size and forecast 2024-2029

Chart on Grocery and food delivery - Market size and forecast 2024-2029 ($ million)
Data Table on Grocery and food delivery - Market size and forecast 2024-2029 ($ million)
Chart on Grocery and food delivery - Year-over-year growth 2024-2029 (%)
Data Table on Grocery and food delivery - Year-over-year growth 2024-2029 (%)

10.7 Others - Market size and forecast 2024-2029

Chart on Others - Market size and forecast 2024-2029 ($ million)
Data Table on Others - Market size and forecast 2024-2029 ($ million)
Chart on Others - Year-over-year growth 2024-2029 (%)
Data Table on Others - Year-over-year growth 2024-2029 (%)

10.8 Market opportunity by End-user

Market opportunity by End-user ($ million)
Data Table on Market opportunity by End-user ($ million)

11. Customer Landscape

11.1 Customer landscape overview

Analysis of price sensitivity, lifecycle, customer purchase basket, adoption rates, and purchase criteria

12. Geographic Landscape

12.1 Geographic segmentation

Chart on Market share by geography 2024-2029 (%)
Data Table on Market share by geography 2024-2029 (%)

12.2 Geographic comparison

Chart on Geographic comparison
Data Table on Geographic comparison

12.3 North America - Market size and forecast 2024-2029

Chart on North America - Market size and forecast 2024-2029 ($ million)
Data Table on North America - Market size and forecast 2024-2029 ($ million)
Chart on North America - Year-over-year growth 2024-2029 (%)
Data Table on North America - Year-over-year growth 2024-2029 (%)
Chart on Regional Comparison - North America
Data Table on Regional Comparison - North America

12.3.1 US - Market size and forecast 2024-2029

Chart on US - Market size and forecast 2024-2029 ($ million)
Data Table on US - Market size and forecast 2024-2029 ($ million)
Chart on US - Year-over-year growth 2024-2029 (%)
Data Table on US - Year-over-year growth 2024-2029 (%)

12.3.2 Canada - Market size and forecast 2024-2029

Chart on Canada - Market size and forecast 2024-2029 ($ million)
Data Table on Canada - Market size and forecast 2024-2029 ($ million)
Chart on Canada - Year-over-year growth 2024-2029 (%)
Data Table on Canada - Year-over-year growth 2024-2029 (%)

12.3.3 Mexico - Market size and forecast 2024-2029

Chart on Mexico - Market size and forecast 2024-2029 ($ million)
Data Table on Mexico - Market size and forecast 2024-2029 ($ million)
Chart on Mexico - Year-over-year growth 2024-2029 (%)
Data Table on Mexico - Year-over-year growth 2024-2029 (%)

12.4 Europe - Market size and forecast 2024-2029

Chart on Europe - Market size and forecast 2024-2029 ($ million)
Data Table on Europe - Market size and forecast 2024-2029 ($ million)
Chart on Europe - Year-over-year growth 2024-2029 (%)
Data Table on Europe - Year-over-year growth 2024-2029 (%)
Chart on Regional Comparison - Europe
Data Table on Regional Comparison - Europe

12.4.1 Germany - Market size and forecast 2024-2029

Chart on Germany - Market size and forecast 2024-2029 ($ million)
Data Table on Germany - Market size and forecast 2024-2029 ($ million)
Chart on Germany - Year-over-year growth 2024-2029 (%)
Data Table on Germany - Year-over-year growth 2024-2029 (%)

12.4.2 UK - Market size and forecast 2024-2029

Chart on UK - Market size and forecast 2024-2029 ($ million)
Data Table on UK - Market size and forecast 2024-2029 ($ million)
Chart on UK - Year-over-year growth 2024-2029 (%)
Data Table on UK - Year-over-year growth 2024-2029 (%)

12.4.3 France - Market size and forecast 2024-2029

Chart on France - Market size and forecast 2024-2029 ($ million)
Data Table on France - Market size and forecast 2024-2029 ($ million)
Chart on France - Year-over-year growth 2024-2029 (%)
Data Table on France - Year-over-year growth 2024-2029 (%)

12.4.4 Italy - Market size and forecast 2024-2029

Chart on Italy - Market size and forecast 2024-2029 ($ million)
Data Table on Italy - Market size and forecast 2024-2029 ($ million)
Chart on Italy - Year-over-year growth 2024-2029 (%)
Data Table on Italy - Year-over-year growth 2024-2029 (%)

12.4.5 Spain - Market size and forecast 2024-2029

Chart on Spain - Market size and forecast 2024-2029 ($ million)
Data Table on Spain - Market size and forecast 2024-2029 ($ million)
Chart on Spain - Year-over-year growth 2024-2029 (%)
Data Table on Spain - Year-over-year growth 2024-2029 (%)

12.4.6 The Netherlands - Market size and forecast 2024-2029

Chart on The Netherlands - Market size and forecast 2024-2029 ($ million)
Data Table on The Netherlands - Market size and forecast 2024-2029 ($ million)
Chart on The Netherlands - Year-over-year growth 2024-2029 (%)
Data Table on The Netherlands - Year-over-year growth 2024-2029 (%)

12.5 APAC - Market size and forecast 2024-2029

Chart on APAC - Market size and forecast 2024-2029 ($ million)
Data Table on APAC - Market size and forecast 2024-2029 ($ million)
Chart on APAC - Year-over-year growth 2024-2029 (%)
Data Table on APAC - Year-over-year growth 2024-2029 (%)
Chart on Regional Comparison - APAC
Data Table on Regional Comparison - APAC

12.5.1 China - Market size and forecast 2024-2029

Chart on China - Market size and forecast 2024-2029 ($ million)
Data Table on China - Market size and forecast 2024-2029 ($ million)
Chart on China - Year-over-year growth 2024-2029 (%)
Data Table on China - Year-over-year growth 2024-2029 (%)

12.5.2 Japan - Market size and forecast 2024-2029

Chart on Japan - Market size and forecast 2024-2029 ($ million)
Data Table on Japan - Market size and forecast 2024-2029 ($ million)
Chart on Japan - Year-over-year growth 2024-2029 (%)
Data Table on Japan - Year-over-year growth 2024-2029 (%)

12.5.3 India - Market size and forecast 2024-2029

Chart on India - Market size and forecast 2024-2029 ($ million)
Data Table on India - Market size and forecast 2024-2029 ($ million)
Chart on India - Year-over-year growth 2024-2029 (%)
Data Table on India - Year-over-year growth 2024-2029 (%)

12.5.4 Australia - Market size and forecast 2024-2029

Chart on Australia - Market size and forecast 2024-2029 ($ million)
Data Table on Australia - Market size and forecast 2024-2029 ($ million)
Chart on Australia - Year-over-year growth 2024-2029 (%)
Data Table on Australia - Year-over-year growth 2024-2029 (%)

12.5.5 South Korea - Market size and forecast 2024-2029

Chart on South Korea - Market size and forecast 2024-2029 ($ million)
Data Table on South Korea - Market size and forecast 2024-2029 ($ million)
Chart on South Korea - Year-over-year growth 2024-2029 (%)
Data Table on South Korea - Year-over-year growth 2024-2029 (%)

12.5.6 Indonesia - Market size and forecast 2024-2029

Chart on Indonesia - Market size and forecast 2024-2029 ($ million)
Data Table on Indonesia - Market size and forecast 2024-2029 ($ million)
Chart on Indonesia - Year-over-year growth 2024-2029 (%)
Data Table on Indonesia - Year-over-year growth 2024-2029 (%)

12.6 Middle East and Africa - Market size and forecast 2024-2029

Chart on Middle East and Africa - Market size and forecast 2024-2029 ($ million)
Data Table on Middle East and Africa - Market size and forecast 2024-2029 ($ million)
Chart on Middle East and Africa - Year-over-year growth 2024-2029 (%)
Data Table on Middle East and Africa - Year-over-year growth 2024-2029 (%)
Chart on Regional Comparison - Middle East and Africa
Data Table on Regional Comparison - Middle East and Africa

12.6.1 Saudi Arabia - Market size and forecast 2024-2029

Chart on Saudi Arabia - Market size and forecast 2024-2029 ($ million)
Data Table on Saudi Arabia - Market size and forecast 2024-2029 ($ million)
Chart on Saudi Arabia - Year-over-year growth 2024-2029 (%)
Data Table on Saudi Arabia - Year-over-year growth 2024-2029 (%)

12.6.2 UAE - Market size and forecast 2024-2029

Chart on UAE - Market size and forecast 2024-2029 ($ million)
Data Table on UAE - Market size and forecast 2024-2029 ($ million)
Chart on UAE - Year-over-year growth 2024-2029 (%)
Data Table on UAE - Year-over-year growth 2024-2029 (%)

12.6.3 South Africa - Market size and forecast 2024-2029

Chart on South Africa - Market size and forecast 2024-2029 ($ million)
Data Table on South Africa - Market size and forecast 2024-2029 ($ million)
Chart on South Africa - Year-over-year growth 2024-2029 (%)
Data Table on South Africa - Year-over-year growth 2024-2029 (%)

12.6.4 Turkey - Market size and forecast 2024-2029

Chart on Turkey - Market size and forecast 2024-2029 ($ million)
Data Table on Turkey - Market size and forecast 2024-2029 ($ million)
Chart on Turkey - Year-over-year growth 2024-2029 (%)
Data Table on Turkey - Year-over-year growth 2024-2029 (%)

12.6.5 Israel - Market size and forecast 2024-2029

Chart on Israel - Market size and forecast 2024-2029 ($ million)
Data Table on Israel - Market size and forecast 2024-2029 ($ million)
Chart on Israel - Year-over-year growth 2024-2029 (%)
Data Table on Israel - Year-over-year growth 2024-2029 (%)

12.7 South America - Market size and forecast 2024-2029

Chart on South America - Market size and forecast 2024-2029 ($ million)
Data Table on South America - Market size and forecast 2024-2029 ($ million)
Chart on South America - Year-over-year growth 2024-2029 (%)
Data Table on South America - Year-over-year growth 2024-2029 (%)
Chart on Regional Comparison - South America
Data Table on Regional Comparison - South America

12.7.1 Brazil - Market size and forecast 2024-2029

Chart on Brazil - Market size and forecast 2024-2029 ($ million)
Data Table on Brazil - Market size and forecast 2024-2029 ($ million)
Chart on Brazil - Year-over-year growth 2024-2029 (%)
Data Table on Brazil - Year-over-year growth 2024-2029 (%)

12.7.2 Argentina - Market size and forecast 2024-2029

Chart on Argentina - Market size and forecast 2024-2029 ($ million)
Data Table on Argentina - Market size and forecast 2024-2029 ($ million)
Chart on Argentina - Year-over-year growth 2024-2029 (%)
Data Table on Argentina - Year-over-year growth 2024-2029 (%)

12.7.3 Colombia - Market size and forecast 2024-2029

Chart on Colombia - Market size and forecast 2024-2029 ($ million)
Data Table on Colombia - Market size and forecast 2024-2029 ($ million)
Chart on Colombia - Year-over-year growth 2024-2029 (%)
Data Table on Colombia - Year-over-year growth 2024-2029 (%)

12.8 Market opportunity by geography

Market opportunity by geography ($ million)
Data Tables on Market opportunity by geography ($ million)

13. Drivers, Challenges, and Opportunity

13.1 Market drivers

Proliferation of first-party data amidst third-party cookie depreciation
Demand for closed-loop attribution and enhanced measurability
Retailers pursuit of high-margin, diversified revenue streams

13.2 Market challenges

Lack of standardization and growing fragmentation
Complexity in measurement and proving incrementality
Balancing advertising revenue with customer experience

13.3 Impact of drivers and challenges

Impact of drivers and challenges in 2024 and 2029

13.4 Market opportunities

Expansion beyond owned properties
Bridging digital and physical divide
Democratization of access

14. Competitive Landscape

14.1 Overview

14.2

Overview on criticality of inputs and factors of differentiation

14.3 Landscape disruption

Overview on factors of disruption

14.4 Industry risks

Impact of key risks on business

15. Competitive Analysis

15.1 Companies profiled

Companies covered

15.2 Company ranking index

15.3 Market positioning of companies

Matrix on companies position and classification

15.4 Albertsons Co. Inc

Albertsons Co. Inc - Overview
Albertsons Co. Inc - Product / Service
Albertsons Co. Inc - Key offerings
SWOT

15.5 Amazon.com Inc.

Amazon.com Inc. - Overview
Amazon.com Inc. - Business segments
Amazon.com Inc. - Key news
Amazon.com Inc. - Key offerings
Amazon.com Inc. - Segment focus
SWOT

15.6 Best Buy Co. Inc.

Best Buy Co. Inc. - Overview
Best Buy Co. Inc. - Business segments
Best Buy Co. Inc. - Key news
Best Buy Co. Inc. - Key offerings
Best Buy Co. Inc. - Segment focus
SWOT

15.7 Carrefour SA

Carrefour SA - Overview
Carrefour SA - Business segments
Carrefour SA - Key offerings
Carrefour SA - Segment focus
SWOT

15.8 CVS Health Corp.

CVS Health Corp. - Overview
CVS Health Corp. - Business segments
CVS Health Corp. - Key offerings
CVS Health Corp. - Segment focus
SWOT

15.9 eBay Inc.

eBay Inc. - Overview
eBay Inc. - Product / Service
eBay Inc. - Key offerings
SWOT

15.10 JD.com Inc.

JD.com Inc. - Overview
JD.com Inc. - Business segments
JD.com Inc. - Key offerings
JD.com Inc. - Segment focus
SWOT

15.11 Lowes Co. Inc.

Lowes Co. Inc. - Overview
Lowes Co. Inc. - Product / Service
Lowes Co. Inc. - Key news
Lowes Co. Inc. - Key offerings
SWOT

15.12 Macys Inc.

Macys Inc. - Overview
Macys Inc. - Product / Service
Macys Inc. - Key news
Macys Inc. - Key offerings
SWOT

15.13 Maplebear Inc.

Maplebear Inc. - Overview
Maplebear Inc. - Product / Service
Maplebear Inc. - Key offerings
SWOT

15.14 Target Corp.

Target Corp. - Overview
Target Corp. - Product / Service
Target Corp. - Key news
Target Corp. - Key offerings
SWOT

15.15 The Home Depot Inc.

The Home Depot Inc. - Overview
The Home Depot Inc. - Business segments
The Home Depot Inc. - Key offerings
The Home Depot Inc. - Segment focus
SWOT

15.16 The Kroger Co.

The Kroger Co. - Overview
The Kroger Co. - Product / Service
The Kroger Co. - Key news
The Kroger Co. - Key offerings
SWOT

15.17 Walmart Inc.

Walmart Inc. - Overview
Walmart Inc. - Business segments
Walmart Inc. - Key news
Walmart Inc. - Key offerings
Walmart Inc. - Segment focus
SWOT

15.18 Wayfair Inc.

Wayfair Inc. - Overview
Wayfair Inc. - Business segments
Wayfair Inc. - Key news
Wayfair Inc. - Key offerings
Wayfair Inc. - Segment focus
SWOT

16. Appendix

16.1 Scope of the report

Market definition
Objectives
Notes and caveats

16.2 Inclusions and exclusions checklist

Inclusions checklist
Exclusions checklist

16.3 Currency conversion rates for US$

16.4 Research methodology

16.5 Data procurement

Information sources

16.6 Data validation

16.7 Validation techniques employed for market sizing

16.8 Data synthesis

16.9 360 degree market analysis

16.10 List of abbreviations

Research Methodology

Technavio presents a detailed picture of the market by way of study, synthesis, and summation of data from multiple sources. The analysts have presented the various facets of the market with a particular focus on identifying the key industry influencers. The data thus presented is comprehensive, reliable, and the result of extensive research, both primary and secondary.

INFORMATION SOURCES

Primary sources

  • Manufacturers and suppliers
  • Channel partners
  • Industry experts
  • Strategic decision makers

Secondary sources

  • Industry journals and periodicals
  • Government data
  • Financial reports of key industry players
  • Historical data
  • Press releases

DATA ANALYSIS

Data Synthesis

  • Collation of data
  • Estimation of key figures
  • Analysis of derived insights

Data Validation

  • Triangulation with data models
  • Reference against proprietary databases
  • Corroboration with industry experts

REPORT WRITING

Qualitative

  • Market drivers
  • Market challenges
  • Market trends
  • Five forces analysis

Quantitative

  • Market size and forecast
  • Market segmentation
  • Geographical insights
  • Competitive landscape

Interested in this report?

Get your sample now to see our research methodology and insights!

Download Now

Frequently Asked Questions

Retail Media Networks market growth will increase by USD 18804.4 million during 2025-2029.

The Retail Media Networks market is expected to grow at a CAGR of 11.2% during 2025-2029.

Retail Media Networks market is segmented by Platform (Retailer owned networks, Third party networks) Type (Display ads, Sponsored products, Video ads, Others) End-user (Consumer packaged goods, Electronics and technology, Apparel and fashion, Grocery and food delivery, Others)

Albertsons Co. Inc, Alibaba Group Holding Ltd., Amazon.com Inc., Best Buy Co. Inc., Carrefour SA, CVS Health Corp., eBay Inc., JD.com Inc., Lowes Co. Inc., Macys Inc., Maplebear Inc., Target Corp., Tesco Plc, The Home Depot Inc., The Kroger Co., Walmart Inc., Wayfair Inc. are a few of the key vendors in the Retail Media Networks market.

North America will register the highest growth rate of 36.9% among the other regions. Therefore, the Retail Media Networks market in North America is expected to garner significant business opportunities for the vendors during the forecast period.

US, Canada, Mexico, Germany, UK, France, Italy, Spain, The Netherlands, China, Japan, India, Australia, South Korea, Indonesia, Saudi Arabia, UAE, South Africa, Turkey, Israel, Brazil, Argentina, Colombia

  • Proliferation of first-party data amidst third-party cookie depreciation is the driving factor this market.

The Retail Media Networks market vendors should focus on grabbing business opportunities from the Platform segment as it accounted for the largest market share in the base year.