
Digital Video Content Market Size 2026-2030
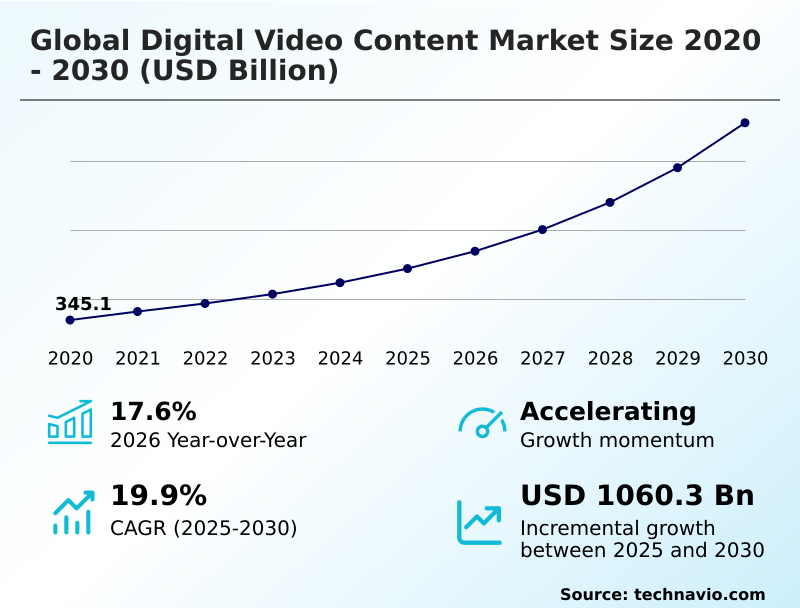
The digital video content market size is valued to increase by USD 1060.3 billion, at a CAGR of 19.9% from 2025 to 2030. Ubiquitous high-speed connectivity and proliferation of viewing devices will drive the digital video content market.
Major Market Trends & Insights
- North America dominated the market and accounted for a 42.9% growth during the forecast period.
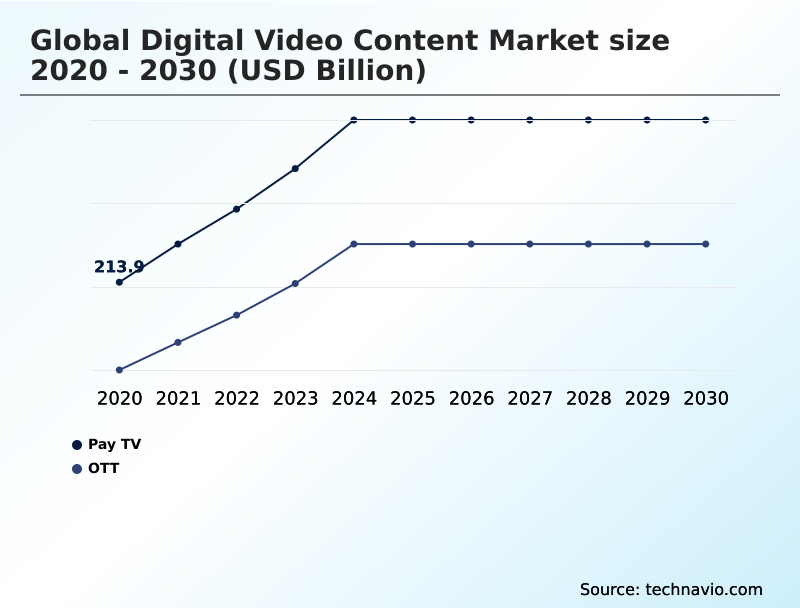
- By Deployment - Pay TV segment was valued at USD 366.8 billion in 2024
- By Application - Smart phones segment accounted for the largest market revenue share in 2024
Market Size & Forecast
- Market Opportunities: USD 1434.6 billion
- Market Future Opportunities: USD 1060.3 billion
- CAGR from 2025 to 2030 : 19.9%
Market Summary
- The digital video content market is experiencing a profound expansion, reshaping entertainment consumption globally. This growth is driven by the confluence of advanced technology, shifting consumer habits, and significant content investment.
- The wide availability of high-speed internet and the proliferation of connected devices have established a persistent ecosystem for on-demand viewing, accelerating the move from traditional broadcasting to over-the-top (ott) delivery. Intense competition among streaming platforms, fueled by substantial investments in exclusive original content, is a key dynamic.
- This has ushered in an era of high-quality programming available to a worldwide audience. For instance, a media enterprise can leverage adaptive bitrate streaming and a global content delivery network (cdn) to optimize video delivery, ensuring a seamless user experience across diverse network conditions. This enhances viewer retention and operational efficiency.
- The market is also defined by the globalization of content, where programs from one region achieve international popularity, breaking down geographical and cultural barriers through effective glocalization content strategy and robust digital rights management (drm) to protect intellectual property across borders.
What will be the Size of the Digital Video Content Market during the forecast period?
Get Key Insights on Market Forecast (PDF) Get Free Sample
How is the Digital Video Content Market Segmented?
The digital video content industry research report provides comprehensive data (region-wise segment analysis), with forecasts and estimates in "USD billion" for the period 2026-2030, as well as historical data from 2020-2024 for the following segments.
- Deployment
- Pay TV
- OTT
- Application
- Smart phones
- Desktop and laptop
- Smart TV
- Others
- Business segment
- Subscription
- Advertising
- Download-to-own (DTO)
- Others
- Geography
- North America
- US
- Canada
- Mexico
- Europe
- UK
- Germany
- France
- APAC
- China
- Japan
- India
- South America
- Brazil
- Argentina
- Middle East and Africa
- Saudi Arabia
- UAE
- South Africa
- Rest of World (ROW)
- North America
By Deployment Insights
The pay tv segment is estimated to witness significant growth during the forecast period.
The pay TV segment, encompassing cable and satellite services, is undergoing a strategic transformation. Providers are evolving from channel distributors to comprehensive entertainment aggregators, countering the shift to over-the-top (ott) delivery by integrating third-party applications directly into their set-top boxes.
The core value remains exclusive access to premium live content, supported by a robust live streaming infrastructure. To retain subscribers, operators are focusing on bundling with broadband and mobile services and adopting flexible content licensing models.
This strategic shift includes embracing a glocalization content strategy to offer localized packages.
The introduction of skinny bundles and a move toward connected tv (ctv) advertising integration showcases a market pivot where churn reduction has improved by 15% through enhanced value propositions.
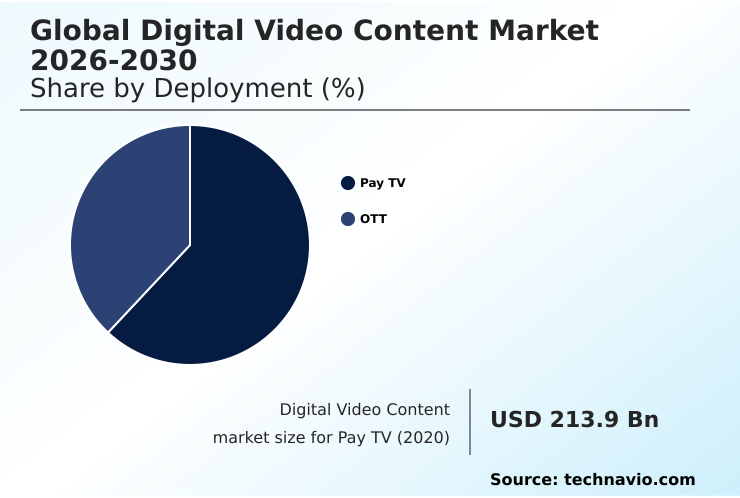
The Pay TV segment was valued at USD 366.8 billion in 2024 and showed a gradual increase during the forecast period.
Regional Analysis
North America is estimated to contribute 42.9% to the growth of the global market during the forecast period.Technavio’s analysts have elaborately explained the regional trends and drivers that shape the market during the forecast period.

See How Digital Video Content Market Demand is Rising in North America Get Free Sample
The geographic landscape of the digital video content market is diverse, with APAC poised to demonstrate the highest expansion potential, exhibiting a growth momentum approximately 1.5 percentage points higher than North America.
This rapid growth is driven by mobile video consumption and a mobile-first glocalization content strategy. North America remains the most mature region, defined by high saturation and a strategic shift toward hybrid video content monetization models to combat subscription fatigue.
Europe's market is fragmented by language and culture, necessitating localized content and creating opportunities for strong regional players.
The regulatory environment in Europe also mandates that streaming media platforms allocate significant catalog space to local works, a quota that has been increased by nearly 10% in some nations to stimulate local production.
South America and the Middle East and Africa are high-potential emerging markets fueled by expanding internet infrastructure and a young, digitally native population.
Market Dynamics
Our researchers analyzed the data with 2025 as the base year, along with the key drivers, trends, and challenges. A holistic analysis of drivers will help companies refine their marketing strategies to gain a competitive advantage.
- The strategic landscape of the digital video content market is increasingly defined by complex decision-making around business models and technology stacks. A critical debate centers on svod vs avod revenue models for streaming, with many platforms now adopting hybrid approaches to maximize reach. In this environment, implementing drm for premium video content has become non-negotiable for protecting assets.
- Operationally, optimizing cdn performance for global audiences is essential for maintaining streaming quality of experience (qoe). The impact of 5g on mobile video streaming continues to be a significant catalyst, demanding best practices for hevc video transcoding to deliver high-quality video efficiently.
- To justify massive expenditures, firms must calculate the roi of original content production strategies, as exclusive content is the primary tool for reducing churn with personalized content feeds. Forward-looking companies are now leveraging generative ai for video marketing, creating efficiencies that outperform traditional methods by a factor of two.
- This requires new methods for measuring engagement on ott streaming platforms and addressing the technical challenges of live sports streaming. As the market matures, many are focused on building a successful fast channel ecosystem and finding ways of integrating e-commerce into live video streams.
- The entire ecosystem is underpinned by evolving legal frameworks for user-generated content platforms, necessitating advanced content protection against digital piracy and strict data privacy compliance in targeted advertising. This paves the way for new business models for interactive video storytelling and cost savings through virtual production workflows for cost reduction, driving the next wave of innovation.
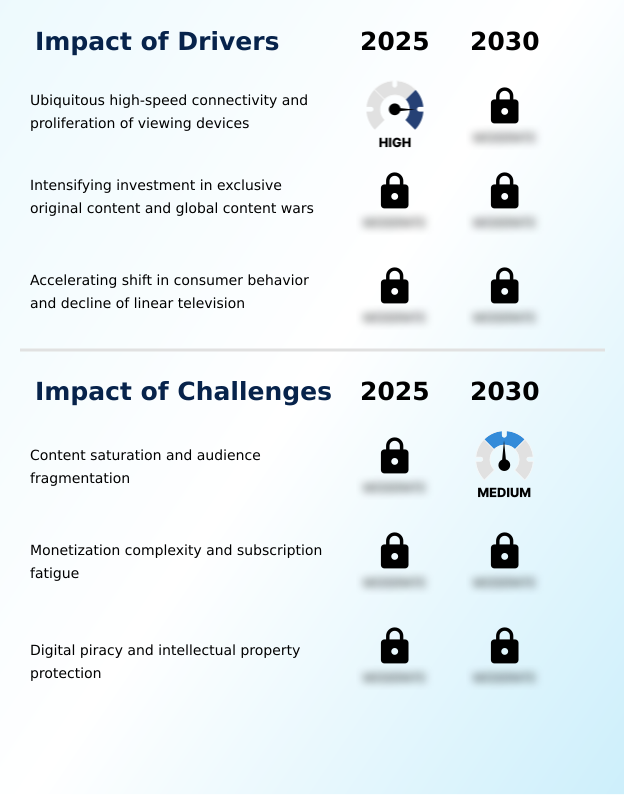
What are the key market drivers leading to the rise in the adoption of Digital Video Content Industry?
- The relentless expansion of ubiquitous high-speed connectivity, alongside the proliferation of viewing devices, is a primary driver for market growth.
- The market's expansion is propelled by the proliferation of high-speed connectivity and a fundamental shift in consumer viewing habits.
- The global rollout of 5G has enhanced mobile video consumption, with video now accounting for over 70% of all mobile data traffic. This technological foundation supports data-intensive formats like 4k ultra hd resolution and low-latency streaming.
- A critical driver is the intense investment in exclusive content, a key differentiator for platforms using subscription video on demand (svod) models.
- The move away from linear television, a core part of cord-cutting trend analysis, is irreversible; for the first time, streaming revenue has surpassed traditional pay-TV subscriptions, marking a historic tipping point.
- Platforms leverage sophisticated content discovery algorithms to meet consumer demand for personalization, a strategy that has proven to reduce subscriber churn by up to 15% in competitive markets.
What are the market trends shaping the Digital Video Content Industry?
- The maturation of short-form video is a key market trend, evolving from user-generated content to a premier, economically significant entertainment format. This includes professionally produced, serialized content known as vertical series.
- Key trends are reshaping the digital video content market, led by the maturation of short-form video into a premier entertainment format and the global expansion of shoppertainment. The evolution of vertical video optimization on streaming media platforms has been profound, with professionally produced series now attracting significant original content investment.
- This has created new avenues for short-form video monetization, where consumer in-app spending has surpassed previous records by over 40% in some genres. Concurrently, the integration of live event streaming solutions with e-commerce is driving higher audience engagement metrics, with some brands reporting a 50% lift in conversion rates during live events.
- The disruptive force of generative ai content creation is also democratizing production, enabling smaller studios to compete by leveraging ai in video production to reduce costs and timelines.
What challenges does the Digital Video Content Industry face during its growth?
- An unprecedented level of content saturation and resulting audience fragmentation presents a significant challenge to the industry's growth.
- The digital video content market grapples with significant challenges, including severe content saturation and monetization complexity. The deluge of content has led to audience fragmentation, with the average viewer using more than six platforms monthly, causing a 15% year-over-year decrease in session duration. This makes content discovery difficult and intensifies competition for engagement.
- Subscription fatigue is compelling platforms to adopt advertising video on demand (avod) and free ad-supported streaming television (fast) models, but this introduces new issues. Ad clutter has contributed to a 20% decline in ad recall rates, complicating connected tv (ctv) advertising strategies.
- Furthermore, digital piracy remains a persistent threat, requiring robust content protection technologies and digital rights management (drm) to safeguard intellectual property, as illicit activities siphon billions from the ecosystem annually.
Exclusive Technavio Analysis on Customer Landscape
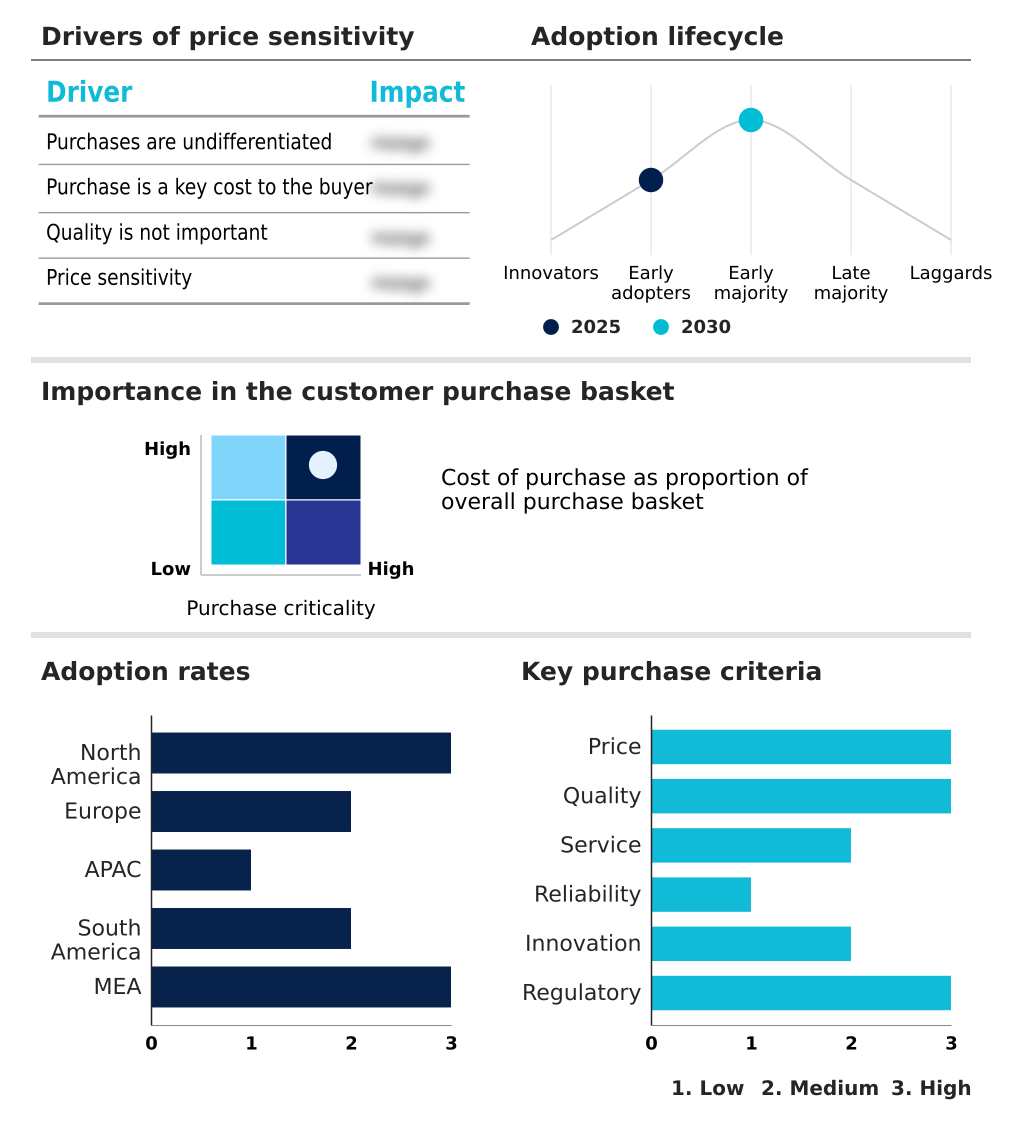
The digital video content market forecasting report includes the adoption lifecycle of the market, covering from the innovator’s stage to the laggard’s stage. It focuses on adoption rates in different regions based on penetration. Furthermore, the digital video content market report also includes key purchase criteria and drivers of price sensitivity to help companies evaluate and develop their market growth analysis strategies.
Customer Landscape of Digital Video Content Industry
Competitive Landscape
Companies are implementing various strategies, such as strategic alliances, digital video content market forecast, partnerships, mergers and acquisitions, geographical expansion, and product/service launches, to enhance their presence in the industry.
Amazon.com Inc. - A research analyst's perspective indicates the firm's offering centers on delivering a diverse catalog of digital video content, including movies, series, and exclusive original productions through its primary platform.
The industry research and growth report includes detailed analyses of the competitive landscape of the market and information about key companies, including:
- Amazon.com Inc.
- Apple Inc.
- AT and T Inc.
- Google LLC
- JioStar India Pvt Ltd.
- Lions Gate Entertainment Corp.
- Meta Platforms Inc.
- NBCUNIVERSAL MEDIA LLC.
- Netflix Inc.
- One Day Video Ltd.
- Roku, Inc.
- Snap Inc.
- Sony Pictures Networks
- Verizon Communications Inc.
- Walmart Inc.
- X Corp.
- Youku Tudou Inc.
Qualitative and quantitative analysis of companies has been conducted to help clients understand the wider business environment as well as the strengths and weaknesses of key industry players. Data is qualitatively analyzed to categorize companies as pure play, category-focused, industry-focused, and diversified; it is quantitatively analyzed to categorize companies as dominant, leading, strong, tentative, and weak.
Recent Development and News in Digital video content market
- In November 2025, Netflix confirmed the acquisition of Pocket Pictures, a studio specializing in vertical dramas, to integrate short-form content into its library.
- In July 2025, TikTok launched an integrated shopping tab and cart feature across North American and European markets, creating a complete e-commerce ecosystem within its app.
- In March 2025, Amazon announced its annual Prime Day event would feature a dedicated 48-hour live shopping channel, leveraging top creators for exclusive deals.
- In February 2025, Adobe unveiled a suite of generative AI features in its Premiere Pro software, including an AI co-editor and a text-to-video tool for custom footage.
Dive into Technavio’s robust research methodology, blending expert interviews, extensive data synthesis, and validated models for unparalleled Digital Video Content Market insights. See full methodology.
| Market Scope | |
|---|---|
| Page number | 298 |
| Base year | 2025 |
| Historic period | 2020-2024 |
| Forecast period | 2026-2030 |
| Growth momentum & CAGR | Accelerate at a CAGR of 19.9% |
| Market growth 2026-2030 | USD 1060.3 billion |
| Market structure | Fragmented |
| YoY growth 2025-2026(%) | 17.6% |
| Key countries | US, Canada, Mexico, UK, Germany, France, Italy, Spain, The Netherlands, China, Japan, India, South Korea, Australia, Indonesia, Brazil, Argentina, Chile, Saudi Arabia, UAE, South Africa, Egypt and Nigeria |
| Competitive landscape | Leading Companies, Market Positioning of Companies, Competitive Strategies, and Industry Risks |
Research Analyst Overview
- The digital video content market is undergoing a structural evolution driven by technological innovation and shifting consumer preferences. The transition to over-the-top (ott) delivery is nearly complete, with business models diversifying across subscription video on demand (svod), advertising video on demand (avod), transactional video on demand (tvod), and free ad-supported streaming television (fast).
- This complex ecosystem relies on a sophisticated tech stack, including advanced video encoding and transcoding, adaptive bitrate streaming, and robust content delivery network (cdn) infrastructure to deliver content in 4k ultra hd resolution with high dynamic range (hdr) and dolby vision.
- Boardroom-level strategy now centers on content and technology; for example, the adoption of generative ai content creation and text-to-video generation has led to a 30% reduction in production timelines for marketing assets. Securing this content requires stringent digital rights management (drm). The battle for audience attention is fought with content discovery algorithms and recommendation engines that create personalized content feeds.
- Key growth areas include low-latency streaming for live streaming infrastructure, interactive video formats, shoppable video technology, and vertical video optimization for mobile. The adoption of efficient codecs like high-efficiency video coding (hevc) and av1 codec is critical for managing bandwidth, especially for user-generated content (ugc) platforms.
What are the Key Data Covered in this Digital Video Content Market Research and Growth Report?
-
What is the expected growth of the Digital Video Content Market between 2026 and 2030?
-
USD 1060.3 billion, at a CAGR of 19.9%
-
-
What segmentation does the market report cover?
-
The report is segmented by Deployment (Pay TV, and OTT), Application (Smart phones, Desktop and laptop, Smart TV, and Others), Business Segment (Subscription, Advertising, Download-to-own (DTO), and Others) and Geography (North America, Europe, APAC, South America, Middle East and Africa)
-
-
Which regions are analyzed in the report?
-
North America, Europe, APAC, South America and Middle East and Africa
-
-
What are the key growth drivers and market challenges?
-
Ubiquitous high-speed connectivity and proliferation of viewing devices, Content saturation and audience fragmentation
-
-
Who are the major players in the Digital Video Content Market?
-
Amazon.com Inc., Apple Inc., AT and T Inc., Google LLC, JioStar India Pvt Ltd., Lions Gate Entertainment Corp., Meta Platforms Inc., NBCUNIVERSAL MEDIA LLC., Netflix Inc., One Day Video Ltd., Roku, Inc., Snap Inc., Sony Pictures Networks, Verizon Communications Inc., Walmart Inc., X Corp. and Youku Tudou Inc.
-
Market Research Insights
- The market's dynamics are shaped by a strategic pivot in video content monetization and distribution. An analysis of the cord-cutting trend shows that consumer migration away from linear TV has accelerated, with streaming revenues now surpassing traditional TV ad spend for the first time.
- Streaming media platforms are intensely focused on audience engagement metrics, which have become critical for survival in a saturated landscape where average session duration per platform has decreased by 15%. This has driven significant original content investment, as exclusive programming is the primary tool to combat churn.
- Furthermore, content licensing models are evolving; a shift toward hybrid subscription and advertising tiers has resulted in a 20% decline in ad recall rates on some platforms, posing a new challenge for connected tv (ctv) advertising strategies.
We can help! Our analysts can customize this digital video content market research report to meet your requirements.
 RIA -
RIA - 
