Retail Oil And Gas Logistics Market Analysis, Size, and Forecast 2026-2030: North America (US, Canada, and Mexico), Europe (Germany, UK, and France), APAC (China, India, and Japan), Middle East and Africa (Saudi Arabia, UAE, and South Africa), South America (Brazil and Argentina), and Rest of World (ROW)

Retail Oil And Gas Logistics Market Analysis, Size, and Forecast 2026-2030:
North America (US, Canada, and Mexico), Europe (Germany, UK, and France), APAC (China, India, and Japan), Middle East and Africa (Saudi Arabia, UAE, and South Africa), South America (Brazil and Argentina), and Rest of World (ROW)

Published: Jan 2026 301 Pages SKU: IRTNTR74039

Market Overview at a Glance

$1.46 B
Market Opportunity
7.5%
CAGR 2025 - 2030
38.6%
North America Growth
$1.81 B
Railroad transportation segment 2024

Retail Oil And Gas Logistics Market Size 2026-2030

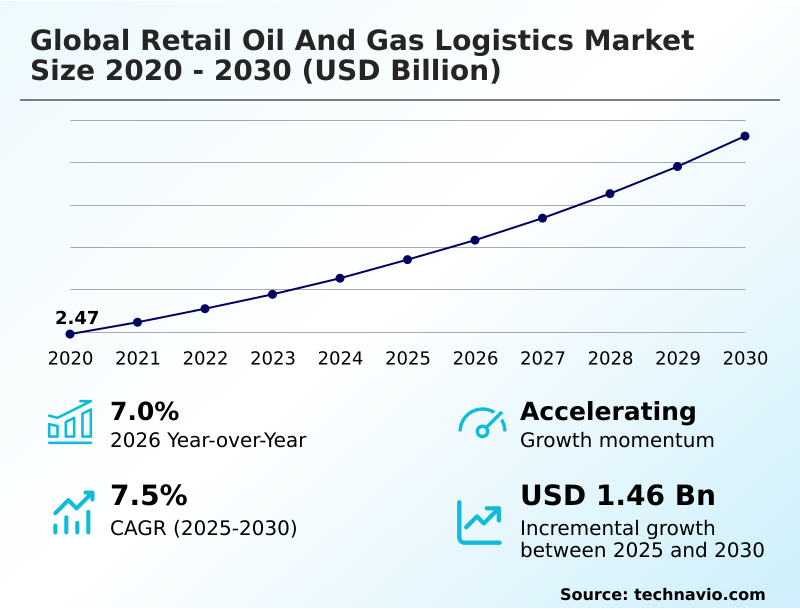
The retail oil and gas logistics market size is valued to increase by USD 1.46 billion, at a CAGR of 7.5% from 2025 to 2030. Increasing global energy demand will drive the retail oil and gas logistics market.

Major Market Trends & Insights

  • North America dominated the market and accounted for a 38.6% growth during the forecast period.
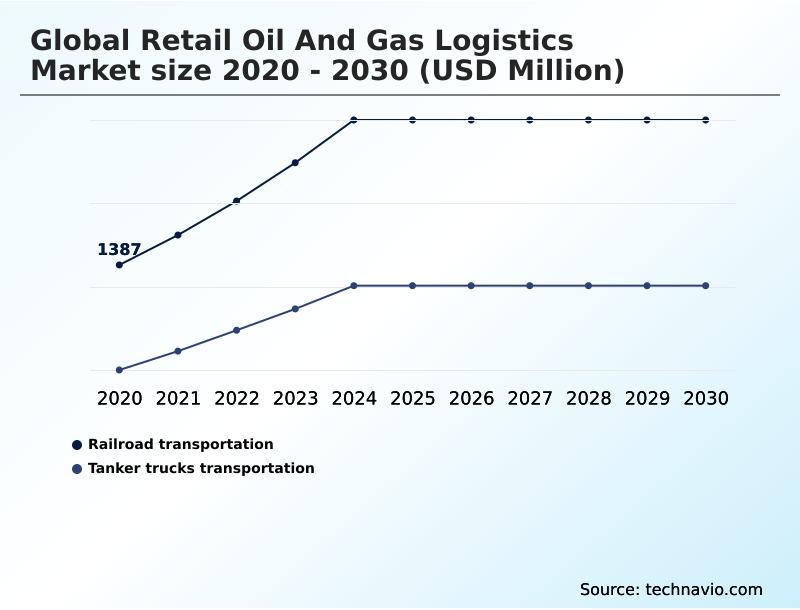
  • By Mode of Transportation - Railroad transportation segment was valued at USD 1.81 billion in 2024
  • By Service Type - Transportation segment accounted for the largest market revenue share in 2024

Market Size & Forecast

  • Market Opportunities: USD 2.34 billion
  • Market Future Opportunities: USD 1.46 billion
  • CAGR from 2025 to 2030 : 7.5%

Market Summary

  • The retail oil and gas logistics market is defined by the complex systems supporting the movement of refined petroleum products to retail endpoints. Success in this sector depends on achieving operational efficiency benchmarks through a combination of transport management systems (TMS) and advanced demand forecasting models.
  • A key business scenario involves optimizing last-mile fuel delivery to a network of urban and rural fueling stations during a regional supply disruption. Effective logistics service providers leverage real-time cargo tracking and dynamic route optimization to bypass infrastructure bottleneck analysis, ensuring fuel replenishment services continue uninterrupted.
  • This requires robust downstream oil and gas strategies, integrating telematics data analysis with predictive maintenance scheduling to maintain fleet readiness. Furthermore, managing freight rate management and adhering to stringent environmental compliance reporting are critical for profitability and market standing.
  • The ongoing digital transformation, including the adoption of IoT sensor networks and control tower solutions, is crucial for enhancing visibility and enabling data-driven decision-making, which ultimately strengthens the entire petroleum supply chain and supports sustained energy delivery.

What will be the Size of the Retail Oil And Gas Logistics Market during the forecast period?

Get Key Insights on Market Forecast (PDF) Request Free Sample

How is the Retail Oil And Gas Logistics Market Segmented?

The retail oil and gas logistics industry research report provides comprehensive data (region-wise segment analysis), with forecasts and estimates in "USD million" for the period 2026-2030, as well as historical data from 2020-2024 for the following segments.

  • Mode of transportation
    • Railroad transportation
    • Tanker trucks transportation
  • Service type
    • Transportation
    • Storage and warehousing
    • Others
  • Fuel type
    • Diesel
    • Gasoline
    • LPG
    • Jet fuel
    • Others
  • Geography
    • North America
      • US
      • Canada
      • Mexico
    • Europe
      • Germany
      • UK
      • France
    • APAC
      • China
      • India
      • Japan
    • Middle East and Africa
      • Saudi Arabia
      • UAE
      • South Africa
    • South America
      • Brazil
      • Argentina
    • Rest of World (ROW)

By Mode of Transportation Insights

The railroad transportation segment is estimated to witness significant growth during the forecast period.

Rail freight for petroleum plays a crucial role in the retail oil and gas logistics market, facilitating the bulk movement of refined fuels with enhanced safety and cost-effectiveness.

This mode is essential for connecting refineries and import terminals to large distribution depots that supply retail fuel outlets.

Recent enhancements to hazardous materials transport monitoring systems have improved real-time cargo tracking for fuel-laden railcars, strengthening incident prevention and aligning with green logistics initiatives.

By leveraging intermodal hub operations, rail logistics supports multimodal transport optimization, where tanker truck logistics handle last-mile fuel delivery.

Railroad transportation is pivotal for maintaining supply chain resilience metrics, especially in regions with extensive industrial corridors that depend on efficient downstream distribution networks for uninterrupted energy supply.

Request Free Sample

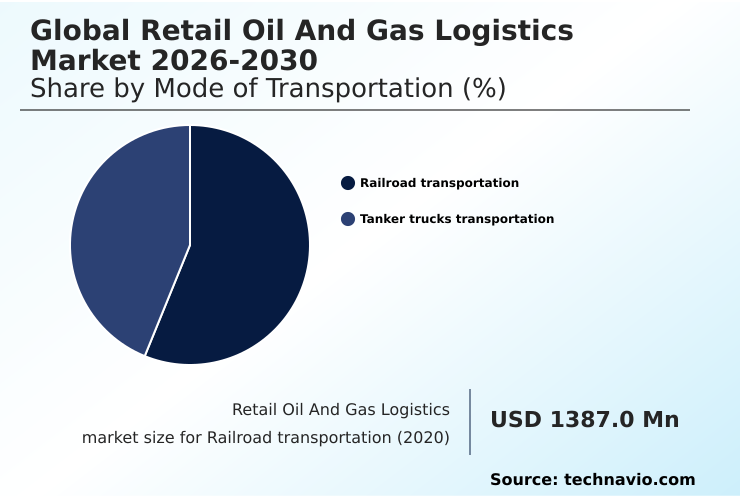
The Railroad transportation segment was valued at USD 1.81 billion in 2024 and showed a gradual increase during the forecast period.

Request Free Sample

Regional Analysis

North America is estimated to contribute 38.6% to the growth of the global market during the forecast period.Technavio’s analysts have elaborately explained the regional trends and drivers that shape the market during the forecast period.

See How Retail Oil And Gas Logistics Market Demand is Rising in North America Request Free Sample

The geographic landscape of the retail oil and gas logistics market is characterized by regional specialization and infrastructural maturity.

North America leverages its extensive pipeline network management for bulk fuel transport, while Europe focuses on regulatory compliance management and sustainable fuel verification.

In APAC, rapid industrialization drives demand for sophisticated inventory control systems and port congestion management, where automated solutions have reduced vessel turnaround times by 18%.

The Middle East and Africa serve as critical export hubs, emphasizing fuel theft mitigation and remote pipeline monitoring, with telematics data analysis improving asset security by over 25%.

These regional dynamics influence investments in terminal automation solutions and downstream distribution networks, shaping global supply chain resilience.

Market Dynamics

Our researchers analyzed the data with 2025 as the base year, along with the key drivers, trends, and challenges. A holistic analysis of drivers will help companies refine their marketing strategies to gain a competitive advantage.

  • Optimizing the retail oil and gas logistics market requires a multifaceted approach. Core to this is optimizing last-mile delivery for fuel retailers, which is increasingly dependent on AI-driven demand forecasting for gasoline and diesel. The impact of geopolitical volatility on fuel logistics necessitates strategies for supply chain resilience and proactive risk management.
  • Technologically, the role of digital twins in pipeline management is expanding, offering predictive insights that prevent disruptions. Concurrently, blockchain applications for fuel traceability are enhancing transparency and combating fraud, while real-time tracking for fuel theft prevention secures assets in transit. For fleet operators, managing tanker truck fleet for efficiency through telematics for enhancing driver safety is paramount.
  • Sustainable practices in retail fuel distribution are no longer optional, with a focus on reducing carbon footprint in fuel logistics and developing compliance strategies for biofuel transportation. This includes navigating the challenges in intermodal fuel transport and improving rail freight for bulk petroleum. The logistics infrastructure for emerging economies is a critical area for development.
  • Finally, firms conduct a cost-benefit analysis of green logistics and explore automation benefits in fuel terminals to secure long-term viability. Mastering these areas, from managing logistics for liquefied petroleum gas to navigating regulatory hurdles in fuel transport, is essential for competitive advantage.
  • Firms that can integrate a TMS with ERP for logistics effectively show up to 30% greater operational synergy than those with siloed systems.

What are the key market drivers leading to the rise in the adoption of Retail Oil And Gas Logistics Industry?

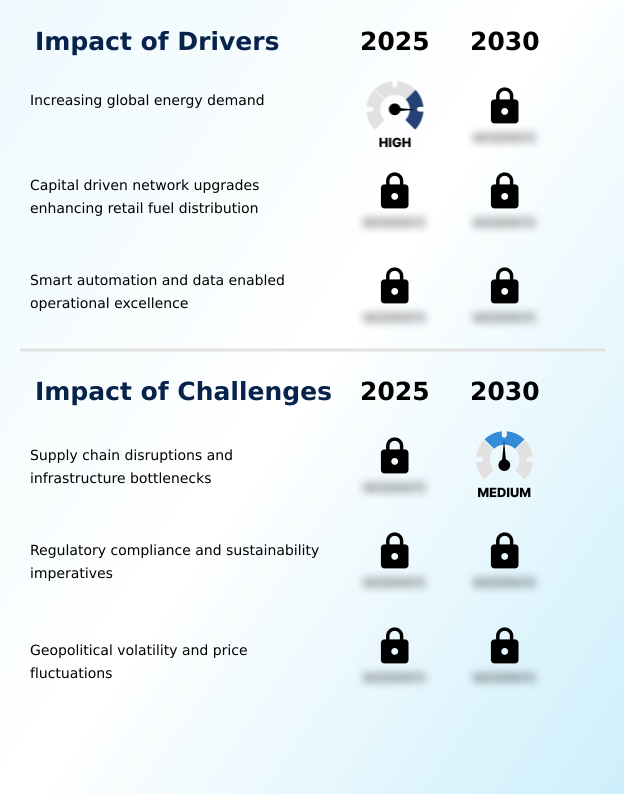
  • Increasing global energy demand is a key driver propelling market growth and necessitating the expansion of logistics infrastructure.

  • Increasing global energy demand is a significant driver, compelling investment in modernizing downstream oil and gas infrastructure.
  • To meet this demand efficiently, companies are adopting transport management systems (TMS) that integrate with enterprise resource planning (ERP) integration, which has been shown to boost asset utilization by 15%.
  • Smart automation and data-enabled systems are critical, with IoT sensor networks and telematics data analysis providing real-time insights for dynamic route optimization and predictive maintenance scheduling.
  • This focus on technology strengthens supply chain resilience, enabling better management of commodity price hedging.
  • These capital-driven upgrades are enhancing retail fuel distribution, ensuring that downstream distribution networks can handle increasing volumes while maintaining operational efficiency benchmarks and supporting just-in-time (JIT) inventory strategies.

What are the market trends shaping the Retail Oil And Gas Logistics Industry?

  • The adoption of sustainable and green logistics practices is an emerging market trend. This strategic shift is reshaping operational paradigms and influencing investment decisions across the industry.

  • A primary trend in the retail oil and gas logistics market is the push towards digital transformation, enhancing transparency and efficiency. The adoption of blockchain for supply chain traceability is gaining traction, with pilot programs demonstrating a 90% reduction in verification times for sustainable fuel verification.
  • Concurrently, hydrotreated vegetable oil (HVO) transport is becoming more common as companies pursue low-carbon fuel logistics. This shift is supported by predictive analytics platforms, which improve demand forecasting models and optimize inventory control systems. Logistics service providers are leveraging digital twin for logistics to simulate network changes, improving planning accuracy by up to 20%.
  • These green logistics initiatives are not just for compliance but are becoming a key competitive differentiator, reshaping downstream distribution networks and terminal automation solutions.

What challenges does the Retail Oil And Gas Logistics Industry face during its growth?

  • Supply chain disruptions and infrastructure bottlenecks present a key challenge affecting industry growth and operational stability.

  • Navigating supply chain disruptions and infrastructure bottleneck analysis remains a central challenge in the retail oil and gas logistics market. Geopolitical risk mitigation is a constant concern, with firms using control tower solutions to gain visibility and respond to events that can impact freight rate management.
  • Regulatory compliance management is increasingly complex, especially regarding emissions trading scheme compliance and biofuel blending compliance, where non-adherence can lead to significant penalties. Firms are using automated compliance documentation, which reduces reporting errors by over 30%. Furthermore, ensuring fleet utilization analytics are accurate is difficult amidst driver shortages and volatile demand.
  • The threat of fuel theft mitigation requires constant vigilance and investment in advanced asset tracking technology and security protocols to protect valuable refined product distribution.

Exclusive Technavio Analysis on Customer Landscape

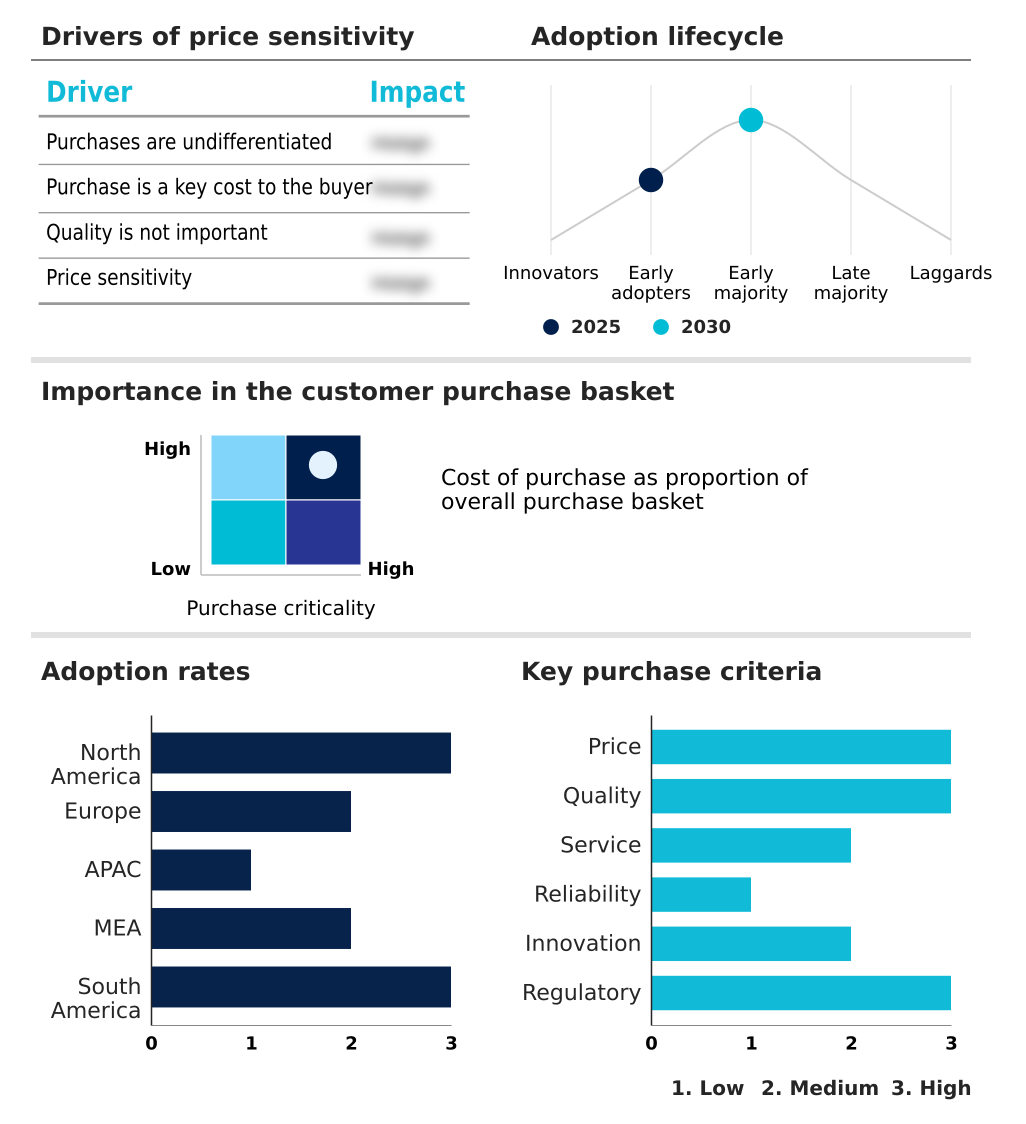
The retail oil and gas logistics market forecasting report includes the adoption lifecycle of the market, covering from the innovator’s stage to the laggard’s stage. It focuses on adoption rates in different regions based on penetration. Furthermore, the retail oil and gas logistics market report also includes key purchase criteria and drivers of price sensitivity to help companies evaluate and develop their market growth analysis strategies.

Customer Landscape of Retail Oil And Gas Logistics Industry

Competitive Landscape

Companies are implementing various strategies, such as strategic alliances, retail oil and gas logistics market forecast, partnerships, mergers and acquisitions, geographical expansion, and product/service launches, to enhance their presence in the industry.

ACI Cargo - Expertise spans multimodal freight forwarding, compliance-driven customs handling, and integrated distribution support for petroleum retail supply chains, ensuring efficient movement of refined products.

The industry research and growth report includes detailed analyses of the competitive landscape of the market and information about key companies, including:

  • ACI Cargo
  • Agility Public Warehousing Co.
  • ASCO Group
  • PSA BDP
  • Berrio Logistics India Pvt. Ltd.
  • Bollore SE
  • C H Robinson Worldwide Inc.
  • CEVA Logistics SA
  • DHL International GmbH
  • Expeditors International Inc.
  • GEODIS
  • Gulf Agency Co. Ltd.
  • Halcon Primo Logistics Pte Ltd.
  • Kuehne Nagel Management AG
  • Noatum Holdings SLU
  • Reliance Logistics Group Inc.
  • Riada Shipping and Logistics
  • Schenker AG
  • Tudor International Freight Ltd.
  • United Parcel Service Inc.

Qualitative and quantitative analysis of companies has been conducted to help clients understand the wider business environment as well as the strengths and weaknesses of key industry players. Data is qualitatively analyzed to categorize companies as pure play, category-focused, industry-focused, and diversified; it is quantitatively analyzed to categorize companies as dominant, leading, strong, tentative, and weak.

Recent Development and News in Retail oil and gas logistics market

  • In November 2024, Idemitsu Kosan commissioned a new blending plant in Malaysia, a development that improves regional supply capacity and logistics efficiency for compressor oils essential for oil and gas transport, streamlining distribution to retail and industrial users in APAC.
  • In December 2024, Siemens Energy and Baker Hughes introduced an advanced Siemens SGT-800 gas turbine at a Louisiana facility, integrating digital controls that enable remote diagnostics and efficiency optimizations in gas compression for logistics pipelines, improving throughput by 15%.
  • In February 2025, CMA CGM Group committed significant resources to sustainable logistics, focusing on alternative fuels and energy-efficient practices within its operations, including the deployment of low-emission vessels and electrified inland transport for fuel deliveries.
  • In May 2025, Marathon Petroleum announced a $300 million investment to upgrade its retail fuel logistics and distribution network across the Midwest, targeting enhanced pipeline and rail integrations and advanced telematics for fleet optimization.

Dive into Technavio’s robust research methodology, blending expert interviews, extensive data synthesis, and validated models for unparalleled Retail Oil And Gas Logistics Market insights. See full methodology.

Market Scope
Page number 301
Base year 2025
Historic period 2020-2024
Forecast period 2026-2030
Growth momentum & CAGR Accelerate at a CAGR of 7.5%
Market growth 2026-2030 USD 1460.0 million
Market structure Fragmented
YoY growth 2025-2026(%) 7.0%
Key countries US, Canada, Mexico, Germany, UK, France, Italy, Spain, The Netherlands, China, India, Japan, South Korea, Australia, Indonesia, Saudi Arabia, UAE, South Africa, Israel, Turkey, Brazil, Argentina and Chile
Competitive landscape Leading Companies, Market Positioning of Companies, Competitive Strategies, and Industry Risks

Request Free Sample

Research Analyst Overview

  • The retail oil and gas logistics market's evolution is driven by the convergence of digital innovation and stringent operational demands. Boardroom decisions now center on integrating advanced technologies to enhance supply chain resilience metrics. Core strategies involve multimodal transport optimization for bulk fuel transport and sophisticated tanker truck logistics for last-mile fuel delivery.
  • Success hinges on robust pipeline network management and efficient rail freight for petroleum. Companies are leveraging digital platforms for inventory control systems, powered by demand forecasting models and real-time cargo tracking. Dynamic route optimization and meticulous hazardous materials transport protocols are standard. Key differentiators include fuel integrity monitoring and comprehensive supply chain visibility platforms.
  • At the operational level, terminal automation solutions and automated loading racks are improving throughput, while digital twin for logistics allows for scenario planning. Fleet utilization analytics and predictive maintenance scheduling are crucial for managing operational efficiency benchmarks and costs.
  • The push for green logistics initiatives mandates compliance with biofuel blending compliance, sustainable fuel verification, and low-carbon fuel logistics, including hydrotreated vegetable oil (HVO) transport. Effective port congestion management, intermodal hub operations, and regulatory compliance management are critical.
  • The integration of transport management systems (TMS), enterprise resource planning (ERP) integration, IoT sensor networks, and blockchain for supply chain have collectively reduced documentation errors by over 40%.

What are the Key Data Covered in this Retail Oil And Gas Logistics Market Research and Growth Report?

  • What is the expected growth of the Retail Oil And Gas Logistics Market between 2026 and 2030?

    • USD 1.46 billion, at a CAGR of 7.5%

  • What segmentation does the market report cover?

    • The report is segmented by Mode of Transportation (Railroad transportation, and Tanker trucks transportation), Service Type (Transportation, Storage and warehousing, and Others), Fuel Type (Diesel, Gasoline, LPG, Jet fuel, and Others) and Geography (North America, Europe, APAC, Middle East and Africa, South America)

  • Which regions are analyzed in the report?

    • North America, Europe, APAC, Middle East and Africa and South America

  • What are the key growth drivers and market challenges?

    • Increasing global energy demand, Supply chain disruptions and infrastructure bottlenecks

  • Who are the major players in the Retail Oil And Gas Logistics Market?

    • ACI Cargo, Agility Public Warehousing Co., ASCO Group, PSA BDP, Berrio Logistics India Pvt. Ltd., Bollore SE, C H Robinson Worldwide Inc., CEVA Logistics SA, DHL International GmbH, Expeditors International Inc., GEODIS, Gulf Agency Co. Ltd., Halcon Primo Logistics Pte Ltd., Kuehne Nagel Management AG, Noatum Holdings SLU, Reliance Logistics Group Inc., Riada Shipping and Logistics, Schenker AG, Tudor International Freight Ltd. and United Parcel Service Inc.

Market Research Insights

  • The retail oil and gas logistics market is shaped by the imperative to balance cost, efficiency, and risk. Logistics service providers are achieving a 15% improvement in fleet efficiency by integrating automated dispatch systems with predictive routing software, which mitigates the impact of geopolitical risk mitigation.
  • Adoption of digital freight forwarding platforms has increased by over 25%, providing greater transparency in freight rate management and reducing reliance on manual processes. Furthermore, the implementation of remote pipeline monitoring and load verification systems has led to a 20% reduction in product loss incidents.
  • These advancements in asset tracking technology and automated compliance documentation allow for more resilient and responsive end-to-end logistics solutions, ensuring just-in-time inventory models can be reliably executed.

We can help! Our analysts can customize this retail oil and gas logistics market research report to meet your requirements.

Get in touch

1. Executive Summary

1.1 Market overview

Executive Summary - Chart on Market Overview
Executive Summary - Data Table on Market Overview
Executive Summary - Chart on Global Market Characteristics
Executive Summary - Chart on Market by Geography
Executive Summary - Chart on Market Segmentation by Mode of Transportation
Executive Summary - Chart on Market Segmentation by Service Type
Executive Summary - Chart on Market Segmentation by Fuel Type
Executive Summary - Chart on Incremental Growth
Executive Summary - Data Table on Incremental Growth
Executive Summary - Chart on Company Market Positioning

2. Technavio Analysis

2.1 Analysis of price sensitivity, lifecycle, customer purchase basket, adoption rates, and purchase criteria

2.2 Criticality of inputs and Factors of differentiation

Chart on Overview on criticality of inputs and factors of differentiation

2.3 Factors of disruption

Chart on Overview on factors of disruption

2.4 Impact of drivers and challenges

Chart on Impact of drivers and challenges in 2025 and 2030

3. Market Landscape

3.1 Market ecosystem

Chart on Parent Market
Data Table on - Parent Market

3.2 Market characteristics

Chart on Market characteristics analysis

3.3 Value chain analysis

Chart on Value chain analysis

4. Market Sizing

4.1 Market definition

Data Table on Offerings of companies included in the market definition

4.2 Market segment analysis

Market segments

4.3 Market size 2025

4.4 Market outlook: Forecast for 2025-2030

Chart on Global - Market size and forecast 2025-2030 ($ million)
Data Table on Global - Market size and forecast 2025-2030 ($ million)
Chart on Global Market: Year-over-year growth 2025-2030 (%)
Data Table on Global Market: Year-over-year growth 2025-2030 (%)

5. Historic Market Size

5.1 Global Retail Oil And Gas Logistics Market 2020 - 2024

Historic Market Size - Data Table on Global Retail Oil And Gas Logistics Market 2020 - 2024 ($ million)

5.2 Mode of Transportation segment analysis 2020 - 2024

Historic Market Size - Mode of Transportation Segment 2020 - 2024 ($ million)

5.3 Service Type segment analysis 2020 - 2024

Historic Market Size - Service Type Segment 2020 - 2024 ($ million)

5.4 Fuel Type segment analysis 2020 - 2024

Historic Market Size - Fuel Type Segment 2020 - 2024 ($ million)

5.5 Geography segment analysis 2020 - 2024

Historic Market Size - Geography Segment 2020 - 2024 ($ million)

5.6 Country segment analysis 2020 - 2024

Historic Market Size - Country Segment 2020 - 2024 ($ million)

6. Qualitative Analysis

6.1 Impact of AI in global retail oil and gas logistics market

7. Five Forces Analysis

7.1 Five forces summary

Five forces analysis - Comparison between 2025 and 2030

7.2 Bargaining power of buyers

Bargaining power of buyers - Impact of key factors 2025 and 2030

7.3 Bargaining power of suppliers

Bargaining power of suppliers - Impact of key factors in 2025 and 2030

7.4 Threat of new entrants

Threat of new entrants - Impact of key factors in 2025 and 2030

7.5 Threat of substitutes

Threat of substitutes - Impact of key factors in 2025 and 2030

7.6 Threat of rivalry

Threat of rivalry - Impact of key factors in 2025 and 2030

7.7 Market condition

Chart on Market condition - Five forces 2025 and 2030

8. Market Segmentation by Mode of Transportation

8.1 Market segments

Chart on Mode of Transportation - Market share 2025-2030 (%)
Data Table on Mode of Transportation - Market share 2025-2030 (%)

8.2 Comparison by Mode of Transportation

Chart on Comparison by Mode of Transportation
Data Table on Comparison by Mode of Transportation

8.3 Railroad transportation - Market size and forecast 2025-2030

Chart on Railroad transportation - Market size and forecast 2025-2030 ($ million)
Data Table on Railroad transportation - Market size and forecast 2025-2030 ($ million)
Chart on Railroad transportation - Year-over-year growth 2025-2030 (%)
Data Table on Railroad transportation - Year-over-year growth 2025-2030 (%)

8.4 Tanker trucks transportation - Market size and forecast 2025-2030

Chart on Tanker trucks transportation - Market size and forecast 2025-2030 ($ million)
Data Table on Tanker trucks transportation - Market size and forecast 2025-2030 ($ million)
Chart on Tanker trucks transportation - Year-over-year growth 2025-2030 (%)
Data Table on Tanker trucks transportation - Year-over-year growth 2025-2030 (%)

8.5 Market opportunity by Mode of Transportation

Market opportunity by Mode of Transportation ($ million)
Data Table on Market opportunity by Mode of Transportation ($ million)

9. Market Segmentation by Service Type

9.1 Market segments

Chart on Service Type - Market share 2025-2030 (%)
Data Table on Service Type - Market share 2025-2030 (%)

9.2 Comparison by Service Type

Chart on Comparison by Service Type
Data Table on Comparison by Service Type

9.3 Transportation - Market size and forecast 2025-2030

Chart on Transportation - Market size and forecast 2025-2030 ($ million)
Data Table on Transportation - Market size and forecast 2025-2030 ($ million)
Chart on Transportation - Year-over-year growth 2025-2030 (%)
Data Table on Transportation - Year-over-year growth 2025-2030 (%)

9.4 Storage and warehousing - Market size and forecast 2025-2030

Chart on Storage and warehousing - Market size and forecast 2025-2030 ($ million)
Data Table on Storage and warehousing - Market size and forecast 2025-2030 ($ million)
Chart on Storage and warehousing - Year-over-year growth 2025-2030 (%)
Data Table on Storage and warehousing - Year-over-year growth 2025-2030 (%)

9.5 Others - Market size and forecast 2025-2030

Chart on Others - Market size and forecast 2025-2030 ($ million)
Data Table on Others - Market size and forecast 2025-2030 ($ million)
Chart on Others - Year-over-year growth 2025-2030 (%)
Data Table on Others - Year-over-year growth 2025-2030 (%)

9.6 Market opportunity by Service Type

Market opportunity by Service Type ($ million)
Data Table on Market opportunity by Service Type ($ million)

10. Market Segmentation by Fuel Type

10.1 Market segments

Chart on Fuel Type - Market share 2025-2030 (%)
Data Table on Fuel Type - Market share 2025-2030 (%)

10.2 Comparison by Fuel Type

Chart on Comparison by Fuel Type
Data Table on Comparison by Fuel Type

10.3 Diesel - Market size and forecast 2025-2030

Chart on Diesel - Market size and forecast 2025-2030 ($ million)
Data Table on Diesel - Market size and forecast 2025-2030 ($ million)
Chart on Diesel - Year-over-year growth 2025-2030 (%)
Data Table on Diesel - Year-over-year growth 2025-2030 (%)

10.4 Gasoline - Market size and forecast 2025-2030

Chart on Gasoline - Market size and forecast 2025-2030 ($ million)
Data Table on Gasoline - Market size and forecast 2025-2030 ($ million)
Chart on Gasoline - Year-over-year growth 2025-2030 (%)
Data Table on Gasoline - Year-over-year growth 2025-2030 (%)

10.5 LPG - Market size and forecast 2025-2030

Chart on LPG - Market size and forecast 2025-2030 ($ million)
Data Table on LPG - Market size and forecast 2025-2030 ($ million)
Chart on LPG - Year-over-year growth 2025-2030 (%)
Data Table on LPG - Year-over-year growth 2025-2030 (%)

10.6 Jet fuel - Market size and forecast 2025-2030

Chart on Jet fuel - Market size and forecast 2025-2030 ($ million)
Data Table on Jet fuel - Market size and forecast 2025-2030 ($ million)
Chart on Jet fuel - Year-over-year growth 2025-2030 (%)
Data Table on Jet fuel - Year-over-year growth 2025-2030 (%)

10.7 Others - Market size and forecast 2025-2030

Chart on Others - Market size and forecast 2025-2030 ($ million)
Data Table on Others - Market size and forecast 2025-2030 ($ million)
Chart on Others - Year-over-year growth 2025-2030 (%)
Data Table on Others - Year-over-year growth 2025-2030 (%)

10.8 Market opportunity by Fuel Type

Market opportunity by Fuel Type ($ million)
Data Table on Market opportunity by Fuel Type ($ million)

11. Customer Landscape

11.1 Customer landscape overview

Analysis of price sensitivity, lifecycle, customer purchase basket, adoption rates, and purchase criteria

12. Geographic Landscape

12.1 Geographic segmentation

Chart on Market share by geography 2025-2030 (%)
Data Table on Market share by geography 2025-2030 (%)

12.2 Geographic comparison

Chart on Geographic comparison
Data Table on Geographic comparison

12.3 North America - Market size and forecast 2025-2030

Chart on North America - Market size and forecast 2025-2030 ($ million)
Data Table on North America - Market size and forecast 2025-2030 ($ million)
Chart on North America - Year-over-year growth 2025-2030 (%)
Data Table on North America - Year-over-year growth 2025-2030 (%)
Chart on Regional Comparison - North America
Data Table on Regional Comparison - North America

12.3.1 US - Market size and forecast 2025-2030

Chart on US - Market size and forecast 2025-2030 ($ million)
Data Table on US - Market size and forecast 2025-2030 ($ million)
Chart on US - Year-over-year growth 2025-2030 (%)
Data Table on US - Year-over-year growth 2025-2030 (%)

12.3.2 Canada - Market size and forecast 2025-2030

Chart on Canada - Market size and forecast 2025-2030 ($ million)
Data Table on Canada - Market size and forecast 2025-2030 ($ million)
Chart on Canada - Year-over-year growth 2025-2030 (%)
Data Table on Canada - Year-over-year growth 2025-2030 (%)

12.3.3 Mexico - Market size and forecast 2025-2030

Chart on Mexico - Market size and forecast 2025-2030 ($ million)
Data Table on Mexico - Market size and forecast 2025-2030 ($ million)
Chart on Mexico - Year-over-year growth 2025-2030 (%)
Data Table on Mexico - Year-over-year growth 2025-2030 (%)

12.4 Europe - Market size and forecast 2025-2030

Chart on Europe - Market size and forecast 2025-2030 ($ million)
Data Table on Europe - Market size and forecast 2025-2030 ($ million)
Chart on Europe - Year-over-year growth 2025-2030 (%)
Data Table on Europe - Year-over-year growth 2025-2030 (%)
Chart on Regional Comparison - Europe
Data Table on Regional Comparison - Europe

12.4.1 Germany - Market size and forecast 2025-2030

Chart on Germany - Market size and forecast 2025-2030 ($ million)
Data Table on Germany - Market size and forecast 2025-2030 ($ million)
Chart on Germany - Year-over-year growth 2025-2030 (%)
Data Table on Germany - Year-over-year growth 2025-2030 (%)

12.4.2 UK - Market size and forecast 2025-2030

Chart on UK - Market size and forecast 2025-2030 ($ million)
Data Table on UK - Market size and forecast 2025-2030 ($ million)
Chart on UK - Year-over-year growth 2025-2030 (%)
Data Table on UK - Year-over-year growth 2025-2030 (%)

12.4.3 France - Market size and forecast 2025-2030

Chart on France - Market size and forecast 2025-2030 ($ million)
Data Table on France - Market size and forecast 2025-2030 ($ million)
Chart on France - Year-over-year growth 2025-2030 (%)
Data Table on France - Year-over-year growth 2025-2030 (%)

12.4.4 Italy - Market size and forecast 2025-2030

Chart on Italy - Market size and forecast 2025-2030 ($ million)
Data Table on Italy - Market size and forecast 2025-2030 ($ million)
Chart on Italy - Year-over-year growth 2025-2030 (%)
Data Table on Italy - Year-over-year growth 2025-2030 (%)

12.4.5 Spain - Market size and forecast 2025-2030

Chart on Spain - Market size and forecast 2025-2030 ($ million)
Data Table on Spain - Market size and forecast 2025-2030 ($ million)
Chart on Spain - Year-over-year growth 2025-2030 (%)
Data Table on Spain - Year-over-year growth 2025-2030 (%)

12.4.6 The Netherlands - Market size and forecast 2025-2030

Chart on The Netherlands - Market size and forecast 2025-2030 ($ million)
Data Table on The Netherlands - Market size and forecast 2025-2030 ($ million)
Chart on The Netherlands - Year-over-year growth 2025-2030 (%)
Data Table on The Netherlands - Year-over-year growth 2025-2030 (%)

12.5 APAC - Market size and forecast 2025-2030

Chart on APAC - Market size and forecast 2025-2030 ($ million)
Data Table on APAC - Market size and forecast 2025-2030 ($ million)
Chart on APAC - Year-over-year growth 2025-2030 (%)
Data Table on APAC - Year-over-year growth 2025-2030 (%)
Chart on Regional Comparison - APAC
Data Table on Regional Comparison - APAC

12.5.1 China - Market size and forecast 2025-2030

Chart on China - Market size and forecast 2025-2030 ($ million)
Data Table on China - Market size and forecast 2025-2030 ($ million)
Chart on China - Year-over-year growth 2025-2030 (%)
Data Table on China - Year-over-year growth 2025-2030 (%)

12.5.2 India - Market size and forecast 2025-2030

Chart on India - Market size and forecast 2025-2030 ($ million)
Data Table on India - Market size and forecast 2025-2030 ($ million)
Chart on India - Year-over-year growth 2025-2030 (%)
Data Table on India - Year-over-year growth 2025-2030 (%)

12.5.3 Japan - Market size and forecast 2025-2030

Chart on Japan - Market size and forecast 2025-2030 ($ million)
Data Table on Japan - Market size and forecast 2025-2030 ($ million)
Chart on Japan - Year-over-year growth 2025-2030 (%)
Data Table on Japan - Year-over-year growth 2025-2030 (%)

12.5.4 South Korea - Market size and forecast 2025-2030

Chart on South Korea - Market size and forecast 2025-2030 ($ million)
Data Table on South Korea - Market size and forecast 2025-2030 ($ million)
Chart on South Korea - Year-over-year growth 2025-2030 (%)
Data Table on South Korea - Year-over-year growth 2025-2030 (%)

12.5.5 Australia - Market size and forecast 2025-2030

Chart on Australia - Market size and forecast 2025-2030 ($ million)
Data Table on Australia - Market size and forecast 2025-2030 ($ million)
Chart on Australia - Year-over-year growth 2025-2030 (%)
Data Table on Australia - Year-over-year growth 2025-2030 (%)

12.5.6 Indonesia - Market size and forecast 2025-2030

Chart on Indonesia - Market size and forecast 2025-2030 ($ million)
Data Table on Indonesia - Market size and forecast 2025-2030 ($ million)
Chart on Indonesia - Year-over-year growth 2025-2030 (%)
Data Table on Indonesia - Year-over-year growth 2025-2030 (%)

12.6 Middle East and Africa - Market size and forecast 2025-2030

Chart on Middle East and Africa - Market size and forecast 2025-2030 ($ million)
Data Table on Middle East and Africa - Market size and forecast 2025-2030 ($ million)
Chart on Middle East and Africa - Year-over-year growth 2025-2030 (%)
Data Table on Middle East and Africa - Year-over-year growth 2025-2030 (%)
Chart on Regional Comparison - Middle East and Africa
Data Table on Regional Comparison - Middle East and Africa

12.6.1 Saudi Arabia - Market size and forecast 2025-2030

Chart on Saudi Arabia - Market size and forecast 2025-2030 ($ million)
Data Table on Saudi Arabia - Market size and forecast 2025-2030 ($ million)
Chart on Saudi Arabia - Year-over-year growth 2025-2030 (%)
Data Table on Saudi Arabia - Year-over-year growth 2025-2030 (%)

12.6.2 UAE - Market size and forecast 2025-2030

Chart on UAE - Market size and forecast 2025-2030 ($ million)
Data Table on UAE - Market size and forecast 2025-2030 ($ million)
Chart on UAE - Year-over-year growth 2025-2030 (%)
Data Table on UAE - Year-over-year growth 2025-2030 (%)

12.6.3 South Africa - Market size and forecast 2025-2030

Chart on South Africa - Market size and forecast 2025-2030 ($ million)
Data Table on South Africa - Market size and forecast 2025-2030 ($ million)
Chart on South Africa - Year-over-year growth 2025-2030 (%)
Data Table on South Africa - Year-over-year growth 2025-2030 (%)

12.6.4 Israel - Market size and forecast 2025-2030

Chart on Israel - Market size and forecast 2025-2030 ($ million)
Data Table on Israel - Market size and forecast 2025-2030 ($ million)
Chart on Israel - Year-over-year growth 2025-2030 (%)
Data Table on Israel - Year-over-year growth 2025-2030 (%)

12.6.5 Turkey - Market size and forecast 2025-2030

Chart on Turkey - Market size and forecast 2025-2030 ($ million)
Data Table on Turkey - Market size and forecast 2025-2030 ($ million)
Chart on Turkey - Year-over-year growth 2025-2030 (%)
Data Table on Turkey - Year-over-year growth 2025-2030 (%)

12.7 South America - Market size and forecast 2025-2030

Chart on South America - Market size and forecast 2025-2030 ($ million)
Data Table on South America - Market size and forecast 2025-2030 ($ million)
Chart on South America - Year-over-year growth 2025-2030 (%)
Data Table on South America - Year-over-year growth 2025-2030 (%)
Chart on Regional Comparison - South America
Data Table on Regional Comparison - South America

12.7.1 Brazil - Market size and forecast 2025-2030

Chart on Brazil - Market size and forecast 2025-2030 ($ million)
Data Table on Brazil - Market size and forecast 2025-2030 ($ million)
Chart on Brazil - Year-over-year growth 2025-2030 (%)
Data Table on Brazil - Year-over-year growth 2025-2030 (%)

12.7.2 Argentina - Market size and forecast 2025-2030

Chart on Argentina - Market size and forecast 2025-2030 ($ million)
Data Table on Argentina - Market size and forecast 2025-2030 ($ million)
Chart on Argentina - Year-over-year growth 2025-2030 (%)
Data Table on Argentina - Year-over-year growth 2025-2030 (%)

12.7.3 Chile - Market size and forecast 2025-2030

Chart on Chile - Market size and forecast 2025-2030 ($ million)
Data Table on Chile - Market size and forecast 2025-2030 ($ million)
Chart on Chile - Year-over-year growth 2025-2030 (%)
Data Table on Chile - Year-over-year growth 2025-2030 (%)

12.8 Market opportunity by geography

Market opportunity by geography ($ million)
Data Tables on Market opportunity by geography ($ million)

13. Drivers, Challenges, and Opportunity

13.1 Market drivers

Increasing global energy demand
Capital driven network upgrades enhancing retail fuel distribution
Smart automation and data enabled operational excellence

13.2 Market challenges

Supply chain disruptions and infrastructure bottlenecks
Regulatory compliance and sustainability imperatives
Geopolitical volatility and price fluctuations

13.3 Impact of drivers and challenges

Impact of drivers and challenges in 2025 and 2030

13.4 Market opportunities

Adoption of sustainable and green logistics practices
Digital transformation and technological integration
Infrastructure modernization and expansion initiatives

14. Competitive Landscape

14.1 Overview

14.2

Overview on criticality of inputs and factors of differentiation

14.3 Landscape disruption

Overview on factors of disruption

14.4 Industry risks

Impact of key risks on business

15. Competitive Analysis

15.1 Companies profiled

Companies covered

15.2 Company ranking index

15.3 Market positioning of companies

Matrix on companies position and classification

15.4 ACI Cargo

ACI Cargo - Overview
ACI Cargo - Product / Service
ACI Cargo - Key offerings
SWOT

15.5 Agility Public Warehousing Co.

Agility Public Warehousing Co. - Overview
Agility Public Warehousing Co. - Business segments
Agility Public Warehousing Co. - Key offerings
Agility Public Warehousing Co. - Segment focus
SWOT

15.6 ASCO Group

ASCO Group - Overview
ASCO Group - Product / Service
ASCO Group - Key offerings
SWOT

15.7 PSA BDP

PSA BDP - Overview
PSA BDP - Product / Service
PSA BDP - Key offerings
SWOT

15.8 Bollore SE

Bollore SE - Overview
Bollore SE - Business segments
Bollore SE - Key offerings
Bollore SE - Segment focus
SWOT

15.9 C H Robinson Worldwide Inc.

C H Robinson Worldwide Inc. - Overview
C H Robinson Worldwide Inc. - Product / Service
C H Robinson Worldwide Inc. - Key news
C H Robinson Worldwide Inc. - Key offerings
SWOT

15.10 CEVA Logistics SA

CEVA Logistics SA - Overview
CEVA Logistics SA - Product / Service
CEVA Logistics SA - Key news
CEVA Logistics SA - Key offerings
SWOT

15.11 DHL International GmbH

DHL International GmbH - Overview
DHL International GmbH - Business segments
DHL International GmbH - Key news
DHL International GmbH - Key offerings
DHL International GmbH - Segment focus
SWOT

15.12 Expeditors International Inc.

Expeditors International Inc. - Overview
Expeditors International Inc. - Business segments
Expeditors International Inc. - Key offerings
Expeditors International Inc. - Segment focus
SWOT

15.13 GEODIS

GEODIS - Overview
GEODIS - Product / Service
GEODIS - Key offerings
SWOT

15.14 Gulf Agency Co. Ltd.

Gulf Agency Co. Ltd. - Overview
Gulf Agency Co. Ltd. - Product / Service
Gulf Agency Co. Ltd. - Key offerings
SWOT

15.15 Kuehne Nagel Management AG

Kuehne Nagel Management AG - Overview
Kuehne Nagel Management AG - Business segments
Kuehne Nagel Management AG - Key news
Kuehne Nagel Management AG - Key offerings
Kuehne Nagel Management AG - Segment focus
SWOT

15.16 Noatum Holdings SLU

Noatum Holdings SLU - Overview
Noatum Holdings SLU - Product / Service
Noatum Holdings SLU - Key offerings
SWOT

15.17 Schenker AG

Schenker AG - Overview
Schenker AG - Product / Service
Schenker AG - Key offerings
SWOT

15.18 United Parcel Service Inc.

United Parcel Service Inc. - Overview
United Parcel Service Inc. - Business segments
United Parcel Service Inc. - Key news
United Parcel Service Inc. - Key offerings
United Parcel Service Inc. - Segment focus
SWOT

16. Appendix

16.1 Scope of the report

Market definition
Objectives
Notes and caveats

16.2 Inclusions and exclusions checklist

Inclusions checklist
Exclusions checklist

16.3 Currency conversion rates for US$

16.4 Research methodology

16.5 Data procurement

Information sources

16.6 Data validation

16.7 Validation techniques employed for market sizing

16.8 Data synthesis

16.9 360 degree market analysis

16.10 List of abbreviations

Research Methodology

Technavio presents a detailed picture of the market by way of study, synthesis, and summation of data from multiple sources. The analysts have presented the various facets of the market with a particular focus on identifying the key industry influencers. The data thus presented is comprehensive, reliable, and the result of extensive research, both primary and secondary.

INFORMATION SOURCES

Primary sources

  • Manufacturers and suppliers
  • Channel partners
  • Industry experts
  • Strategic decision makers

Secondary sources

  • Industry journals and periodicals
  • Government data
  • Financial reports of key industry players
  • Historical data
  • Press releases

DATA ANALYSIS

Data Synthesis

  • Collation of data
  • Estimation of key figures
  • Analysis of derived insights

Data Validation

  • Triangulation with data models
  • Reference against proprietary databases
  • Corroboration with industry experts

REPORT WRITING

Qualitative

  • Market drivers
  • Market challenges
  • Market trends
  • Five forces analysis

Quantitative

  • Market size and forecast
  • Market segmentation
  • Geographical insights
  • Competitive landscape

Interested in this report?

Get your sample now to see our research methodology and insights!

Download Now

Frequently Asked Questions

Retail Oil And Gas Logistics market growth will increase by USD 1460.0 million during 2026-2030.

The Retail Oil And Gas Logistics market is expected to grow at a CAGR of 7.5% during 2026-2030.

Retail Oil And Gas Logistics market is segmented by Mode of transportation (Railroad transportation, Tanker trucks transportation) Service type (Transportation, Storage and warehousing, Others) Fuel type (Diesel, Gasoline, LPG, Jet fuel, Others)

ACI Cargo, Agility Public Warehousing Co., ASCO Group, PSA BDP, Berrio Logistics India Pvt. Ltd., Bollore SE, C H Robinson Worldwide Inc., CEVA Logistics SA, DHL International GmbH, Expeditors International Inc., GEODIS, Gulf Agency Co. Ltd., Halcon Primo Logistics Pte Ltd., Kuehne Nagel Management AG, Noatum Holdings SLU, Reliance Logistics Group Inc., Riada Shipping and Logistics, Schenker AG, Tudor International Freight Ltd., United Parcel Service Inc. are a few of the key vendors in the Retail Oil And Gas Logistics market.

North America will register the highest growth rate of 38.6% among the other regions. Therefore, the Retail Oil And Gas Logistics market in North America is expected to garner significant business opportunities for the vendors during the forecast period.

US, Canada, Mexico, Germany, UK, France, Italy, Spain, The Netherlands, China, India, Japan, South Korea, Australia, Indonesia, Saudi Arabia, UAE, South Africa, Israel, Turkey, Brazil, Argentina, Chile

  • Increasing global energy demand is the driving factor this market.

The Retail Oil And Gas Logistics market vendors should focus on grabbing business opportunities from the Mode of transportation segment as it accounted for the largest market share in the base year.