Reticulated Foam Market Size 2025-2029
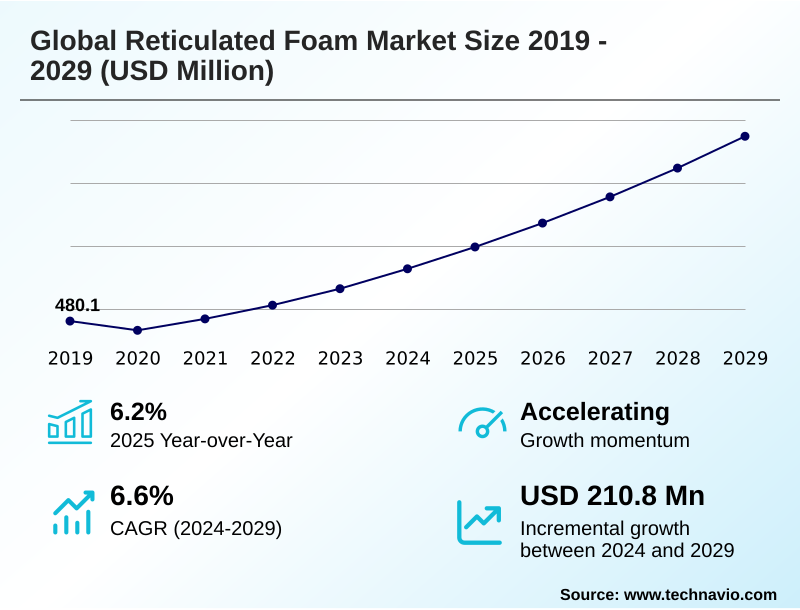
The reticulated foam market size is valued to increase by USD 210.8 million, at a CAGR of 6.6% from 2024 to 2029. Increasing demand for advanced filtration solutions will drive the reticulated foam market.
Major Market Trends & Insights
- APAC dominated the market and accounted for a 39.1% growth during the forecast period.
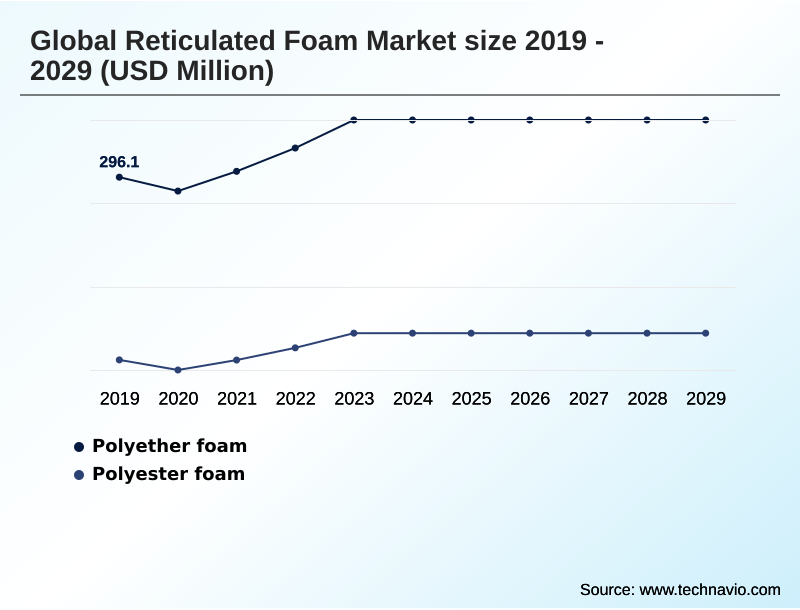
- By Type - Polyether foam segment was valued at USD 331.2 million in 2023
- By Application - Filtration segment accounted for the largest market revenue share in 2023
Market Size & Forecast
- Market Opportunities: USD 294 million
- Market Future Opportunities: USD 210.8 million
- CAGR from 2024 to 2029 : 6.6%
Market Summary
What will be the Size of the Reticulated Foam Market during the forecast period?
Get Key Insights on Market Forecast (PDF) Request Free Sample
How is the Reticulated Foam Market Segmented?
The reticulated foam industry research report provides comprehensive data (region-wise segment analysis), with forecasts and estimates in "USD million" for the period 2025-2029, as well as historical data from 2019-2023 for the following segments.
- Type
- Polyether foam
- Polyester foam
- Application
- Filtration
- Cushioning
- Sound absorption
- Fluid management
- Others
- End-user
- Automotive
- Furniture and bedding
- Construction
- Aerospace
- Others
- Geography
- APAC
- China
- Japan
- India
- North America
- US
- Canada
- Mexico
- Europe
- Germany
- France
- UK
- Middle East and Africa
- Saudi Arabia
- UAE
- South Africa
- South America
- Brazil
- Argentina
- Colombia
- Rest of World (ROW)
- APAC
By Type Insights
The polyether foam segment is estimated to witness significant growth during the forecast period.
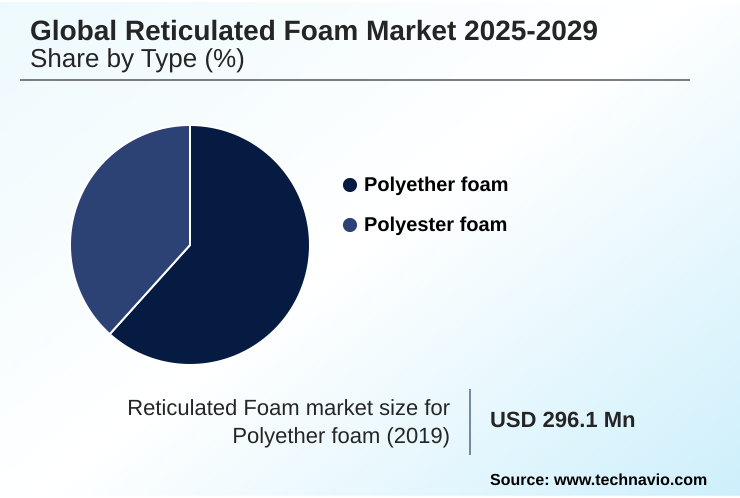
The Polyether foam segment was valued at USD 331.2 million in 2023 and showed a gradual increase during the forecast period.
Regional Analysis
APAC is estimated to contribute 39.1% to the growth of the global market during the forecast period.Technavio’s analysts have elaborately explained the regional trends and drivers that shape the market during the forecast period.
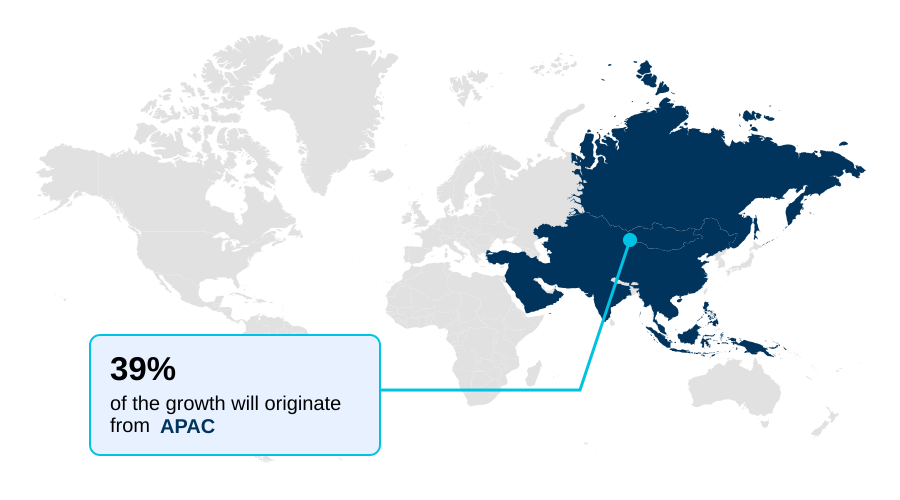
See How Reticulated Foam Market Demand is Rising in APAC Request Free Sample
Market Dynamics
Our researchers analyzed the data with 2024 as the base year, along with the key drivers, trends, and challenges. A holistic analysis of drivers will help companies refine their marketing strategies to gain a competitive advantage.
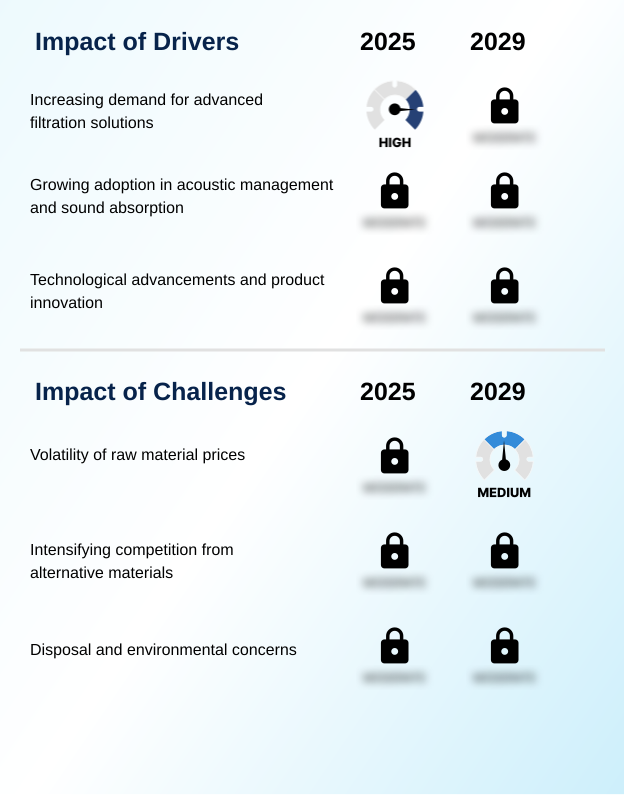
What are the key market drivers leading to the rise in the adoption of Reticulated Foam Industry?
What are the market trends shaping the Reticulated Foam Industry?
What challenges does the Reticulated Foam Industry face during its growth?
Exclusive Technavio Analysis on Customer Landscape
The reticulated foam market forecasting report includes the adoption lifecycle of the market, covering from the innovator’s stage to the laggard’s stage. It focuses on adoption rates in different regions based on penetration. Furthermore, the reticulated foam market report also includes key purchase criteria and drivers of price sensitivity to help companies evaluate and develop their market growth analysis strategies.
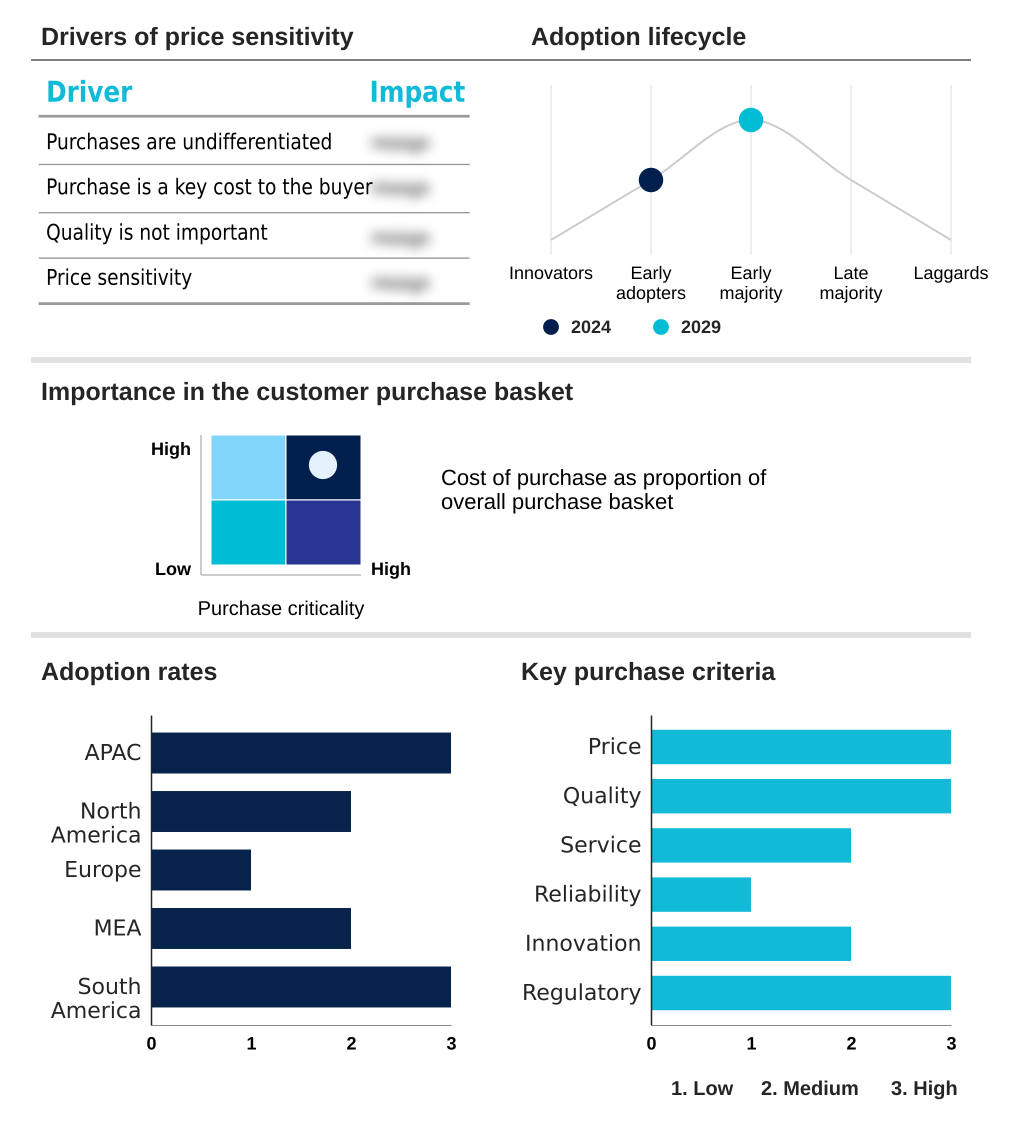
Customer Landscape of Reticulated Foam Industry
Competitive Landscape
Companies are implementing various strategies, such as strategic alliances, reticulated foam market forecast, partnerships, mergers and acquisitions, geographical expansion, and product/service launches, to enhance their presence in the industry.
American Foam Products Inc. -
The industry research and growth report includes detailed analyses of the competitive landscape of the market and information about key companies, including:
- American Foam Products Inc.
- Carpenter Co.
- Flextech Inc.
- Foamcraft Inc.
- Foamtech Wellington Ltd.
- FXI
- GB Foam Direct Ltd.
- Jiangsu Chengfeng Co. Ltd.
- Lamatek Inc.
- NEVEON Holding GmbH
- Polymer Technologies Inc.
- Rogers Foam Corp.
- Sheela Foam Ltd.
- Southern Filters (Dorset) Ltd.
- The Rubber Co. Ltd.
- W. Dimer GmbH
- Woodbridge Foam Corp.
- Worldwide Foam Ltd.
- Xinxiang filson filters Co. Ltd.
Qualitative and quantitative analysis of companies has been conducted to help clients understand the wider business environment as well as the strengths and weaknesses of key industry players. Data is qualitatively analyzed to categorize companies as pure play, category-focused, industry-focused, and diversified; it is quantitatively analyzed to categorize companies as dominant, leading, strong, tentative, and weak.
Recent Development and News in Reticulated foam market
Dive into Technavio’s robust research methodology, blending expert interviews, extensive data synthesis, and validated models for unparalleled Reticulated Foam Market insights. See full methodology.
| Market Scope | |
|---|---|
| Page number | 305 |
| Base year | 2024 |
| Historic period | 2019-2023 |
| Forecast period | 2025-2029 |
| Growth momentum & CAGR | Accelerate at a CAGR of 6.6% |
| Market growth 2025-2029 | USD 210.8 million |
| Market structure | Fragmented |
| YoY growth 2024-2025(%) | 6.2% |
| Key countries | China, Japan, India, South Korea, Australia, Indonesia, US, Canada, Mexico, Germany, France, UK, Italy, Spain, The Netherlands, Saudi Arabia, UAE, South Africa, Israel, Turkey, Brazil, Argentina and Colombia |
| Competitive landscape | Leading Companies, Market Positioning of Companies, Competitive Strategies, and Industry Risks |
Research Analyst Overview
What are the Key Data Covered in this Reticulated Foam Market Research and Growth Report?
-
What is the expected growth of the Reticulated Foam Market between 2025 and 2029?
-
USD 210.8 million, at a CAGR of 6.6%
-
-
What segmentation does the market report cover?
-
The report is segmented by Type (Polyether foam, and Polyester foam), Application (Filtration, Cushioning, Sound absorption, Fluid management, and Others), End-user (Automotive, Furniture and bedding, Construction, Aerospace, and Others) and Geography (APAC, North America, Europe, Middle East and Africa, South America)
-
-
Which regions are analyzed in the report?
-
APAC, North America, Europe, Middle East and Africa and South America
-
-
What are the key growth drivers and market challenges?
-
Increasing demand for advanced filtration solutions, Volatility of raw material prices
-
-
Who are the major players in the Reticulated Foam Market?
-
American Foam Products Inc., Carpenter Co., Flextech Inc., Foamcraft Inc., Foamtech Wellington Ltd., FXI, GB Foam Direct Ltd., Jiangsu Chengfeng Co. Ltd., Lamatek Inc., NEVEON Holding GmbH, Polymer Technologies Inc., Rogers Foam Corp., Sheela Foam Ltd., Southern Filters (Dorset) Ltd., The Rubber Co. Ltd., W. Dimer GmbH, Woodbridge Foam Corp., Worldwide Foam Ltd. and Xinxiang filson filters Co. Ltd.
-
Market Research Insights
We can help! Our analysts can customize this reticulated foam market research report to meet your requirements.
 RIA -
RIA - 
