Returnable Transport Packaging (RTP) Market Analysis, Size, and Forecast 2026-2030: North America (US, Canada, and Mexico), Europe (Germany, UK, and France), APAC (China, Japan, and India), Middle East and Africa (Saudi Arabia, UAE, and South Africa), South America (Brazil, Argentina, and Chile), and Rest of World (ROW)

Returnable Transport Packaging (RTP) Market Analysis, Size, and Forecast 2026-2030:
North America (US, Canada, and Mexico), Europe (Germany, UK, and France), APAC (China, Japan, and India), Middle East and Africa (Saudi Arabia, UAE, and South Africa), South America (Brazil, Argentina, and Chile), and Rest of World (ROW)

Published: May 2026 310 Pages SKU: IRTNTR70936

Market Overview at a Glance

$5.28 B
Market Opportunity
8.9%
CAGR 2025 - 2030
34.5%
North America Growth
$3.51 B
Containers segment 2024

Returnable Transport Packaging (Rtp) Market Size 2026-2030

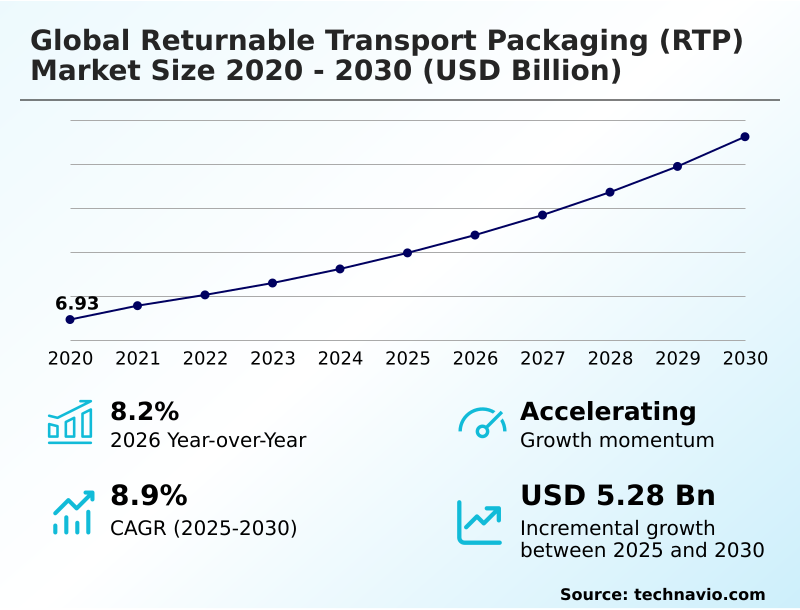
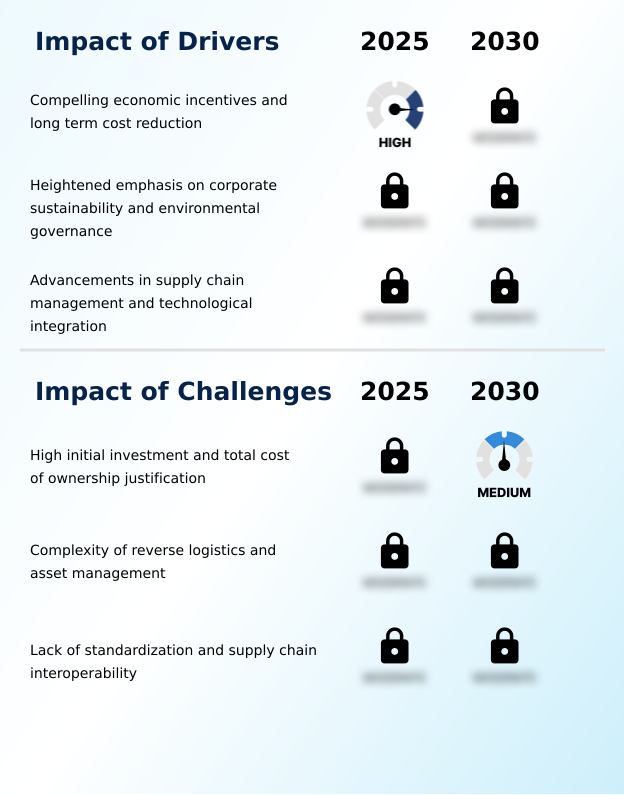
The returnable transport packaging (rtp) market size is valued to increase by USD 5.28 billion, at a CAGR of 8.9% from 2025 to 2030. Compelling economic incentives and long term cost reduction will drive the returnable transport packaging (rtp) market.

Major Market Trends & Insights

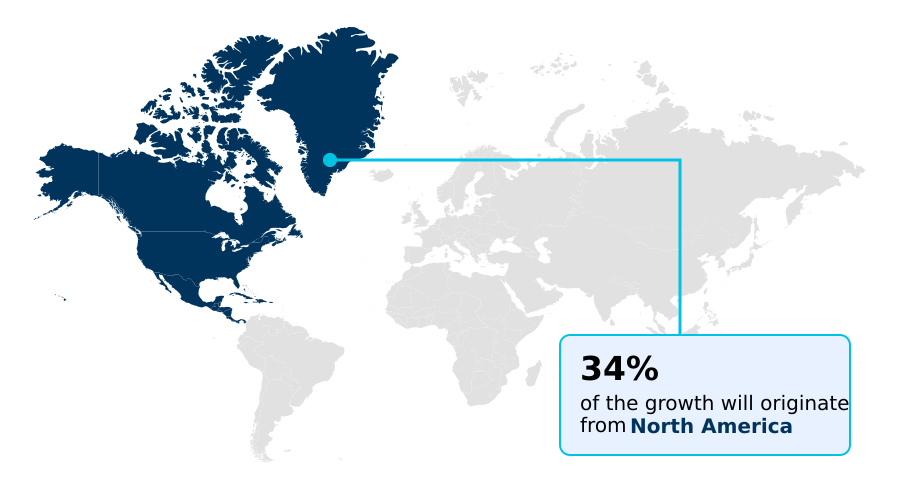
  • North America dominated the market and accounted for a 34.5% growth during the forecast period.
  • By Product - Containers segment was valued at USD 3.51 billion in 2024
  • By Material - Plastic segment accounted for the largest market revenue share in 2024

Market Size & Forecast

  • Market Opportunities: USD 8.31 billion
  • Market Future Opportunities: USD 5.28 billion
  • CAGR from 2025 to 2030 : 8.9%

Market Summary

  • The Returnable Transport Packaging (RTP) landscape demonstrates accelerating integration into high-velocity supply chains seeking long-term operational resilience. Organizations increasingly prioritize closed-loop supply chain models over expendable alternatives to optimize transit efficiency and carbon emission mitigation. For example, in large-scale automotive manufacturing, the deployment of customized protective dunnage eliminates recurring expenditure on disposable corrugated materials.
  • This strategic transition typically results in a 25% reduction in long-term transit damage costs, fundamentally altering operational budgets. A primary driver of this transition is the compelling economic incentive achieved through lower per-trip packaging expenses. Conversely, the high initial capital required to procure comprehensive shared pooling networks remains a persistent challenge, restricting rapid scaling.
  • By leveraging predictive maintenance analytics, logistics coordinators can minimize reverse logistics constraints, ensuring uninterrupted asset flow. Modern enterprises view these resilient packaging assets not merely as containers, but as vital capital investments driving overarching logistical optimization.

What will be the Size of the Returnable Transport Packaging (Rtp) Market during the forecast period?

Get Key Insights on Market Forecast (PDF) Get Free Sample

How is the Returnable Transport Packaging (Rtp) Market Segmented?

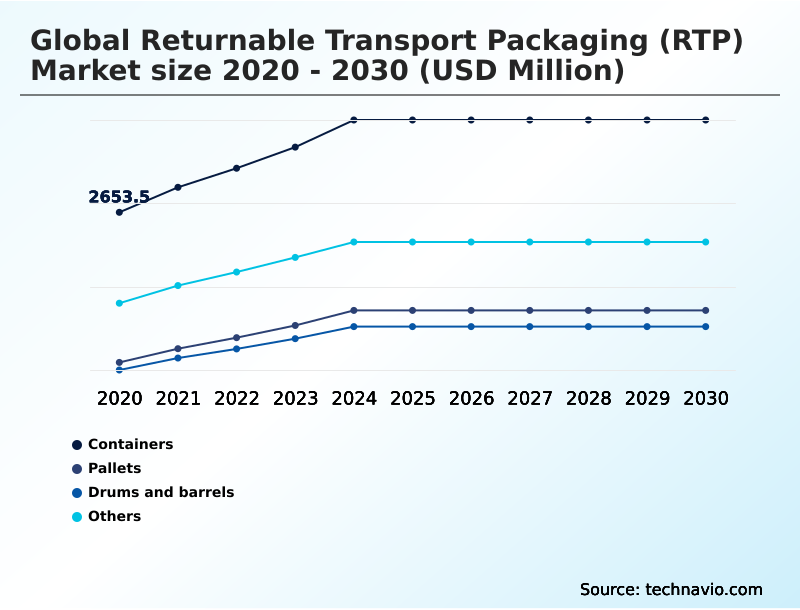
The returnable transport packaging (rtp) industry research report provides comprehensive data (region-wise segment analysis), with forecasts and estimates in "USD million" for the period 2026-2030, as well as historical data from 2020-2024 for the following segments.

  • Product
    • Containers
    • Pallets
    • Drums and barrels
    • Others
  • Material
    • Plastic
    • Wood
    • Metal
    • Others
  • End-user
    • Automotive
    • Food and beverage
    • Retail and e-commerce
    • Industrial
    • Pharmaceuticals
  • Geography
    • North America
      • US
      • Canada
      • Mexico
    • Europe
      • Germany
      • UK
      • France
      • Italy
      • Spain
      • The Netherlands
    • APAC
      • China
      • Japan
      • India
      • South Korea
      • Australia
      • Indonesia
    • Middle East and Africa
      • Saudi Arabia
      • UAE
      • South Africa
      • Turkey
      • Israel
    • South America
      • Brazil
      • Argentina
      • Chile

By Product Insights

The containers segment is estimated to witness significant growth during the forecast period.

The containers segment dictates the structural efficiency of the Returnable Transport Packaging (RTP) landscape, shifting the paradigm from disposable to highly resilient platforms. Businesses transitioning to polypropylene composite and injection molded plastic units experience substantial operational upgrades.

This transformation accelerates robotic handling compatibility across high-volume distribution centers, resulting in an 18% improvement in automated storage and retrieval throughput.

The integration of foldable large containers directly impacts warehouse density, allowing supply chains to maximize payload space optimization during reverse transit. Furthermore, customized protective dunnage within these containers guarantees product integrity during automotive component handling, dramatically reducing scrap rates.

By deploying these precision-engineered assets, organizations systematically lower their total cost of ownership while reinforcing continuous operational stability.

Get Free Sample

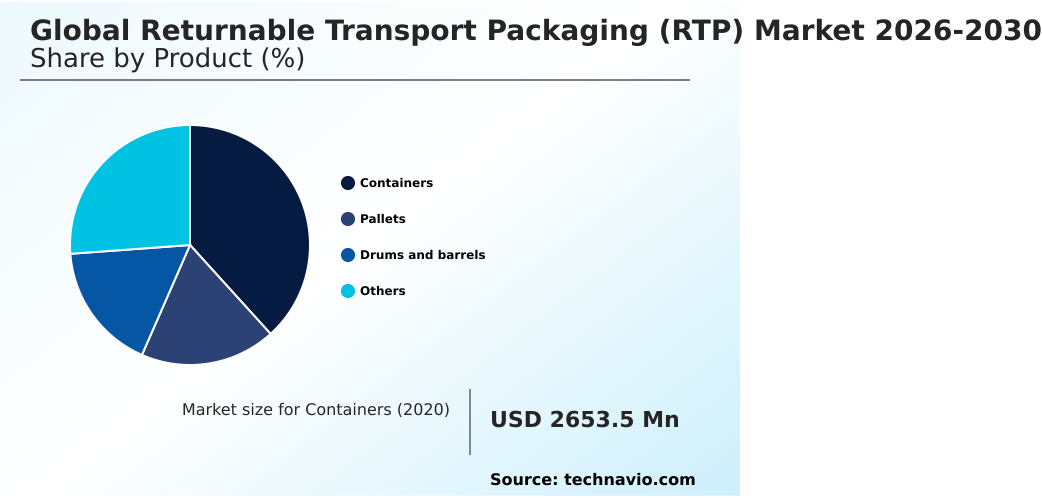
The Containers segment was valued at USD 3.51 billion in 2024 and showed a gradual increase during the forecast period.

Get Free Sample

Regional Analysis

North America is estimated to contribute 34.5% to the growth of the global market during the forecast period.Technavio’s analysts have elaborately explained the regional trends and drivers that shape the market during the forecast period.

See How Returnable Transport Packaging (Rtp) Market Demand is Rising in North America Get Free Sample

The geographic adoption of Returnable Transport Packaging (RTP) highlights distinct infrastructural maturity levels across key industrial hubs. North America demonstrates robust penetration of shared pooling networks, driven by intensive e-commerce fulfillment operations and stringent just-in-time manufacturing requirements.

Consequently, regional enterprises have achieved a 22% higher utilization rate of high-density polyethylene assets compared to counterparts in South America. In contrast, APAC experiences rapid infrastructure transformation propelled by expanding perishable goods transit.

Facilities in APAC exhibit a 35% improvement in transit reliability due to the deployment of advanced temperature-controlled shippers.

While North America prioritizes vacuum insulated panels and phase-change materials to secure cold chain integrity for critical pharmaceutical distribution networks, APAC focuses heavily on scaling basic reusable fleets to mitigate upfront capital constraints.

These divergent strategies underscore how distinct regional demands continuously dictate advanced packaging deployment.

Market Dynamics

Our researchers analyzed the data with 2025 as the base year, along with the key drivers, trends, and challenges. A holistic analysis of drivers will help companies refine their marketing strategies to gain a competitive advantage.

  • The continuous optimization of modern supply chains heavily depends on the strategic implementation of advanced Returnable Transport Packaging (RTP) solutions. A critical priority for high-tech manufacturers involves deploying custom molded anti static dunnage systems to safeguard sensitive electronic components against static discharge during transit.
  • This tailored approach drastically reduces defect rates by 15% compared to standard disposable packaging, driving immediate improvements in product yield and operational planning. Concurrently, the integration of smart tracking sensors for logistics containers provides operators with unparalleled visibility into asset location and condition, facilitating proactive inventory management and reducing the likelihood of asset loss.
  • In heavy industrial applications, operators increasingly rely on high impact resistant heavy duty pallets to withstand the rigorous demands of automated warehousing and prolonged reverse logistics cycles. These durable assets offer a significantly longer service life than traditional wooden alternatives, enabling a continuous and reliable flow of materials.
  • Furthermore, the retail sector has accelerated the adoption of closed loop retail distribution totes to streamline omni-channel fulfillment operations, thereby achieving a 20% higher density in payload space optimization. As regulatory scrutiny over product safety intensifies, the necessity for a verifiable audit trail for sensitive goods becomes paramount.
  • By merging robust physical assets with digital tracking capabilities, enterprises ensure continuous compliance, enhance overarching supply chain resilience, and systematically align their operations with stringent environmental and economic targets.

What are the key market drivers leading to the rise in the adoption of Returnable Transport Packaging (Rtp) Industry?

  • Compelling economic incentives and continuous long-term cost reductions serve as primary drivers for the industry.

  • The aggressive pursuit of continuous cost reduction operates as a primary catalyst accelerating Returnable Transport Packaging (RTP) adoption across global supply chains. Enterprises increasingly replace disposable materials with bio-based polymer resins to establish highly efficient zero-waste logistics frameworks.
  • This transition leverages robust load unitization platforms, eliminating recurring procurement expenditures and lowering long-term packaging operational costs by 30%. Furthermore, integrating automated high-speed conveyors ensures seamless material flow within a closed-loop supply chain.
  • This uniformity directly decreases automated machinery downtime by 25%, drastically enhancing distribution throughput. By committing to predictive maintenance analytics, corporate logistics divisions not only neutralize volatile single-use material expenses but also actively drive carbon emission mitigation.
  • This strategy fundamentally supports circular economy principles and environmental footprint reduction, ensuring strict alignment with modern extended producer responsibility mandates.

What are the market trends shaping the Returnable Transport Packaging (Rtp) Industry?

  • The proliferation of intelligent packaging and digitalization operates as a continuous market trend shaping the industry.

  • The Returnable Transport Packaging (RTP) landscape is rapidly evolving through the aggressive integration of intelligent tracking architectures into standard logistics assets. Supply chain operators are systematically embedding near-field communication tracking and radio-frequency identification tags into intermediate bulk containers to establish continuous asset oversight.
  • This technological shift leverages internet of things sensors and bluetooth low energy beacons to provide unprecedented smart asset visibility. Consequently, the utilization of these connected assets improves reverse logistics optimization by 18%, as managers gain precise data regarding return transit times. By integrating real-time condition monitoring, organizations eliminate manual auditing constraints and optimize packaging as a service models.
  • This digitalization, supported by dimensional standardization, fundamentally transforms passive storage units into proactive data nodes, ensuring a 25% reduction in container loss rates across high-velocity networks.

What challenges does the Returnable Transport Packaging (Rtp) Industry face during its growth?

  • High initial investments and complex total cost of ownership justifications represent significant challenges restricting operational adoption.

  • The inherent complexity of managing expansive reverse logistics networks presents a continuous structural barrier within the Returnable Transport Packaging (RTP) sector. Organizations struggle to maintain supply chain interoperability when balancing proprietary galvanized steel racks across diverse, multi-tiered supplier frameworks. This fragmentation occasionally decreases reverse flow consolidation efficiency by up to 20%.
  • Furthermore, the extensive administrative burden required to continuously inspect, sanitize, and redeploy cross-linked polyethylene foam materials escalates secondary labor expenses. Without sophisticated asset lifecycle management systems, companies face unpredictable asset shrinkage, which can inflate replacement capital expenditures by 15% annually. Managing hygienic sanitation compliance alongside strict electrostatic discharge protection requirements further complicates turnaround times.
  • Additionally, fluctuating availability of high-quality post-consumer resin disrupts production scaling, actively hindering seamless omni-channel distribution channels across fragmented industrial networks.

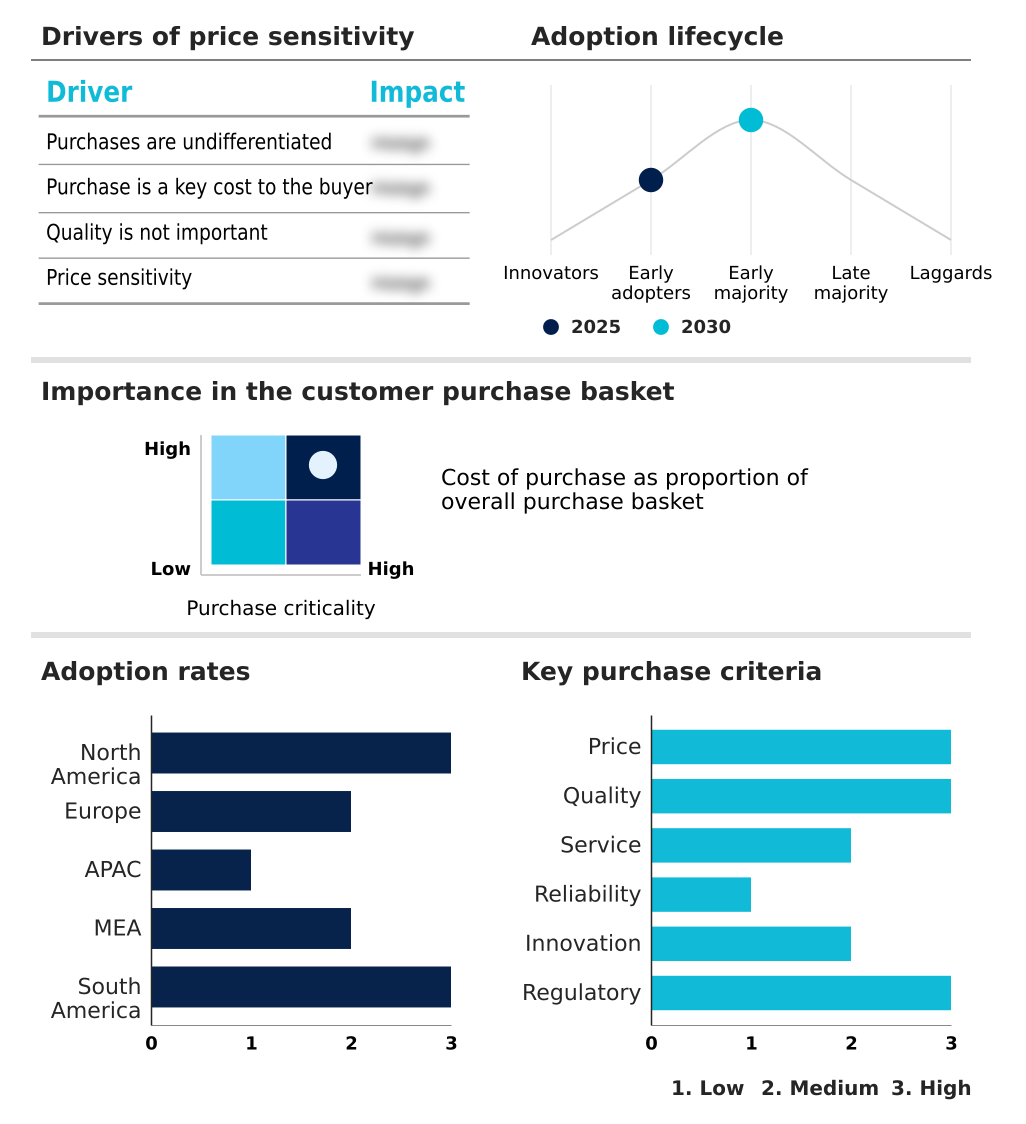
Exclusive Technavio Analysis on Customer Landscape

The returnable transport packaging (rtp) market forecasting report includes the adoption lifecycle of the market, covering from the innovator’s stage to the laggard’s stage. It focuses on adoption rates in different regions based on penetration. Furthermore, the returnable transport packaging (rtp) market report also includes key purchase criteria and drivers of price sensitivity to help companies evaluate and develop their market growth analysis strategies.

Customer Landscape of Returnable Transport Packaging (Rtp) Industry

Competitive Landscape

Companies are implementing various strategies, such as strategic alliances, returnable transport packaging (rtp) market forecast, partnerships, mergers and acquisitions, geographical expansion, and product/service launches, to enhance their presence in the industry.

bekuplast GmbH - The vendor delivers durable grid and material handling products alongside high-capacity storage infrastructure, optimizing continuous logistics operations and enhancing overarching supply chain efficiency through resilient structural solutions.

The industry research and growth report includes detailed analyses of the competitive landscape of the market and information about key companies, including:

  • bekuplast GmbH
  • CABKA Group GmbH
  • Craemer GmbH
  • DS Smith Plc
  • Georg Utz Holding AG
  • Greif Inc.
  • IFCO SYSTEMS GmbH
  • Menasha Corp
  • Myers Industries Inc.
  • NEFAB GROUP
  • ORBIS Corp.
  • Paxxal Inc
  • Rehrig Pacific Co.
  • Schoeller Allibert
  • Snyder Industries Inc.
  • Sonoco Products Co.
  • SSI Schafer IT Solutions GmbH
  • Tosca Services LLC
  • TranPak Inc.
  • Vetropack Group

Qualitative and quantitative analysis of companies has been conducted to help clients understand the wider business environment as well as the strengths and weaknesses of key industry players. Data is qualitatively analyzed to categorize companies as pure play, category-focused, industry-focused, and diversified; it is quantitatively analyzed to categorize companies as dominant, leading, strong, tentative, and weak.

Recent Development and News in Returnable transport packaging (rtp) market

  • In the Metal, Glass and Plastic Containers industry, the accelerated integration of smart asset visibility technologies into rigid industrial packaging enabled precise real-time condition monitoring, directly impacting Returnable Transport Packaging (RTP) demand by improving transit tracking accuracy by 25% across global supply networks.
  • In the Metal, Glass and Plastic Containers industry, strict hygienic sanitation compliance mandates for food-grade polymers forced manufacturers to re-engineer injection molded plastic assets, thereby pulling Returnable Transport Packaging (RTP) adoption up by 18% among perishable goods distributors.
  • In the Metal, Glass and Plastic Containers industry, the transition toward extended producer responsibility frameworks penalized single-use packaging producers, driving a 30% increase in the deployment of shared pooling networks within the Returnable Transport Packaging (RTP) ecosystem.
  • In the Metal, Glass and Plastic Containers industry, advancements in cross-linked polyethylene foam cushioning enhanced internal load unitization platforms, directly shaping Returnable Transport Packaging (RTP) demand by reducing automotive component transit damage by 15%.

Dive into Technavio’s robust research methodology, blending expert interviews, extensive data synthesis, and validated models for unparalleled Returnable Transport Packaging (Rtp) Market insights. See full methodology.

Market Scope
Page number 310
Base year 2025
Historic period 2020-2024
Forecast period 2026-2030
Growth momentum & CAGR Accelerate at a CAGR of 8.9%
Market growth 2026-2030 USD 5283.0 million
Market structure Fragmented
YoY growth 2025-2026(%) 8.2%
Key countries US, Canada, Mexico, Germany, UK, France, Italy, Spain, The Netherlands, China, Japan, India, South Korea, Australia, Indonesia, Saudi Arabia, UAE, South Africa, Turkey, Israel, Brazil, Argentina and Chile
Competitive landscape Leading Companies, Market Positioning of Companies, Competitive Strategies, and Industry Risks

Request Free Sample

Research Analyst Overview

  • The Returnable Transport Packaging (RTP) framework continuously redefines industrial logistics by transitioning operations toward highly resilient, data-driven closed-loop supply chain models. Organizations are increasingly deploying internet of things sensors to establish continuous oversight over moving assets. This digitalization strategy directly informs boardroom-level compliance and budgeting decisions, as real-time tracking mitigates inventory shrinkage.
  • By integrating vacuum insulated panels, pharmaceutical distributors secure critical cold chain integrity, resulting in a documented 28% reduction in temperature-related product spoilage. Advanced logistics coordinators utilize predictive maintenance analytics to proactively manage the lifecycle of intermediate bulk containers, preventing costly transit delays.
  • Furthermore, the strategic use of post-consumer resin in manufacturing these assets aligns directly with corporate sustainability mandates, systematically lowering the environmental footprint of expansive distribution networks. This convergence of durable materials and intelligent tracking architecture ensures that modern enterprises maintain continuous operational stability while strictly adhering to evolving regulatory frameworks.

What are the Key Data Covered in this Returnable Transport Packaging (Rtp) Market Research and Growth Report?

  • What is the expected growth of the Returnable Transport Packaging (Rtp) Market between 2026 and 2030?

    • USD 5.28 billion, at a CAGR of 8.9%

  • What segmentation does the market report cover?

    • The report is segmented by Product (Containers, Pallets, Drums and barrels, and Others), Material (Plastic, Wood, Metal, and Others), End-user (Automotive, Food and beverage, Retail and e-commerce, Industrial, and Pharmaceuticals) and Geography (North America, Europe, APAC, Middle East and Africa, South America)

  • Which regions are analyzed in the report?

    • North America, Europe, APAC, Middle East and Africa and South America

  • What are the key growth drivers and market challenges?

    • Compelling economic incentives and long term cost reduction, High initial investment and total cost of ownership justification

  • Who are the major players in the Returnable Transport Packaging (Rtp) Market?

    • bekuplast GmbH, CABKA Group GmbH, Craemer GmbH, DS Smith Plc, Georg Utz Holding AG, Greif Inc., IFCO SYSTEMS GmbH, Menasha Corp, Myers Industries Inc., NEFAB GROUP, ORBIS Corp., Paxxal Inc, Rehrig Pacific Co., Schoeller Allibert, Snyder Industries Inc., Sonoco Products Co., SSI Schafer IT Solutions GmbH, Tosca Services LLC, TranPak Inc. and Vetropack Group

Market Research Insights

  • The Returnable Transport Packaging (RTP) ecosystem fundamentally restructures modern logistics by prioritizing circular economy principles over linear disposal models. Companies adopting shared pooling networks report a 40% reduction in secondary packaging waste, simultaneously driving aggressive carbon emission mitigation strategies.
  • The implementation of smart asset visibility tools into transit assets accelerates cold chain integrity, resulting in a 15% decrease in perishable product spoilage during cross-border transit. These advanced systems enable precise real-time condition monitoring, ensuring continuous compliance with stringent international quality standards.
  • By prioritizing durable load unitization platforms, enterprises systematically lower reverse logistics constraints and enhance long-term operational profitability across complex distribution frameworks.

We can help! Our analysts can customize this returnable transport packaging (rtp) market research report to meet your requirements.

Get in touch

1. Executive Summary

1.1 Market overview

Executive Summary - Chart on Market Overview
Executive Summary - Data Table on Market Overview
Executive Summary - Chart on Global Market Characteristics
Executive Summary - Chart on Market by Geography
Executive Summary - Chart on Market Segmentation by Product
Executive Summary - Chart on Market Segmentation by Material
Executive Summary - Chart on Market Segmentation by End-user
Executive Summary - Chart on Incremental Growth
Executive Summary - Data Table on Incremental Growth
Executive Summary - Chart on Company Market Positioning

2. Technavio Analysis

2.1 Analysis of price sensitivity, lifecycle, customer purchase basket, adoption rates, and purchase criteria

2.2 Criticality of inputs and Factors of differentiation

Chart on Overview on criticality of inputs and factors of differentiation

2.3 Factors of disruption

Chart on Overview on factors of disruption

2.4 Impact of drivers and challenges

Chart on Impact of drivers and challenges in 2025 and 2030

3. Market Landscape

3.1 Market ecosystem

Chart on Parent Market
Data Table on - Parent Market

3.2 Market characteristics

Chart on Market characteristics analysis

3.3 Value chain analysis

Chart on Value chain analysis

4. Market Sizing

4.1 Market definition

Data Table on Offerings of companies included in the market definition

4.2 Market segment analysis

Market segments

4.3 Market size 2025

4.4 Market outlook: Forecast for 2025-2030

Chart on Global - Market size and forecast 2025-2030 ($ million)
Data Table on Global - Market size and forecast 2025-2030 ($ million)
Chart on Global Market: Year-over-year growth 2025-2030 (%)
Data Table on Global Market: Year-over-year growth 2025-2030 (%)

5. Historic Market Size

5.1 Global Returnable Transport Packaging (RTP) Market 2020 - 2024

Historic Market Size - Data Table on Global Returnable Transport Packaging (RTP) Market 2020 - 2024 ($ million)

5.2 Product segment analysis 2020 - 2024

Historic Market Size - Product Segment 2020 - 2024 ($ million)

5.3 Material segment analysis 2020 - 2024

Historic Market Size - Material Segment 2020 - 2024 ($ million)

5.4 End-user segment analysis 2020 - 2024

Historic Market Size - End-user Segment 2020 - 2024 ($ million)

5.5 Geography segment analysis 2020 - 2024

Historic Market Size - Geography Segment 2020 - 2024 ($ million)

5.6 Country segment analysis 2020 - 2024

Historic Market Size - Country Segment 2020 - 2024 ($ million)

6. Qualitative Analysis

6.1 Impact of AI on Global Returnable Transport Packaging (RTP) Market

6.2 Impact of Geopolitical Conflicts on Global Returnable Transport Packaging (RTP) Market

7. Five Forces Analysis

7.1 Five forces summary

Five forces analysis - Comparison between 2025 and 2030

7.2 Bargaining power of buyers

Bargaining power of buyers - Impact of key factors 2025 and 2030

7.3 Bargaining power of suppliers

Bargaining power of suppliers - Impact of key factors in 2025 and 2030

7.4 Threat of new entrants

Threat of new entrants - Impact of key factors in 2025 and 2030

7.5 Threat of substitutes

Threat of substitutes - Impact of key factors in 2025 and 2030

7.6 Threat of rivalry

Threat of rivalry - Impact of key factors in 2025 and 2030

7.7 Market condition

Chart on Market condition - Five forces 2025 and 2030

8. Market Segmentation by Product

8.1 Market segments

Chart on Product - Market share 2025-2030 (%)
Data Table on Product - Market share 2025-2030 (%)

8.2 Comparison by Product

Chart on Comparison by Product
Data Table on Comparison by Product

8.3 Containers - Market size and forecast 2025-2030

Chart on Containers - Market size and forecast 2025-2030 ($ million)
Data Table on Containers - Market size and forecast 2025-2030 ($ million)
Chart on Containers - Year-over-year growth 2025-2030 (%)
Data Table on Containers - Year-over-year growth 2025-2030 (%)

8.4 Pallets - Market size and forecast 2025-2030

Chart on Pallets - Market size and forecast 2025-2030 ($ million)
Data Table on Pallets - Market size and forecast 2025-2030 ($ million)
Chart on Pallets - Year-over-year growth 2025-2030 (%)
Data Table on Pallets - Year-over-year growth 2025-2030 (%)

8.5 Drums and barrels - Market size and forecast 2025-2030

Chart on Drums and barrels - Market size and forecast 2025-2030 ($ million)
Data Table on Drums and barrels - Market size and forecast 2025-2030 ($ million)
Chart on Drums and barrels - Year-over-year growth 2025-2030 (%)
Data Table on Drums and barrels - Year-over-year growth 2025-2030 (%)

8.6 Others - Market size and forecast 2025-2030

Chart on Others - Market size and forecast 2025-2030 ($ million)
Data Table on Others - Market size and forecast 2025-2030 ($ million)
Chart on Others - Year-over-year growth 2025-2030 (%)
Data Table on Others - Year-over-year growth 2025-2030 (%)

8.7 Market opportunity by Product

Market opportunity by Product ($ million)
Data Table on Market opportunity by Product ($ million)

9. Market Segmentation by Material

9.1 Market segments

Chart on Material - Market share 2025-2030 (%)
Data Table on Material - Market share 2025-2030 (%)

9.2 Comparison by Material

Chart on Comparison by Material
Data Table on Comparison by Material

9.3 Plastic - Market size and forecast 2025-2030

Chart on Plastic - Market size and forecast 2025-2030 ($ million)
Data Table on Plastic - Market size and forecast 2025-2030 ($ million)
Chart on Plastic - Year-over-year growth 2025-2030 (%)
Data Table on Plastic - Year-over-year growth 2025-2030 (%)

9.4 Wood - Market size and forecast 2025-2030

Chart on Wood - Market size and forecast 2025-2030 ($ million)
Data Table on Wood - Market size and forecast 2025-2030 ($ million)
Chart on Wood - Year-over-year growth 2025-2030 (%)
Data Table on Wood - Year-over-year growth 2025-2030 (%)

9.5 Metal - Market size and forecast 2025-2030

Chart on Metal - Market size and forecast 2025-2030 ($ million)
Data Table on Metal - Market size and forecast 2025-2030 ($ million)
Chart on Metal - Year-over-year growth 2025-2030 (%)
Data Table on Metal - Year-over-year growth 2025-2030 (%)

9.6 Others - Market size and forecast 2025-2030

Chart on Others - Market size and forecast 2025-2030 ($ million)
Data Table on Others - Market size and forecast 2025-2030 ($ million)
Chart on Others - Year-over-year growth 2025-2030 (%)
Data Table on Others - Year-over-year growth 2025-2030 (%)

9.7 Market opportunity by Material

Market opportunity by Material ($ million)
Data Table on Market opportunity by Material ($ million)

10. Market Segmentation by End-user

10.1 Market segments

Chart on End-user - Market share 2025-2030 (%)
Data Table on End-user - Market share 2025-2030 (%)

10.2 Comparison by End-user

Chart on Comparison by End-user
Data Table on Comparison by End-user

10.3 Automotive - Market size and forecast 2025-2030

Chart on Automotive - Market size and forecast 2025-2030 ($ million)
Data Table on Automotive - Market size and forecast 2025-2030 ($ million)
Chart on Automotive - Year-over-year growth 2025-2030 (%)
Data Table on Automotive - Year-over-year growth 2025-2030 (%)

10.4 Food and beverage - Market size and forecast 2025-2030

Chart on Food and beverage - Market size and forecast 2025-2030 ($ million)
Data Table on Food and beverage - Market size and forecast 2025-2030 ($ million)
Chart on Food and beverage - Year-over-year growth 2025-2030 (%)
Data Table on Food and beverage - Year-over-year growth 2025-2030 (%)

10.5 Retail and e-commerce - Market size and forecast 2025-2030

Chart on Retail and e-commerce - Market size and forecast 2025-2030 ($ million)
Data Table on Retail and e-commerce - Market size and forecast 2025-2030 ($ million)
Chart on Retail and e-commerce - Year-over-year growth 2025-2030 (%)
Data Table on Retail and e-commerce - Year-over-year growth 2025-2030 (%)

10.6 Industrial - Market size and forecast 2025-2030

Chart on Industrial - Market size and forecast 2025-2030 ($ million)
Data Table on Industrial - Market size and forecast 2025-2030 ($ million)
Chart on Industrial - Year-over-year growth 2025-2030 (%)
Data Table on Industrial - Year-over-year growth 2025-2030 (%)

10.7 Pharmaceuticals - Market size and forecast 2025-2030

Chart on Pharmaceuticals - Market size and forecast 2025-2030 ($ million)
Data Table on Pharmaceuticals - Market size and forecast 2025-2030 ($ million)
Chart on Pharmaceuticals - Year-over-year growth 2025-2030 (%)
Data Table on Pharmaceuticals - Year-over-year growth 2025-2030 (%)

10.8 Market opportunity by End-user

Market opportunity by End-user ($ million)
Data Table on Market opportunity by End-user ($ million)

11. Customer Landscape

11.1 Customer landscape overview

Analysis of price sensitivity, lifecycle, customer purchase basket, adoption rates, and purchase criteria

12. Geographic Landscape

12.1 Geographic segmentation

Chart on Market share by geography 2025-2030 (%)
Data Table on Market share by geography 2025-2030 (%)

12.2 Geographic comparison

Chart on Geographic comparison
Data Table on Geographic comparison

12.3 North America - Market size and forecast 2025-2030

Chart on North America - Market size and forecast 2025-2030 ($ million)
Data Table on North America - Market size and forecast 2025-2030 ($ million)
Chart on North America - Year-over-year growth 2025-2030 (%)
Data Table on North America - Year-over-year growth 2025-2030 (%)
Chart on Regional Comparison - North America
Data Table on Regional Comparison - North America

12.3.1 US - Market size and forecast 2025-2030

Chart on US - Market size and forecast 2025-2030 ($ million)
Data Table on US - Market size and forecast 2025-2030 ($ million)
Chart on US - Year-over-year growth 2025-2030 (%)
Data Table on US - Year-over-year growth 2025-2030 (%)

12.3.2 Canada - Market size and forecast 2025-2030

Chart on Canada - Market size and forecast 2025-2030 ($ million)
Data Table on Canada - Market size and forecast 2025-2030 ($ million)
Chart on Canada - Year-over-year growth 2025-2030 (%)
Data Table on Canada - Year-over-year growth 2025-2030 (%)

12.3.3 Mexico - Market size and forecast 2025-2030

Chart on Mexico - Market size and forecast 2025-2030 ($ million)
Data Table on Mexico - Market size and forecast 2025-2030 ($ million)
Chart on Mexico - Year-over-year growth 2025-2030 (%)
Data Table on Mexico - Year-over-year growth 2025-2030 (%)

12.4 Europe - Market size and forecast 2025-2030

Chart on Europe - Market size and forecast 2025-2030 ($ million)
Data Table on Europe - Market size and forecast 2025-2030 ($ million)
Chart on Europe - Year-over-year growth 2025-2030 (%)
Data Table on Europe - Year-over-year growth 2025-2030 (%)
Chart on Regional Comparison - Europe
Data Table on Regional Comparison - Europe

12.4.1 Germany - Market size and forecast 2025-2030

Chart on Germany - Market size and forecast 2025-2030 ($ million)
Data Table on Germany - Market size and forecast 2025-2030 ($ million)
Chart on Germany - Year-over-year growth 2025-2030 (%)
Data Table on Germany - Year-over-year growth 2025-2030 (%)

12.4.2 UK - Market size and forecast 2025-2030

Chart on UK - Market size and forecast 2025-2030 ($ million)
Data Table on UK - Market size and forecast 2025-2030 ($ million)
Chart on UK - Year-over-year growth 2025-2030 (%)
Data Table on UK - Year-over-year growth 2025-2030 (%)

12.4.3 France - Market size and forecast 2025-2030

Chart on France - Market size and forecast 2025-2030 ($ million)
Data Table on France - Market size and forecast 2025-2030 ($ million)
Chart on France - Year-over-year growth 2025-2030 (%)
Data Table on France - Year-over-year growth 2025-2030 (%)

12.4.4 Italy - Market size and forecast 2025-2030

Chart on Italy - Market size and forecast 2025-2030 ($ million)
Data Table on Italy - Market size and forecast 2025-2030 ($ million)
Chart on Italy - Year-over-year growth 2025-2030 (%)
Data Table on Italy - Year-over-year growth 2025-2030 (%)

12.4.5 Spain - Market size and forecast 2025-2030

Chart on Spain - Market size and forecast 2025-2030 ($ million)
Data Table on Spain - Market size and forecast 2025-2030 ($ million)
Chart on Spain - Year-over-year growth 2025-2030 (%)
Data Table on Spain - Year-over-year growth 2025-2030 (%)

12.4.6 The Netherlands - Market size and forecast 2025-2030

Chart on The Netherlands - Market size and forecast 2025-2030 ($ million)
Data Table on The Netherlands - Market size and forecast 2025-2030 ($ million)
Chart on The Netherlands - Year-over-year growth 2025-2030 (%)
Data Table on The Netherlands - Year-over-year growth 2025-2030 (%)

12.5 APAC - Market size and forecast 2025-2030

Chart on APAC - Market size and forecast 2025-2030 ($ million)
Data Table on APAC - Market size and forecast 2025-2030 ($ million)
Chart on APAC - Year-over-year growth 2025-2030 (%)
Data Table on APAC - Year-over-year growth 2025-2030 (%)
Chart on Regional Comparison - APAC
Data Table on Regional Comparison - APAC

12.5.1 China - Market size and forecast 2025-2030

Chart on China - Market size and forecast 2025-2030 ($ million)
Data Table on China - Market size and forecast 2025-2030 ($ million)
Chart on China - Year-over-year growth 2025-2030 (%)
Data Table on China - Year-over-year growth 2025-2030 (%)

12.5.2 Japan - Market size and forecast 2025-2030

Chart on Japan - Market size and forecast 2025-2030 ($ million)
Data Table on Japan - Market size and forecast 2025-2030 ($ million)
Chart on Japan - Year-over-year growth 2025-2030 (%)
Data Table on Japan - Year-over-year growth 2025-2030 (%)

12.5.3 India - Market size and forecast 2025-2030

Chart on India - Market size and forecast 2025-2030 ($ million)
Data Table on India - Market size and forecast 2025-2030 ($ million)
Chart on India - Year-over-year growth 2025-2030 (%)
Data Table on India - Year-over-year growth 2025-2030 (%)

12.5.4 South Korea - Market size and forecast 2025-2030

Chart on South Korea - Market size and forecast 2025-2030 ($ million)
Data Table on South Korea - Market size and forecast 2025-2030 ($ million)
Chart on South Korea - Year-over-year growth 2025-2030 (%)
Data Table on South Korea - Year-over-year growth 2025-2030 (%)

12.5.5 Australia - Market size and forecast 2025-2030

Chart on Australia - Market size and forecast 2025-2030 ($ million)
Data Table on Australia - Market size and forecast 2025-2030 ($ million)
Chart on Australia - Year-over-year growth 2025-2030 (%)
Data Table on Australia - Year-over-year growth 2025-2030 (%)

12.5.6 Indonesia - Market size and forecast 2025-2030

Chart on Indonesia - Market size and forecast 2025-2030 ($ million)
Data Table on Indonesia - Market size and forecast 2025-2030 ($ million)
Chart on Indonesia - Year-over-year growth 2025-2030 (%)
Data Table on Indonesia - Year-over-year growth 2025-2030 (%)

12.6 Middle East and Africa - Market size and forecast 2025-2030

Chart on Middle East and Africa - Market size and forecast 2025-2030 ($ million)
Data Table on Middle East and Africa - Market size and forecast 2025-2030 ($ million)
Chart on Middle East and Africa - Year-over-year growth 2025-2030 (%)
Data Table on Middle East and Africa - Year-over-year growth 2025-2030 (%)
Chart on Regional Comparison - Middle East and Africa
Data Table on Regional Comparison - Middle East and Africa

12.6.1 Saudi Arabia - Market size and forecast 2025-2030

Chart on Saudi Arabia - Market size and forecast 2025-2030 ($ million)
Data Table on Saudi Arabia - Market size and forecast 2025-2030 ($ million)
Chart on Saudi Arabia - Year-over-year growth 2025-2030 (%)
Data Table on Saudi Arabia - Year-over-year growth 2025-2030 (%)

12.6.2 UAE - Market size and forecast 2025-2030

Chart on UAE - Market size and forecast 2025-2030 ($ million)
Data Table on UAE - Market size and forecast 2025-2030 ($ million)
Chart on UAE - Year-over-year growth 2025-2030 (%)
Data Table on UAE - Year-over-year growth 2025-2030 (%)

12.6.3 South Africa - Market size and forecast 2025-2030

Chart on South Africa - Market size and forecast 2025-2030 ($ million)
Data Table on South Africa - Market size and forecast 2025-2030 ($ million)
Chart on South Africa - Year-over-year growth 2025-2030 (%)
Data Table on South Africa - Year-over-year growth 2025-2030 (%)

12.6.4 Turkey - Market size and forecast 2025-2030

Chart on Turkey - Market size and forecast 2025-2030 ($ million)
Data Table on Turkey - Market size and forecast 2025-2030 ($ million)
Chart on Turkey - Year-over-year growth 2025-2030 (%)
Data Table on Turkey - Year-over-year growth 2025-2030 (%)

12.6.5 Israel - Market size and forecast 2025-2030

Chart on Israel - Market size and forecast 2025-2030 ($ million)
Data Table on Israel - Market size and forecast 2025-2030 ($ million)
Chart on Israel - Year-over-year growth 2025-2030 (%)
Data Table on Israel - Year-over-year growth 2025-2030 (%)

12.7 South America - Market size and forecast 2025-2030

Chart on South America - Market size and forecast 2025-2030 ($ million)
Data Table on South America - Market size and forecast 2025-2030 ($ million)
Chart on South America - Year-over-year growth 2025-2030 (%)
Data Table on South America - Year-over-year growth 2025-2030 (%)
Chart on Regional Comparison - South America
Data Table on Regional Comparison - South America

12.7.1 Brazil - Market size and forecast 2025-2030

Chart on Brazil - Market size and forecast 2025-2030 ($ million)
Data Table on Brazil - Market size and forecast 2025-2030 ($ million)
Chart on Brazil - Year-over-year growth 2025-2030 (%)
Data Table on Brazil - Year-over-year growth 2025-2030 (%)

12.7.2 Argentina - Market size and forecast 2025-2030

Chart on Argentina - Market size and forecast 2025-2030 ($ million)
Data Table on Argentina - Market size and forecast 2025-2030 ($ million)
Chart on Argentina - Year-over-year growth 2025-2030 (%)
Data Table on Argentina - Year-over-year growth 2025-2030 (%)

12.7.3 Chile - Market size and forecast 2025-2030

Chart on Chile - Market size and forecast 2025-2030 ($ million)
Data Table on Chile - Market size and forecast 2025-2030 ($ million)
Chart on Chile - Year-over-year growth 2025-2030 (%)
Data Table on Chile - Year-over-year growth 2025-2030 (%)

12.8 Market opportunity by geography

Market opportunity by geography ($ million)
Data Tables on Market opportunity by geography ($ million)

13. Drivers, Challenges, and Opportunity

13.1 Market drivers

Compelling economic incentives and long term cost reduction
Heightened emphasis on corporate sustainability and environmental governance
Advancements in supply chain management and technological integration

13.2 Market challenges

High initial investment and total cost of ownership justification
Complexity of reverse logistics and asset management
Lack of standardization and supply chain interoperability

13.3 Impact of drivers and challenges

Impact of drivers and challenges in 2025 and 2030

13.4 Market opportunities

Proliferation of intelligent packaging and digitalization
Expansion of pooling systems and packaging as service models
Focus on advanced materials and enhanced design for circularity

14. Competitive Landscape

14.1 Overview

14.2

Overview on criticality of inputs and factors of differentiation

14.3 Landscape disruption

Overview on factors of disruption

14.4 Industry risks

Impact of key risks on business

15. Competitive Analysis

15.1 Companies profiled

Companies covered

15.2 Company ranking index

15.3 Market positioning of companies

Matrix on companies position and classification

15.4 bekuplast GmbH

bekuplast GmbH - Overview
bekuplast GmbH - Product / Service
bekuplast GmbH - Key offerings
SWOT

15.5 Craemer GmbH

Craemer GmbH - Overview
Craemer GmbH - Product / Service
Craemer GmbH - Key offerings
SWOT

15.6 DS Smith Plc

DS Smith Plc - Overview
DS Smith Plc - Product / Service
DS Smith Plc - Key news
DS Smith Plc - Key offerings
SWOT

15.7 Georg Utz Holding AG

Georg Utz Holding AG - Overview
Georg Utz Holding AG - Product / Service
Georg Utz Holding AG - Key offerings
SWOT

15.8 Greif Inc.

Greif Inc. - Overview
Greif Inc. - Business segments
Greif Inc. - Key news
Greif Inc. - Key offerings
Greif Inc. - Segment focus
SWOT

15.9 Menasha Corp

Menasha Corp - Overview
Menasha Corp - Product / Service
Menasha Corp - Key offerings
SWOT

15.10 Myers Industries Inc.

Myers Industries Inc. - Overview
Myers Industries Inc. - Business segments
Myers Industries Inc. - Key offerings
Myers Industries Inc. - Segment focus
SWOT

15.11 NEFAB GROUP

NEFAB GROUP - Overview
NEFAB GROUP - Product / Service
NEFAB GROUP - Key offerings
SWOT

15.12 Rehrig Pacific Co.

Rehrig Pacific Co. - Overview
Rehrig Pacific Co. - Product / Service
Rehrig Pacific Co. - Key offerings
SWOT

15.13 Schoeller Allibert

Schoeller Allibert - Overview
Schoeller Allibert - Product / Service
Schoeller Allibert - Key offerings
SWOT

15.14 Snyder Industries Inc.

Snyder Industries Inc. - Overview
Snyder Industries Inc. - Product / Service
Snyder Industries Inc. - Key offerings
SWOT

15.15 Sonoco Products Co.

Sonoco Products Co. - Overview
Sonoco Products Co. - Business segments
Sonoco Products Co. - Key offerings
Sonoco Products Co. - Segment focus
SWOT

15.16 SSI Schafer IT Solutions GmbH

SSI Schafer IT Solutions GmbH - Overview
SSI Schafer IT Solutions GmbH - Product / Service
SSI Schafer IT Solutions GmbH - Key offerings
SWOT

15.17 TranPak Inc.

TranPak Inc. - Overview
TranPak Inc. - Product / Service
TranPak Inc. - Key offerings
SWOT

15.18 Vetropack Group

Vetropack Group - Overview
Vetropack Group - Product / Service
Vetropack Group - Key offerings
SWOT

16. Appendix

16.1 Scope of the report

Market definition
Objectives
Notes and caveats

16.2 Inclusions and exclusions checklist

Inclusions checklist
Exclusions checklist

16.3 Currency conversion rates for US$

16.4 Research methodology

16.5 Data procurement

Information sources

16.6 Data validation

16.7 Validation techniques employed for market sizing

16.8 Data synthesis

16.9 360 degree market analysis

16.10 List of abbreviations

Research Methodology

Technavio presents a detailed picture of the market by way of study, synthesis, and summation of data from multiple sources. The analysts have presented the various facets of the market with a particular focus on identifying the key industry influencers. The data thus presented is comprehensive, reliable, and the result of extensive research, both primary and secondary.

INFORMATION SOURCES

Primary sources

  • Manufacturers and suppliers
  • Channel partners
  • Industry experts
  • Strategic decision makers

Secondary sources

  • Industry journals and periodicals
  • Government data
  • Financial reports of key industry players
  • Historical data
  • Press releases

DATA ANALYSIS

Data Synthesis

  • Collation of data
  • Estimation of key figures
  • Analysis of derived insights

Data Validation

  • Triangulation with data models
  • Reference against proprietary databases
  • Corroboration with industry experts

REPORT WRITING

Qualitative

  • Market drivers
  • Market challenges
  • Market trends
  • Five forces analysis

Quantitative

  • Market size and forecast
  • Market segmentation
  • Geographical insights
  • Competitive landscape

Interested in this report?

Get your sample now to see our research methodology and insights!

Download Now

Frequently Asked Questions

Returnable Transport Packaging (Rtp) market growth will increase by USD 5283.0 million during 2026-2030.

The Returnable Transport Packaging (Rtp) market is expected to grow at a CAGR of 8.9% during 2026-2030.

Returnable Transport Packaging (Rtp) market is segmented by Product (Containers, Pallets, Drums and barrels, Others) Material (Plastic, Wood, Metal, Others) End-user (Automotive, Food and beverage, Retail and e-commerce, Industrial, Pharmaceuticals)

bekuplast GmbH, CABKA Group GmbH, Craemer GmbH, DS Smith Plc, Georg Utz Holding AG, Greif Inc., IFCO SYSTEMS GmbH, Menasha Corp, Myers Industries Inc., NEFAB GROUP, ORBIS Corp., Paxxal Inc, Rehrig Pacific Co., Schoeller Allibert, Snyder Industries Inc., Sonoco Products Co., SSI Schafer IT Solutions GmbH, Tosca Services LLC, TranPak Inc., Vetropack Group are a few of the key vendors in the Returnable Transport Packaging (Rtp) market.

North America will register the highest growth rate of 34.5% among the other regions. Therefore, the Returnable Transport Packaging (Rtp) market in North America is expected to garner significant business opportunities for the vendors during the forecast period.

US, Canada, Mexico, Germany, UK, France, Italy, Spain, The Netherlands, China, Japan, India, South Korea, Australia, Indonesia, Saudi Arabia, UAE, South Africa, Turkey, Israel, Brazil, Argentina, Chile

  • Compelling economic incentives and long term cost reduction is the driving factor this market.

The Returnable Transport Packaging (Rtp) market vendors should focus on grabbing business opportunities from the Product segment as it accounted for the largest market share in the base year.
RIA - Research AI Assistant
Ask RIA