
Rigid Bulk Packaging Market Size 2025-2029
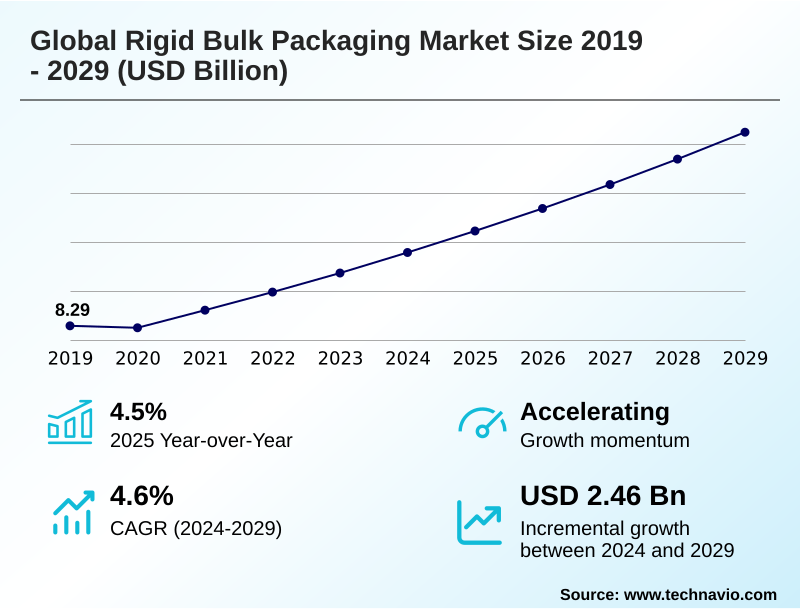
The rigid bulk packaging market size is valued to increase by USD 2.46 billion, at a CAGR of 4.6% from 2024 to 2029. Expansion of industrial and manufacturing activities in emerging economies will drive the rigid bulk packaging market.
Major Market Trends & Insights
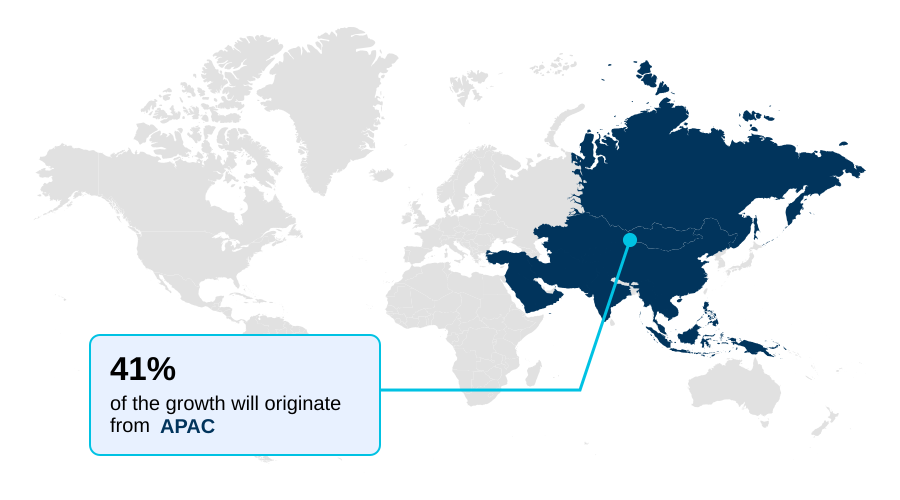
- APAC dominated the market and accounted for a 40.7% growth during the forecast period.
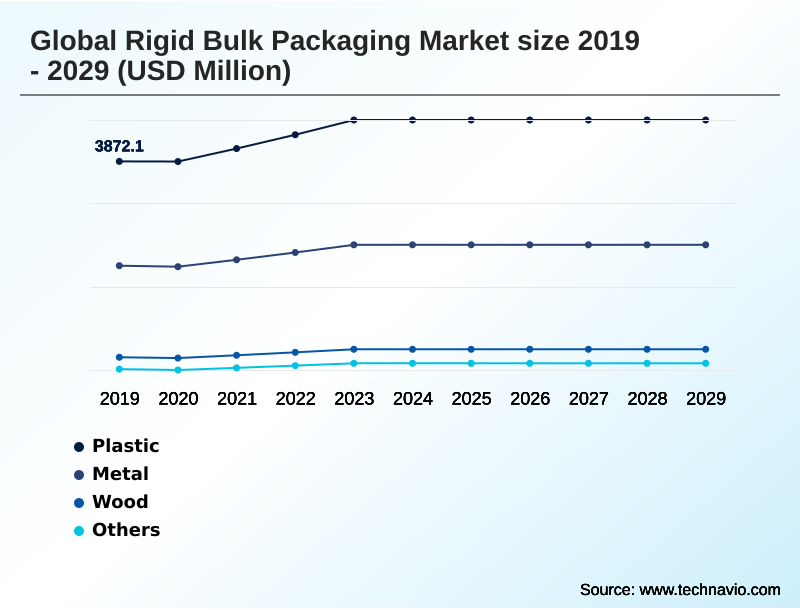
- By Material - Plastic segment was valued at USD 4.46 billion in 2023
- By Product - Drums segment accounted for the largest market revenue share in 2023
Market Size & Forecast
- Market Opportunities: USD 3.95 billion
- Market Future Opportunities: USD 2.46 billion
- CAGR from 2024 to 2029 : 4.6%
Market Summary
- The rigid bulk packaging market is characterized by its essential role in global industrial logistics, providing robust and reliable solutions for transporting substantial quantities of goods. Demand is intrinsically linked to the health of key end-use sectors like chemicals, food and beverage, and pharmaceuticals.
- A pivotal dynamic is the industry's shift toward circular economy principles, moving from a linear model to one that prioritizes reuse and material recovery.
- For instance, a chemical manufacturer can now partner with a packaging supplier to implement a closed-loop system for its composite intermediate bulk containers, where used units are collected, reconditioned, and returned for subsequent shipments, significantly reducing waste and raw material consumption. This evolution is driven by both regulatory pressures mandating sustainability and the clear economic benefits of extending asset life.
- Concurrently, technological advancements are converting standard containers into smart assets, offering unprecedented supply chain visibility. This combination of sustainability and digitalization is fundamentally reshaping product offerings and competitive strategies, forcing participants to innovate beyond simple containment to provide comprehensive lifecycle services and data-driven insights.
- The market's resilience is tested by raw material price volatility and competition from flexible alternatives, demanding continuous innovation in lightweighting and material science.
What will be the Size of the Rigid Bulk Packaging Market during the forecast period?
Get Key Insights on Market Forecast (PDF) Get Free Sample
How is the Rigid Bulk Packaging Market Segmented?
The rigid bulk packaging industry research report provides comprehensive data (region-wise segment analysis), with forecasts and estimates in "USD million" for the period 2025-2029, as well as historical data from 2019-2023 for the following segments.
- Material
- Plastic
- Metal
- Wood
- Others
- Product
- Drums
- Pails
- Others
- End-user
- Food and beverage
- Chemicals
- Agriculture
- E-commerce and retail
- Others
- Geography
- APAC
- China
- India
- Japan
- North America
- US
- Canada
- Mexico
- Europe
- Germany
- France
- UK
- Middle East and Africa
- Saudi Arabia
- UAE
- South Africa
- South America
- Brazil
- Argentina
- Colombia
- Rest of World (ROW)
- APAC
By Material Insights
The plastic segment is estimated to witness significant growth during the forecast period.
The plastic segment, dominated by high-density polyethylene, is foundational to the market, offering a balance of durability, chemical resistance, and cost-effectiveness.
Key products like food-grade hdpe pails and the inner bottles of composite intermediate bulk containers are ubiquitous, driven by their suitability for a vast range of applications.
Innovation focuses heavily on sustainability, with advancements in multi-layer co-extrusion technology enabling the integration of post-consumer recycled resin.
A three-layer plastic drum design, for example, allows for over 50% recycled content without compromising the un-rated rigid packaging standards required for regulated goods.
This pursuit of circular economy principles, alongside blow molding manufacturing refinements, addresses both regulatory pressures and sustainable procurement policies from end-users, ensuring plastics' continued relevance through enhanced end-of-life material recovery.
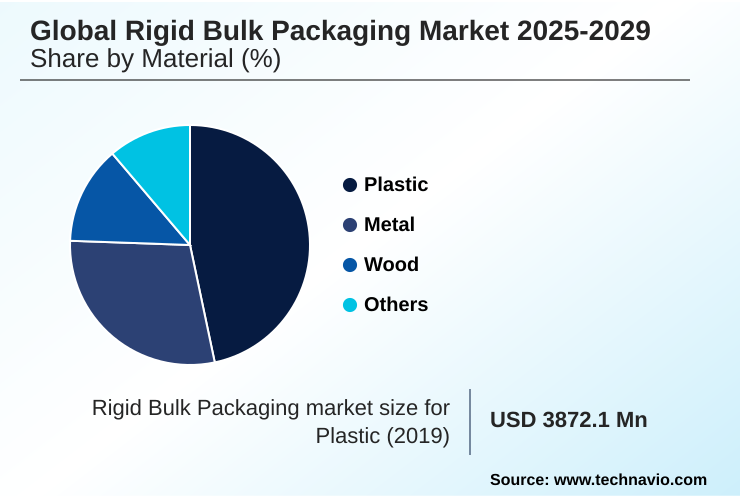
The Plastic segment was valued at USD 4.46 billion in 2023 and showed a gradual increase during the forecast period.
Regional Analysis
APAC is estimated to contribute 40.7% to the growth of the global market during the forecast period.Technavio’s analysts have elaborately explained the regional trends and drivers that shape the market during the forecast period.
See How Rigid Bulk Packaging Market Demand is Rising in APAC Get Free Sample
The market's geographic landscape is led by APAC, which accounts for over 40% of the incremental growth, driven by its expansive manufacturing base.
This region's demand for products like returnable plastic totes and reusable plastic pallets is fueled by rapid industrialization, with countries like China and India at the forefront.
In contrast, the mature North America and Europe markets focus on operational excellence and sustainability, championing the use of foldable large containers and rigid pallet containers to optimize logistics.
The nearshoring manufacturing trend is boosting demand in North America, while Europe’s packaging and packaging waste regulation steers innovation.
South America and the Middle East and Africa contribute smaller shares but show potential, particularly in commodity-based sectors requiring hot-fill liquid containers and polyvinyl chloride drums, reflecting diverse regional drivers and supply chain bottlenecks.
Market Dynamics
Our researchers analyzed the data with 2024 as the base year, along with the key drivers, trends, and challenges. A holistic analysis of drivers will help companies refine their marketing strategies to gain a competitive advantage.
- Strategic decision-making in the rigid bulk packaging market increasingly revolves around a nuanced understanding of total cost of ownership, where the initial purchase price is just one component. Evaluating the cost benefits of reconditioned ibcs is a critical exercise for procurement managers, as these units can offer savings of up to 30% compared to new containers without compromising on safety.
- The hdpe drum chemical resistance properties remain a key selection criterion, ensuring product integrity for a wide range of industrial liquids. For high-value or sensitive goods, the focus shifts to smart packaging for bulk logistics, leveraging technologies that improve supply chain with rfid for real-time tracking and monitoring.
- Adherence to regulatory mandates is non-negotiable, making a deep knowledge of un certification for hazardous materials and the specific regulations for transporting hazardous waste essential for compliance and risk mitigation.
- The broader sustainability trends in industrial packaging are driving the market toward circular economy models for packaging, with a focus on the role of pcr in plastic drums and the transition from wood to plastic pallets. Companies are analyzing lightweighting effects on shipping costs and making strategic choices based on the ibc vs steel drum comparison for different applications.
- Effective management involves alleviating supply chain bottlenecks, enhancing product protection with rigid packaging, and making strategic investments in ibc reconditioning networks. Success depends on mastering material science in rigid packaging, optimizing logistics with smart containers, upholding safety standards for food-grade ibcs, and navigating the challenges of epr for packaging producers while managing raw material price fluctuations.
What are the key market drivers leading to the rise in the adoption of Rigid Bulk Packaging Industry?
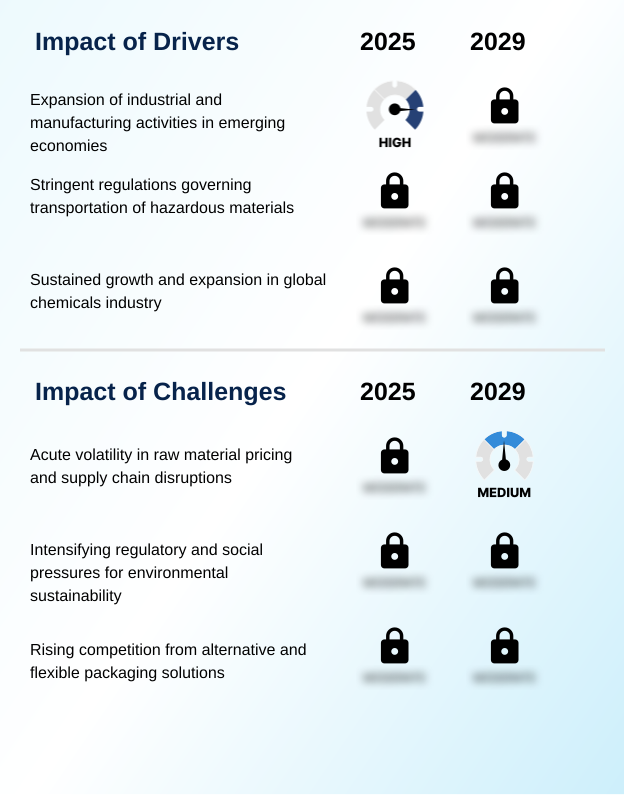
- The expansion of industrial and manufacturing activities within emerging economies, coupled with increasingly stringent transportation regulations, serves as a primary driver for market growth.
- Market expansion is fundamentally driven by industrial growth and stringent regulations governing hazardous material transport. The expansion of manufacturing in emerging economies directly escalates demand for robust solutions like un-certified steel drums and engineered plastic products.
- Concurrently, rigorous standards, such as the un recommendations on the transport of dangerous goods, mandate high-performance packaging, effectively channeling demand towards proven formats like un-rated rigid packaging.
- This regulatory framework ensures that containers can withstand physical stress, with certified packaging reducing transit incidents by over 60%.
- The sustained growth in the global chemicals industry, a major end-user, further underpins this demand, with major investments in production capacity creating a long-term need for reliable extrusion lines tooling and borosilicate neutral glass for specialized applications, reinforcing supply chain resilience.
What are the market trends shaping the Rigid Bulk Packaging Industry?
- A transformative trend involves integrating smart technologies to enhance supply chain visibility, which converts traditional containers into intelligent, data-generating assets within the logistics network.
- A transformative trend is the integration of smart technologies to achieve unprecedented supply chain visibility. The adoption of internet of things sensors and radio frequency identification tags is converting assets like rebottled ibcs and stainless steel ibcs into intelligent, data-generating units.
- This shift provides real-time data on shipment location and condition, a capability that enhances product integrity assurance, with some systems preventing spoilage in over 99% of monitored temperature-sensitive shipments. This level of control, enabled by geofencing theft prevention and other value-added services, is becoming a key differentiator.
- The technology also optimizes packaging lifecycle management and logistical efficiency optimization, automating inventory processes and streamlining closed-loop collection systems.
What challenges does the Rigid Bulk Packaging Industry face during its growth?
- Acute volatility in raw material pricing, compounded by persistent supply chain disruptions, presents a significant and ongoing challenge to the industry's growth and profitability.
- The market faces significant headwinds from acute raw material price volatility and intensifying competition. Fluctuations in the cost of commodities like steel and polyethylene terephthalate, which can vary by as much as 50% in a single quarter, directly impact profitability and complicate financial planning.
- Concurrently, the rise of alternatives like flexible intermediate bulk containers (FIBCs), which can offer a 20% lower upfront cost for dry solids, challenges the market share of rigid formats like fiberboard ibcs and heavy-duty corrugated containers.
- These competitive pressures force manufacturers to innovate and justify their value proposition by emphasizing superior protection and reusability, all while navigating the complexities of extended producer responsibility schemes and the rising cost of soda-lime-silica glass and polypropylene polystyrene.
Exclusive Technavio Analysis on Customer Landscape
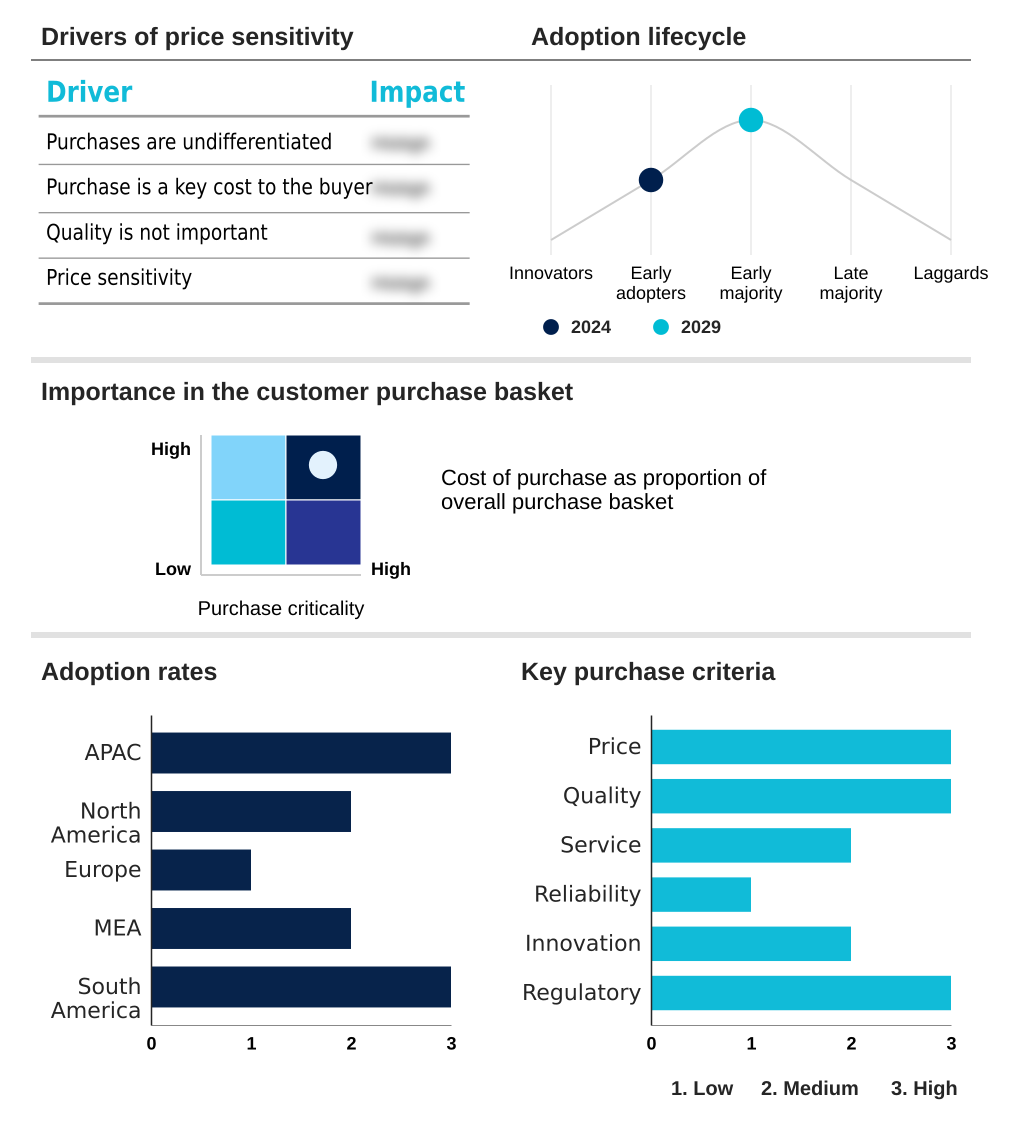
The rigid bulk packaging market forecasting report includes the adoption lifecycle of the market, covering from the innovator’s stage to the laggard’s stage. It focuses on adoption rates in different regions based on penetration. Furthermore, the rigid bulk packaging market report also includes key purchase criteria and drivers of price sensitivity to help companies evaluate and develop their market growth analysis strategies.
Customer Landscape of Rigid Bulk Packaging Industry
Competitive Landscape
Companies are implementing various strategies, such as strategic alliances, rigid bulk packaging market forecast, partnerships, mergers and acquisitions, geographical expansion, and product/service launches, to enhance their presence in the industry.
ALPLA Werke Alwin Lehner - Offerings include a comprehensive portfolio of industrial packaging, from intermediate bulk containers to various drum types, emphasizing reconditioning services and material innovation for enhanced lifecycle performance.
The industry research and growth report includes detailed analyses of the competitive landscape of the market and information about key companies, including:
- ALPLA Werke Alwin Lehner
- Amcor Plc
- Berry Global Inc.
- CDF Corp.
- Greif Inc.
- Greiner AG
- Huhtamaki Oyj
- LC Packaging International BV
- MaschioPack GmbH
- Mauser Packaging Solutions
- McManus Drum Company Inc.
- Myers Industries Inc.
- NEFAB GROUP
- Plastipak Holdings Inc.
- Schoeller Allibert
- SCHUTZ GmbH and Co. KGaA
- Smurfit Kappa Group
- Snyder Industries Inc.
- Sonoco Products Co.
- Stora Enso Oyj
Qualitative and quantitative analysis of companies has been conducted to help clients understand the wider business environment as well as the strengths and weaknesses of key industry players. Data is qualitatively analyzed to categorize companies as pure play, category-focused, industry-focused, and diversified; it is quantitatively analyzed to categorize companies as dominant, leading, strong, tentative, and weak.
Recent Development and News in Rigid bulk packaging market
- In March 2025, Mauser Packaging Solutions announced the launch of a new composite IBC featuring an inner bottle made with 40% certified post-consumer recycled resin, aligning with the European PPWR targets.
- In January 2025, Greif Inc. completed its acquisition of a major reconditioning player in the APAC region, expanding its Life Cycle Services network to meet growing customer demand for circular packaging solutions.
- In November 2024, SCHUTZ GmbH & Co. KGaA unveiled its next-generation IoT platform for smart IBCs, offering enhanced real-time monitoring of temperature, shock, and fill levels for high-value chemical shipments.
- In September 2024, Snyder Industries Inc. announced a USD 50 million expansion of its manufacturing facility in Mexico to increase production of rotationally molded polyethylene tanks and bins, supporting the nearshoring trend in North America.
Dive into Technavio’s robust research methodology, blending expert interviews, extensive data synthesis, and validated models for unparalleled Rigid Bulk Packaging Market insights. See full methodology.
| Market Scope | |
|---|---|
| Page number | 308 |
| Base year | 2024 |
| Historic period | 2019-2023 |
| Forecast period | 2025-2029 |
| Growth momentum & CAGR | Accelerate at a CAGR of 4.6% |
| Market growth 2025-2029 | USD 2458.3 million |
| Market structure | Fragmented |
| YoY growth 2024-2025(%) | 4.5% |
| Key countries | China, India, Japan, South Korea, Australia, Indonesia, US, Canada, Mexico, Germany, France, UK, Italy, Spain, The Netherlands, Saudi Arabia, UAE, South Africa, Israel, Turkey, Brazil, Argentina and Colombia |
| Competitive landscape | Leading Companies, Market Positioning of Companies, Competitive Strategies, and Industry Risks |
Research Analyst Overview
- The rigid bulk packaging market is fundamentally driven by the need for secure, efficient transport of industrial goods, with key products including composite intermediate bulk containers, un-certified steel drums, and food-grade hdpe pails.
- A defining shift is the industry's deep integration of sustainability, where reconditioning services and the use of post-consumer recycled resin are no longer niche but core to business strategy. This pivot to a circular model, exemplified by rebottled ibcs and the development of the three-layer plastic drum, directly impacts boardroom decisions on capital expenditure for new collection and refurbishment infrastructure.
- Innovations like aseptic bag-in-box systems, in-mold labeling, and tamper-evident features are enhancing value, while advanced manufacturing techniques such as blow molding manufacturing and multi-layer co-extrusion are improving performance. For specialized applications, demand persists for rotationally molded polyethylene tanks, stainless steel ibcs, and containers with fluoropolymer linings.
- The use of reusable plastic pallets, returnable plastic totes, and heavy-duty corrugated containers further supports logistical efficiency. This evolution toward comprehensive lifecycle management, where firms have cut virgin material use by over 30%, underscores a market where value is increasingly defined by sustainability and service, not just the container itself.
What are the Key Data Covered in this Rigid Bulk Packaging Market Research and Growth Report?
-
What is the expected growth of the Rigid Bulk Packaging Market between 2025 and 2029?
-
USD 2.46 billion, at a CAGR of 4.6%
-
-
What segmentation does the market report cover?
-
The report is segmented by Material (Plastic, Metal, Wood, and Others), Product (Drums, Pails, and Others), End-user (Food and beverage, Chemicals, Agriculture, E-commerce and retail, and Others) and Geography (APAC, North America, Europe, Middle East and Africa, South America)
-
-
Which regions are analyzed in the report?
-
APAC, North America, Europe, Middle East and Africa and South America
-
-
What are the key growth drivers and market challenges?
-
Expansion of industrial and manufacturing activities in emerging economies, Acute volatility in raw material pricing and supply chain disruptions
-
-
Who are the major players in the Rigid Bulk Packaging Market?
-
ALPLA Werke Alwin Lehner, Amcor Plc, Berry Global Inc., CDF Corp., Greif Inc., Greiner AG, Huhtamaki Oyj, LC Packaging International BV, MaschioPack GmbH, Mauser Packaging Solutions, McManus Drum Company Inc., Myers Industries Inc., NEFAB GROUP, Plastipak Holdings Inc., Schoeller Allibert, SCHUTZ GmbH and Co. KGaA, Smurfit Kappa Group, Snyder Industries Inc., Sonoco Products Co. and Stora Enso Oyj
-
Market Research Insights
- The rigid bulk packaging market is advancing through innovations that deliver measurable business outcomes, moving far beyond simple containment. The adoption of supply chain visibility technologies has proven critical, with IoT-enabled monitoring reducing product spoilage from temperature excursions by over 99%.
- Concurrently, the focus on sustainable procurement policies is driving the uptake of closed-loop collection systems and reconditioned assets, which can lower a company’s total cost of ownership by up to 25% over the packaging lifecycle. Innovations in lightweighting design innovation, guided by finite element analysis, are reducing material consumption and transportation costs.
- As the nearshoring manufacturing trend gains momentum, optimizing material handling efficiency becomes paramount. The market is defined by this pursuit of logistical efficiency optimization and carbon footprint reduction, demanding solutions that support both operational excellence and corporate sustainability goals.
We can help! Our analysts can customize this rigid bulk packaging market research report to meet your requirements.
 RIA -
RIA - 
