Robot Kitchen Market Analysis, Size, and Forecast 2026-2030: North America (US, Canada, and Mexico), Europe (Germany, UK, and France), APAC (China, Japan, and India), Middle East and Africa (Saudi Arabia, UAE, and South Africa), South America (Brazil and Argentina), and Rest of World (ROW)

Robot Kitchen Market Analysis, Size, and Forecast 2026-2030:
North America (US, Canada, and Mexico), Europe (Germany, UK, and France), APAC (China, Japan, and India), Middle East and Africa (Saudi Arabia, UAE, and South Africa), South America (Brazil and Argentina), and Rest of World (ROW)

Published: Mar 2026 279 Pages SKU: IRTNTR74453

Market Overview at a Glance

$310.80 Mn
Market Opportunity
24.6%
CAGR 2025 - 2030
40.8%
North America Growth
$84.20 Mn
Commercial segment 2024

Robot Kitchen Market Size 2026-2030

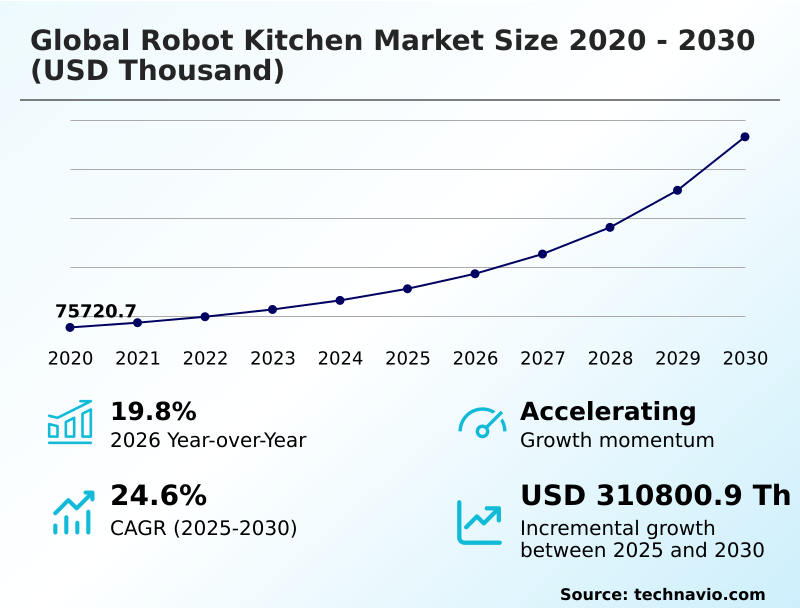
The robot kitchen market size is valued to increase by USD 310.80 million, at a CAGR of 24.6% from 2025 to 2030. Increasing use of automation in kitchens will drive the robot kitchen market.

Major Market Trends & Insights

  • North America dominated the market and accounted for a 40.8% growth during the forecast period.
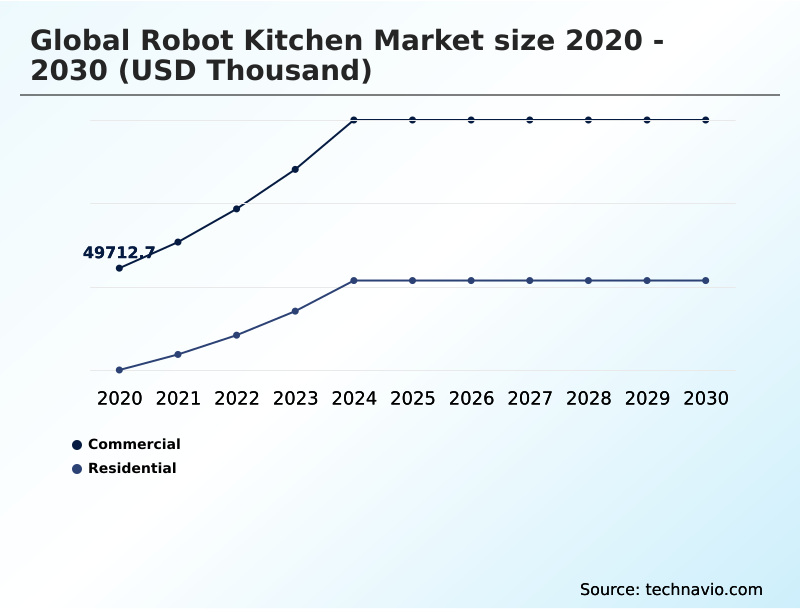
  • By Application - Commercial segment was valued at USD 84.20 million in 2024
  • By Type - Hardware segment accounted for the largest market revenue share in 2024

Market Size & Forecast

  • Market Opportunities:
  • Market Future Opportunities: USD 310.80 million
  • CAGR from 2025 to 2030 : 24.6%

Market Summary

  • The robot kitchen market is expanding as automation becomes integral to food preparation. Key drivers include the pressing need for efficiency and consistency in commercial settings and the growing consumer appetite for convenience in smart homes.
  • The market is advancing through continuous innovation in AI-powered cooking, robotic arms, and smart kitchen technology, with new product launches focusing on modularity and specialized applications. However, significant challenges remain, primarily the high initial investment costs and a general lack of awareness among potential adopters about the long-term ROI.
  • For instance, a large hospitality chain could leverage automated meal preparation and computer vision food assembly to manage a complex supply chain. By deploying autonomous cooking robot systems across multiple locations, it can ensure uniform recipe execution, reduce food waste from human error, and reallocate skilled labor to focus on menu development, thereby improving operational agility in a competitive landscape.
  • The integration of a digital kitchen operating system further enables centralized control and data analysis, which is critical for scaling operations efficiently. These systems, featuring food-grade robotic grippers and sensor-guided robotics, redefine kitchen workflows.

What will be the Size of the Robot Kitchen Market during the forecast period?

Get Key Insights on Market Forecast (PDF) Request Free Sample

How is the Robot Kitchen Market Segmented?

The robot kitchen industry research report provides comprehensive data (region-wise segment analysis), with forecasts and estimates in "USD thousand" for the period 2026-2030, as well as historical data from 2020-2024 for the following segments.

  • Application
    • Commercial
    • Residential
  • Type
    • Hardware
    • Software
  • Price range
    • Mid range robots
    • Budget friendly robots
    • Premium robots
  • Geography
    • North America
      • US
      • Canada
      • Mexico
    • Europe
      • Germany
      • UK
      • France
    • APAC
      • China
      • Japan
      • India
    • Middle East and Africa
      • Saudi Arabia
      • UAE
      • South Africa
    • South America
      • Brazil
      • Argentina
    • Rest of World (ROW)

By Application Insights

The commercial segment is estimated to witness significant growth during the forecast period.

The commercial segment is driven by the need for operational efficiency in high-volume settings like quick-service restaurants and large-scale catering. Adoption of commercial kitchen automation is accelerating, with businesses implementing restaurant automation solutions to standardize quality and reduce labor dependency.

Technologies such as the robotic food assembly system and automated grilling platforms are becoming integral. This integration of automated food service equipment and catering automation technology allows for precise automated ingredient handling and consistent automated meal preparation.

Advanced AI-driven task management and AI-driven menu optimization are key differentiators, with some systems improving order accuracy by over 15%.

This shift toward automated QSR operations and the use of a unified robotic cooking platform underscores the focus on scalable, high-performance robotic meal service.

Request Free Sample

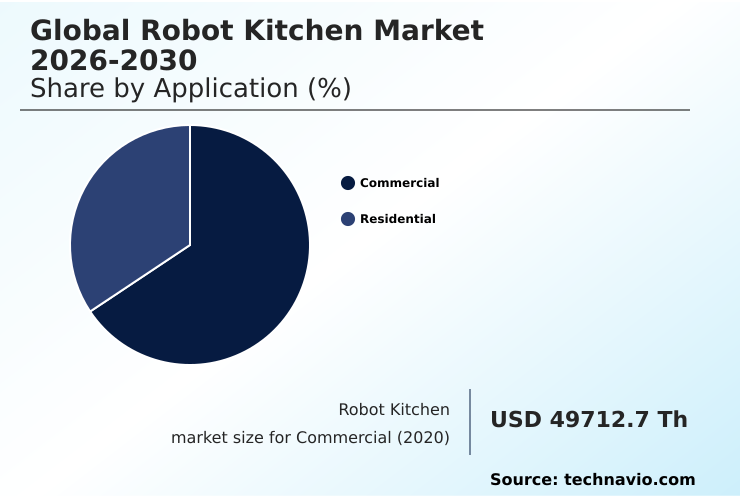
The Commercial segment was valued at USD 84.20 million in 2024 and showed a gradual increase during the forecast period.

Request Free Sample

Regional Analysis

North America is estimated to contribute 40.8% to the growth of the global market during the forecast period.Technavio’s analysts have elaborately explained the regional trends and drivers that shape the market during the forecast period.

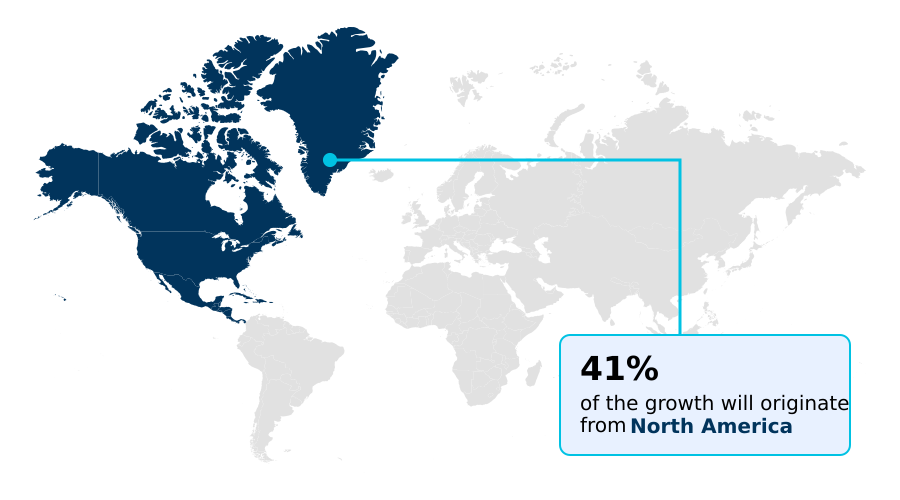
See How Robot Kitchen Market Demand is Rising in North America Request Free Sample

The geographic landscape is led by North America, which accounts for over 40% of the market's incremental growth, driven by strong investment in food tech automation and hotel kitchen automation.

In this region, particularly the US, the demand for contactless food service is accelerating the adoption of technologies like robotic pizza assembly and automated topping process systems.

Europe follows, with countries like Germany and the UK focusing on ghost kitchen automation. APAC is an emerging hub, with innovations in residential smart cooking and the development of specialized robotic kitchen appliance solutions.

Across these regions, the use of automated stir-frying and robotic meal preparation systems has demonstrated up to a 25% improvement in cooking consistency.

Advanced ceiling-mounted robotic arms running sophisticated AI cooking algorithm software are becoming more common, alongside peripheral systems like automated dishwashing robots.

Market Dynamics

Our researchers analyzed the data with 2025 as the base year, along with the key drivers, trends, and challenges. A holistic analysis of drivers will help companies refine their marketing strategies to gain a competitive advantage.

  • The strategic adoption of robotic kitchens requires a thorough analysis of specific use cases and performance metrics. Businesses evaluating the ROI of commercial kitchen automation are examining the benefits of automated frying systems, which promise not only speed but also enhanced food quality.
  • The future of automated food preparation is particularly bright for specialized models like the robotic kitchen for ghost kitchens, where efficiency is paramount. A critical factor is the AI-powered recipe standardization benefits, ensuring product consistency across all locations.
  • When comparing automated food assembly systems, decision-makers must consider the impact of computer vision in food assembly and the software requirements for robotic chef platforms. For those reducing labor costs with kitchen robotics, the choice between different technologies is crucial.
  • For example, automated wok cooking vs manual preparation often shows a significant reduction in cooking time, while the robotic dispensing system accuracy improvements contribute to minimizing waste. The integration of robotic arms in smart homes is driven by the demand for smart kitchen technology for residential use. Even the maintenance costs of automated cooking machines are a key consideration.
  • The role of sensors in autonomous cooking robots cannot be overstated for improving food safety with automation. Successfully implementing a digital kitchen operating system allows for seamless control over processes like robotic pizza assembly speed and consistency.
  • Businesses have found that integrating collaborative robotic arms in food service can reduce order fulfillment errors by a factor of two compared to purely manual lines. This highlights the practical advantages of deploying modular kitchen units for small restaurants and leveraging AI-driven task management in large kitchens.

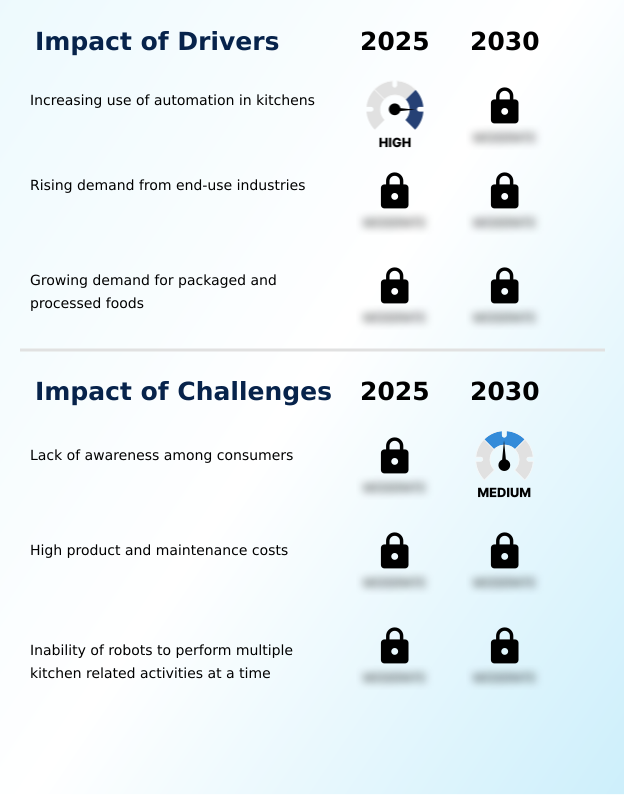
What are the key market drivers leading to the rise in the adoption of Robot Kitchen Industry?

  • The growing adoption of automation within both commercial and residential kitchen environments serves as the primary driver for market expansion.

  • A primary driver is the increasing use of commercial kitchen automation to combat labor shortages and rising operational costs.
  • Restaurant automation solutions and smart restaurant systems are being adopted to enhance efficiency, with deployments of automated frying systems reducing cooking times by over 30% in high-volume environments.
  • Intelligent kitchen systems that utilize computer vision food assembly are capable of performing complex robotic food assembly tasks with 99% accuracy. The demand from the automated food production and catering automation technology sectors is also significant.
  • The implementation of a complete robotic cooking platform with collaborative robotic arms for smart cooking provides businesses a strategic advantage by ensuring consistency and optimizing resource allocation across their operations.

What are the market trends shaping the Robot Kitchen Industry?

  • The market is characterized by a significant trend toward new product launches and strategic expansions. These initiatives are increasingly focused on regional adaptation and technological innovation.

  • A key trend is the expansion of robotic culinary systems beyond commercial applications toward sophisticated smart home kitchen integration. New product launches feature modular kitchen units and specialized automated cooking machines that are more accessible, driving a 20% year-over-year increase in residential inquiries. This trend is supported by advancements in AI chef technology and user-friendly interfaces.
  • In commercial sectors, food preparation automation is evolving, with automated bakery systems showing a 15% improvement in production consistency. The focus is on creating cohesive ecosystems where a central robotic chef platform, enhanced with precise robotic navigation, controls everything from robotic food handling to AI-powered robotic cooking.
  • Even peripheral tasks are being automated, with some automated dishwashing robots reducing water usage by up to 25%.

What challenges does the Robot Kitchen Industry face during its growth?

  • A significant challenge impeding industry growth is the general lack of consumer awareness regarding the benefits and applications of robotic kitchen technology.

  • A major challenge is the high upfront cost of food service robotics, which can be a significant barrier for smaller businesses and robotic kitchen startups. The initial investment for automated food service equipment, such as a single robotic arm for automated wok cooking, can be substantial.
  • This cost issue is compounded by a lack of awareness regarding long-term benefits; for example, while an automated topping process can increase throughput by 40%, many operators remain hesitant. The perceived complexity of integrating systems like modular robotic makelines and sensor-guided robotics also poses a hurdle.
  • Even simpler solutions like an automated beverage dispenser or robotic barista require integration with automated inventory tracking, adding another layer of cost. As a result, market penetration in certain segments remains below 10%, despite the proven efficiency of AI-powered cooking.

Exclusive Technavio Analysis on Customer Landscape

The robot kitchen market forecasting report includes the adoption lifecycle of the market, covering from the innovator’s stage to the laggard’s stage. It focuses on adoption rates in different regions based on penetration. Furthermore, the robot kitchen market report also includes key purchase criteria and drivers of price sensitivity to help companies evaluate and develop their market growth analysis strategies.

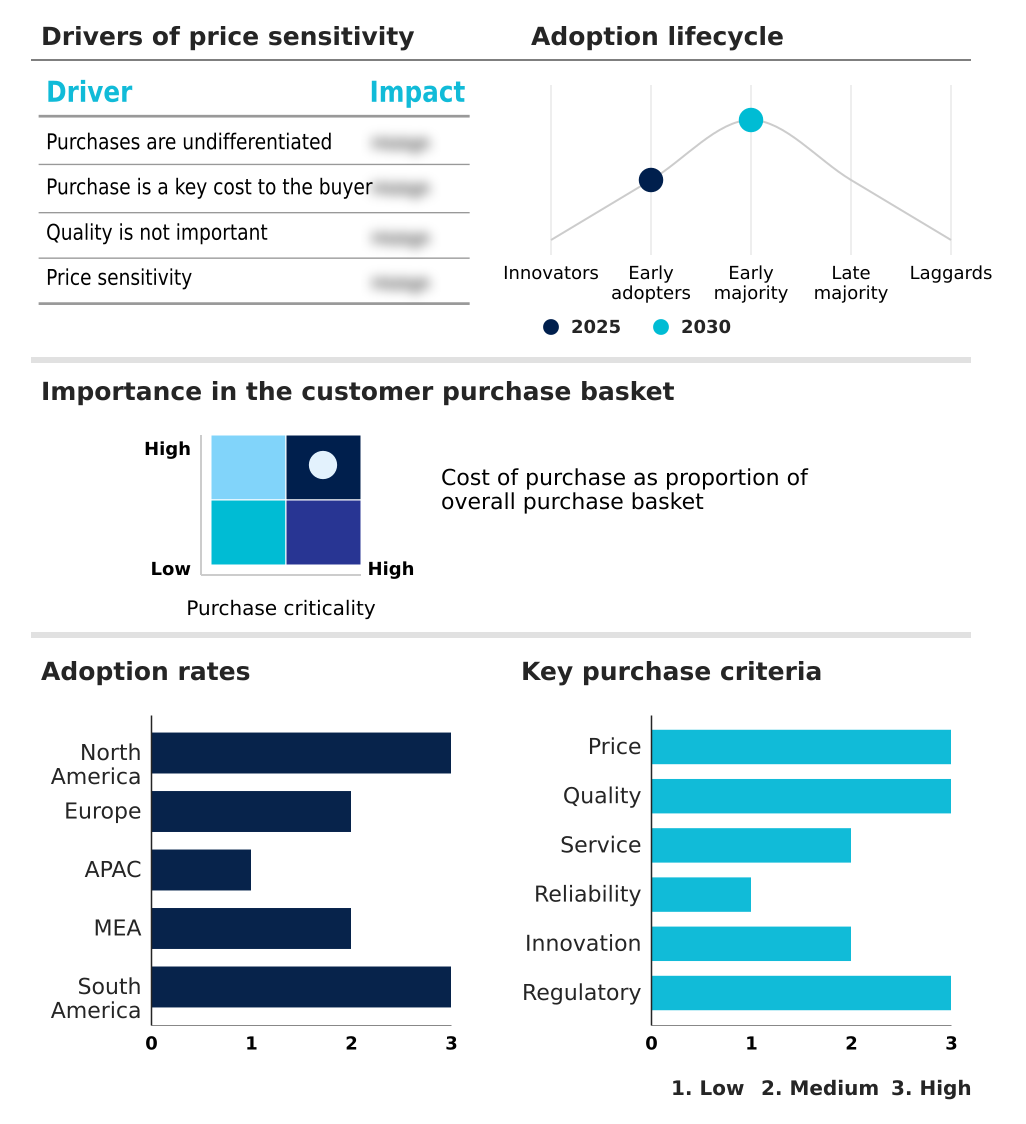
Customer Landscape of Robot Kitchen Industry

Competitive Landscape

Companies are implementing various strategies, such as strategic alliances, robot kitchen market forecast, partnerships, mergers and acquisitions, geographical expansion, and product/service launches, to enhance their presence in the industry.

Aniai Inc. - Provides automated double-sided grilling solutions to standardize cooking processes, ensuring consistency and enhancing operational efficiency in fast-food environments.

The industry research and growth report includes detailed analyses of the competitive landscape of the market and information about key companies, including:

  • Aniai Inc.
  • Appetronix
  • Armstrong Robotics
  • Botinkit
  • Chef Robotics
  • Cibotica
  • Connected Robotics Inc.
  • Cook e
  • GammaChef
  • Hyper Food Robotics
  • Hyphen
  • Miso Robotics Inc.
  • Moley Services Ltd.
  • Nala Robotics Inc.
  • Niryo
  • Picnic Works Inc.
  • TechMagic Inc.
  • The Chef Robot
  • XRobotics
  • YPC Technologies

Qualitative and quantitative analysis of companies has been conducted to help clients understand the wider business environment as well as the strengths and weaknesses of key industry players. Data is qualitatively analyzed to categorize companies as pure play, category-focused, industry-focused, and diversified; it is quantitatively analyzed to categorize companies as dominant, leading, strong, tentative, and weak.

Recent Development and News in Robot kitchen market

  • In May 2025, Nala Robotics Inc. announced the expansion of its modular kitchen assembly units into the Middle Eastern and North African regions to support localized supply chains.
  • In March 2025, Miso Robotics Inc. reported a surge in demand for its automated frying systems as North American hospitality groups sought to hedge against inflationary pressures and labor shortages.
  • In January 2025, Karakuri noted a reduction in the deployment of its physical demonstration units across Western European trade corridors, citing the high costs associated with international freight.
  • In October 2024, Picnic Works Inc. formed a strategic partnership with a leading quick-service pizza chain to deploy its automated pizza assembly stations across 50 new locations.

Dive into Technavio’s robust research methodology, blending expert interviews, extensive data synthesis, and validated models for unparalleled Robot Kitchen Market insights. See full methodology.

Market Scope
Page number 279
Base year 2025
Historic period 2020-2024
Forecast period 2026-2030
Growth momentum & CAGR Accelerate at a CAGR of 24.6%
Market growth 2026-2030 USD 310800.9 thousand
Market structure Fragmented
YoY growth 2025-2026(%) 19.8%
Key countries US, Canada, Mexico, Germany, UK, France, Italy, Spain, The Netherlands, China, Japan, India, South Korea, Australia, Indonesia, Saudi Arabia, UAE, South Africa, Israel, Turkey, Brazil, Argentina and Chile
Competitive landscape Leading Companies, Market Positioning of Companies, Competitive Strategies, and Industry Risks

Request Free Sample

Research Analyst Overview

  • The robot kitchen market is defined by the convergence of advanced hardware and intelligent software. Core components like the robotic arm and food-grade robotic grippers are now standard, enabling complex automated food preparation tasks. Systems featuring automated frying systems, automated grilling, and automated wok cooking are gaining traction.
  • The integration of AI-powered cooking through a central digital kitchen operating system allows for precise AI-driven task management and recipe execution via an AI cooking algorithm. This smart kitchen technology extends to collaborative robotic arms and AI-integrated robotic systems that perform automated ingredient handling, robotic dispensing, and robotic food assembly.
  • For boardroom consideration, the decision to invest in a complete robotic cooking platform is a strategic one, impacting long-term capital expenditure versus operational labor costs. Deploying these systems, which can include automated pasta preparation, robotic pizza assembly, and automated stir-frying modules, has been shown to reduce food preparation time by over 30%.
  • From modular kitchen units to fully autonomous cooking robot setups with ceiling-mounted robotic arms and sensor-guided robotics, the focus is on scalable automated meal preparation. The evolution of the robotic food assembly system and modular robotic makelines showcases a shift towards customizable robotic meal preparation solutions.

What are the Key Data Covered in this Robot Kitchen Market Research and Growth Report?

  • What is the expected growth of the Robot Kitchen Market between 2026 and 2030?

    • USD 310.80 million, at a CAGR of 24.6%

  • What segmentation does the market report cover?

    • The report is segmented by Application (Commercial, and Residential), Type (Hardware, and Software), Price Range (Mid range robots, Budget friendly robots, and Premium robots) and Geography (North America, Europe, APAC, Middle East and Africa, South America)

  • Which regions are analyzed in the report?

    • North America, Europe, APAC, Middle East and Africa and South America

  • What are the key growth drivers and market challenges?

    • Increasing use of automation in kitchens, Lack of awareness among consumers

  • Who are the major players in the Robot Kitchen Market?

    • Aniai Inc., Appetronix, Armstrong Robotics, Botinkit, Chef Robotics, Cibotica, Connected Robotics Inc., Cook e, GammaChef, Hyper Food Robotics, Hyphen, Miso Robotics Inc., Moley Services Ltd., Nala Robotics Inc., Niryo, Picnic Works Inc., TechMagic Inc., The Chef Robot, XRobotics and YPC Technologies

Market Research Insights

  • The dynamics of the robot kitchen market are shaped by a push toward food tech automation and the rise of ghost kitchen automation. Adoption of food service robotics in commercial settings has resulted in tangible efficiency gains, with some operators reporting a 30% reduction in food waste and a 20% increase in order throughput.
  • The integration of culinary robotics into smart restaurant systems is no longer a niche concept, as restaurant automation solutions demonstrate a clear return on investment. This is particularly true for automated QSR operations, where speed and consistency are paramount. Even in specialized areas, robotic barista and automated beverage dispenser systems show adoption rates climbing by 15% annually in high-traffic venues.
  • This momentum reflects a broader industry shift toward intelligent kitchen systems.

We can help! Our analysts can customize this robot kitchen market research report to meet your requirements.

Get in touch

1. Executive Summary

1.1 Market overview

Executive Summary - Chart on Market Overview
Executive Summary - Data Table on Market Overview
Executive Summary - Chart on Global Market Characteristics
Executive Summary - Chart on Market by Geography
Executive Summary - Chart on Market Segmentation by Application
Executive Summary - Chart on Market Segmentation by Type
Executive Summary - Chart on Market Segmentation by Price Range
Executive Summary - Chart on Incremental Growth
Executive Summary - Data Table on Incremental Growth
Executive Summary - Chart on Company Market Positioning

2. Technavio Analysis

2.1 Analysis of price sensitivity, lifecycle, customer purchase basket, adoption rates, and purchase criteria

2.2 Criticality of inputs and Factors of differentiation

Chart on Overview on criticality of inputs and factors of differentiation

2.3 Factors of disruption

Chart on Overview on factors of disruption

2.4 Impact of drivers and challenges

Chart on Impact of drivers and challenges in 2025 and 2030

3. Market Landscape

3.1 Market ecosystem

Chart on Parent Market
Data Table on - Parent Market

3.2 Market characteristics

Chart on Market characteristics analysis

3.3 Value chain analysis

Chart on Value chain analysis

4. Market Sizing

4.1 Market definition

Data Table on Offerings of companies included in the market definition

4.2 Market segment analysis

Market segments

4.3 Market size 2025

4.4 Market outlook: Forecast for 2025-2030

Chart on Global - Market size and forecast 2025-2030 ($ thousand)
Data Table on Global - Market size and forecast 2025-2030 ($ thousand)
Chart on Global Market: Year-over-year growth 2025-2030 (%)
Data Table on Global Market: Year-over-year growth 2025-2030 (%)

5. Historic Market Size

5.1 Global Robot Kitchen Market 2020 - 2024

Historic Market Size - Data Table on Global Robot Kitchen Market 2020 - 2024 ($ thousand)

5.2 Application segment analysis 2020 - 2024

Historic Market Size - Application Segment 2020 - 2024 ($ thousand)

5.3 Type segment analysis 2020 - 2024

Historic Market Size - Type Segment 2020 - 2024 ($ thousand)

5.4 Price Range segment analysis 2020 - 2024

Historic Market Size - Price Range Segment 2020 - 2024 ($ thousand)

5.5 Geography segment analysis 2020 - 2024

Historic Market Size - Geography Segment 2020 - 2024 ($ thousand)

5.6 Country segment analysis 2020 - 2024

Historic Market Size - Country Segment 2020 - 2024 ($ thousand)

6. Qualitative Analysis

6.1 Impact of AI on Global Robot Kitchen Market

6.2 Impact of Geopolitical Conflicts on Global Robot Kitchen Market

7. Five Forces Analysis

7.1 Five forces summary

Five forces analysis - Comparison between 2025 and 2030

7.2 Bargaining power of buyers

Bargaining power of buyers - Impact of key factors 2025 and 2030

7.3 Bargaining power of suppliers

Bargaining power of suppliers - Impact of key factors in 2025 and 2030

7.4 Threat of new entrants

Threat of new entrants - Impact of key factors in 2025 and 2030

7.5 Threat of substitutes

Threat of substitutes - Impact of key factors in 2025 and 2030

7.6 Threat of rivalry

Threat of rivalry - Impact of key factors in 2025 and 2030

7.7 Market condition

Chart on Market condition - Five forces 2025 and 2030

8. Market Segmentation by Application

8.1 Market segments

Chart on Application - Market share 2025-2030 (%)
Data Table on Application - Market share 2025-2030 (%)

8.2 Comparison by Application

Chart on Comparison by Application
Data Table on Comparison by Application

8.3 Commercial - Market size and forecast 2025-2030

Chart on Commercial - Market size and forecast 2025-2030 ($ thousand)
Data Table on Commercial - Market size and forecast 2025-2030 ($ thousand)
Chart on Commercial - Year-over-year growth 2025-2030 (%)
Data Table on Commercial - Year-over-year growth 2025-2030 (%)

8.4 Residential - Market size and forecast 2025-2030

Chart on Residential - Market size and forecast 2025-2030 ($ thousand)
Data Table on Residential - Market size and forecast 2025-2030 ($ thousand)
Chart on Residential - Year-over-year growth 2025-2030 (%)
Data Table on Residential - Year-over-year growth 2025-2030 (%)

8.5 Market opportunity by Application

Market opportunity by Application ($ thousand)
Data Table on Market opportunity by Application ($ thousand)

9. Market Segmentation by Type

9.1 Market segments

Chart on Type - Market share 2025-2030 (%)
Data Table on Type - Market share 2025-2030 (%)

9.2 Comparison by Type

Chart on Comparison by Type
Data Table on Comparison by Type

9.3 Hardware - Market size and forecast 2025-2030

Chart on Hardware - Market size and forecast 2025-2030 ($ thousand)
Data Table on Hardware - Market size and forecast 2025-2030 ($ thousand)
Chart on Hardware - Year-over-year growth 2025-2030 (%)
Data Table on Hardware - Year-over-year growth 2025-2030 (%)

9.4 Software - Market size and forecast 2025-2030

Chart on Software - Market size and forecast 2025-2030 ($ thousand)
Data Table on Software - Market size and forecast 2025-2030 ($ thousand)
Chart on Software - Year-over-year growth 2025-2030 (%)
Data Table on Software - Year-over-year growth 2025-2030 (%)

9.5 Market opportunity by Type

Market opportunity by Type ($ thousand)
Data Table on Market opportunity by Type ($ thousand)

10. Market Segmentation by Price Range

10.1 Market segments

Chart on Price Range - Market share 2025-2030 (%)
Data Table on Price Range - Market share 2025-2030 (%)

10.2 Comparison by Price Range

Chart on Comparison by Price Range
Data Table on Comparison by Price Range

10.3 Mid range robots - Market size and forecast 2025-2030

Chart on Mid range robots - Market size and forecast 2025-2030 ($ thousand)
Data Table on Mid range robots - Market size and forecast 2025-2030 ($ thousand)
Chart on Mid range robots - Year-over-year growth 2025-2030 (%)
Data Table on Mid range robots - Year-over-year growth 2025-2030 (%)

10.4 Budget friendly robots - Market size and forecast 2025-2030

Chart on Budget friendly robots - Market size and forecast 2025-2030 ($ thousand)
Data Table on Budget friendly robots - Market size and forecast 2025-2030 ($ thousand)
Chart on Budget friendly robots - Year-over-year growth 2025-2030 (%)
Data Table on Budget friendly robots - Year-over-year growth 2025-2030 (%)

10.5 Premium robots - Market size and forecast 2025-2030

Chart on Premium robots - Market size and forecast 2025-2030 ($ thousand)
Data Table on Premium robots - Market size and forecast 2025-2030 ($ thousand)
Chart on Premium robots - Year-over-year growth 2025-2030 (%)
Data Table on Premium robots - Year-over-year growth 2025-2030 (%)

10.6 Market opportunity by Price Range

Market opportunity by Price Range ($ thousand)
Data Table on Market opportunity by Price Range ($ thousand)

11. Customer Landscape

11.1 Customer landscape overview

Analysis of price sensitivity, lifecycle, customer purchase basket, adoption rates, and purchase criteria

12. Geographic Landscape

12.1 Geographic segmentation

Chart on Market share by geography 2025-2030 (%)
Data Table on Market share by geography 2025-2030 (%)

12.2 Geographic comparison

Chart on Geographic comparison
Data Table on Geographic comparison

12.3 North America - Market size and forecast 2025-2030

Chart on North America - Market size and forecast 2025-2030 ($ thousand)
Data Table on North America - Market size and forecast 2025-2030 ($ thousand)
Chart on North America - Year-over-year growth 2025-2030 (%)
Data Table on North America - Year-over-year growth 2025-2030 (%)
Chart on Regional Comparison - North America
Data Table on Regional Comparison - North America

12.3.1 US - Market size and forecast 2025-2030

Chart on US - Market size and forecast 2025-2030 ($ thousand)
Data Table on US - Market size and forecast 2025-2030 ($ thousand)
Chart on US - Year-over-year growth 2025-2030 (%)
Data Table on US - Year-over-year growth 2025-2030 (%)

12.3.2 Canada - Market size and forecast 2025-2030

Chart on Canada - Market size and forecast 2025-2030 ($ thousand)
Data Table on Canada - Market size and forecast 2025-2030 ($ thousand)
Chart on Canada - Year-over-year growth 2025-2030 (%)
Data Table on Canada - Year-over-year growth 2025-2030 (%)

12.3.3 Mexico - Market size and forecast 2025-2030

Chart on Mexico - Market size and forecast 2025-2030 ($ thousand)
Data Table on Mexico - Market size and forecast 2025-2030 ($ thousand)
Chart on Mexico - Year-over-year growth 2025-2030 (%)
Data Table on Mexico - Year-over-year growth 2025-2030 (%)

12.4 Europe - Market size and forecast 2025-2030

Chart on Europe - Market size and forecast 2025-2030 ($ thousand)
Data Table on Europe - Market size and forecast 2025-2030 ($ thousand)
Chart on Europe - Year-over-year growth 2025-2030 (%)
Data Table on Europe - Year-over-year growth 2025-2030 (%)
Chart on Regional Comparison - Europe
Data Table on Regional Comparison - Europe

12.4.1 Germany - Market size and forecast 2025-2030

Chart on Germany - Market size and forecast 2025-2030 ($ thousand)
Data Table on Germany - Market size and forecast 2025-2030 ($ thousand)
Chart on Germany - Year-over-year growth 2025-2030 (%)
Data Table on Germany - Year-over-year growth 2025-2030 (%)

12.4.2 UK - Market size and forecast 2025-2030

Chart on UK - Market size and forecast 2025-2030 ($ thousand)
Data Table on UK - Market size and forecast 2025-2030 ($ thousand)
Chart on UK - Year-over-year growth 2025-2030 (%)
Data Table on UK - Year-over-year growth 2025-2030 (%)

12.4.3 France - Market size and forecast 2025-2030

Chart on France - Market size and forecast 2025-2030 ($ thousand)
Data Table on France - Market size and forecast 2025-2030 ($ thousand)
Chart on France - Year-over-year growth 2025-2030 (%)
Data Table on France - Year-over-year growth 2025-2030 (%)

12.4.4 Italy - Market size and forecast 2025-2030

Chart on Italy - Market size and forecast 2025-2030 ($ thousand)
Data Table on Italy - Market size and forecast 2025-2030 ($ thousand)
Chart on Italy - Year-over-year growth 2025-2030 (%)
Data Table on Italy - Year-over-year growth 2025-2030 (%)

12.4.5 Spain - Market size and forecast 2025-2030

Chart on Spain - Market size and forecast 2025-2030 ($ thousand)
Data Table on Spain - Market size and forecast 2025-2030 ($ thousand)
Chart on Spain - Year-over-year growth 2025-2030 (%)
Data Table on Spain - Year-over-year growth 2025-2030 (%)

12.4.6 The Netherlands - Market size and forecast 2025-2030

Chart on The Netherlands - Market size and forecast 2025-2030 ($ thousand)
Data Table on The Netherlands - Market size and forecast 2025-2030 ($ thousand)
Chart on The Netherlands - Year-over-year growth 2025-2030 (%)
Data Table on The Netherlands - Year-over-year growth 2025-2030 (%)

12.5 APAC - Market size and forecast 2025-2030

Chart on APAC - Market size and forecast 2025-2030 ($ thousand)
Data Table on APAC - Market size and forecast 2025-2030 ($ thousand)
Chart on APAC - Year-over-year growth 2025-2030 (%)
Data Table on APAC - Year-over-year growth 2025-2030 (%)
Chart on Regional Comparison - APAC
Data Table on Regional Comparison - APAC

12.5.1 China - Market size and forecast 2025-2030

Chart on China - Market size and forecast 2025-2030 ($ thousand)
Data Table on China - Market size and forecast 2025-2030 ($ thousand)
Chart on China - Year-over-year growth 2025-2030 (%)
Data Table on China - Year-over-year growth 2025-2030 (%)

12.5.2 Japan - Market size and forecast 2025-2030

Chart on Japan - Market size and forecast 2025-2030 ($ thousand)
Data Table on Japan - Market size and forecast 2025-2030 ($ thousand)
Chart on Japan - Year-over-year growth 2025-2030 (%)
Data Table on Japan - Year-over-year growth 2025-2030 (%)

12.5.3 India - Market size and forecast 2025-2030

Chart on India - Market size and forecast 2025-2030 ($ thousand)
Data Table on India - Market size and forecast 2025-2030 ($ thousand)
Chart on India - Year-over-year growth 2025-2030 (%)
Data Table on India - Year-over-year growth 2025-2030 (%)

12.5.4 South Korea - Market size and forecast 2025-2030

Chart on South Korea - Market size and forecast 2025-2030 ($ thousand)
Data Table on South Korea - Market size and forecast 2025-2030 ($ thousand)
Chart on South Korea - Year-over-year growth 2025-2030 (%)
Data Table on South Korea - Year-over-year growth 2025-2030 (%)

12.5.5 Australia - Market size and forecast 2025-2030

Chart on Australia - Market size and forecast 2025-2030 ($ thousand)
Data Table on Australia - Market size and forecast 2025-2030 ($ thousand)
Chart on Australia - Year-over-year growth 2025-2030 (%)
Data Table on Australia - Year-over-year growth 2025-2030 (%)

12.5.6 Indonesia - Market size and forecast 2025-2030

Chart on Indonesia - Market size and forecast 2025-2030 ($ thousand)
Data Table on Indonesia - Market size and forecast 2025-2030 ($ thousand)
Chart on Indonesia - Year-over-year growth 2025-2030 (%)
Data Table on Indonesia - Year-over-year growth 2025-2030 (%)

12.6 Middle East and Africa - Market size and forecast 2025-2030

Chart on Middle East and Africa - Market size and forecast 2025-2030 ($ thousand)
Data Table on Middle East and Africa - Market size and forecast 2025-2030 ($ thousand)
Chart on Middle East and Africa - Year-over-year growth 2025-2030 (%)
Data Table on Middle East and Africa - Year-over-year growth 2025-2030 (%)
Chart on Regional Comparison - Middle East and Africa
Data Table on Regional Comparison - Middle East and Africa

12.6.1 Saudi Arabia - Market size and forecast 2025-2030

Chart on Saudi Arabia - Market size and forecast 2025-2030 ($ thousand)
Data Table on Saudi Arabia - Market size and forecast 2025-2030 ($ thousand)
Chart on Saudi Arabia - Year-over-year growth 2025-2030 (%)
Data Table on Saudi Arabia - Year-over-year growth 2025-2030 (%)

12.6.2 UAE - Market size and forecast 2025-2030

Chart on UAE - Market size and forecast 2025-2030 ($ thousand)
Data Table on UAE - Market size and forecast 2025-2030 ($ thousand)
Chart on UAE - Year-over-year growth 2025-2030 (%)
Data Table on UAE - Year-over-year growth 2025-2030 (%)

12.6.3 South Africa - Market size and forecast 2025-2030

Chart on South Africa - Market size and forecast 2025-2030 ($ thousand)
Data Table on South Africa - Market size and forecast 2025-2030 ($ thousand)
Chart on South Africa - Year-over-year growth 2025-2030 (%)
Data Table on South Africa - Year-over-year growth 2025-2030 (%)

12.6.4 Israel - Market size and forecast 2025-2030

Chart on Israel - Market size and forecast 2025-2030 ($ thousand)
Data Table on Israel - Market size and forecast 2025-2030 ($ thousand)
Chart on Israel - Year-over-year growth 2025-2030 (%)
Data Table on Israel - Year-over-year growth 2025-2030 (%)

12.6.5 Turkey - Market size and forecast 2025-2030

Chart on Turkey - Market size and forecast 2025-2030 ($ thousand)
Data Table on Turkey - Market size and forecast 2025-2030 ($ thousand)
Chart on Turkey - Year-over-year growth 2025-2030 (%)
Data Table on Turkey - Year-over-year growth 2025-2030 (%)

12.7 South America - Market size and forecast 2025-2030

Chart on South America - Market size and forecast 2025-2030 ($ thousand)
Data Table on South America - Market size and forecast 2025-2030 ($ thousand)
Chart on South America - Year-over-year growth 2025-2030 (%)
Data Table on South America - Year-over-year growth 2025-2030 (%)
Chart on Regional Comparison - South America
Data Table on Regional Comparison - South America

12.7.1 Brazil - Market size and forecast 2025-2030

Chart on Brazil - Market size and forecast 2025-2030 ($ thousand)
Data Table on Brazil - Market size and forecast 2025-2030 ($ thousand)
Chart on Brazil - Year-over-year growth 2025-2030 (%)
Data Table on Brazil - Year-over-year growth 2025-2030 (%)

12.7.2 Argentina - Market size and forecast 2025-2030

Chart on Argentina - Market size and forecast 2025-2030 ($ thousand)
Data Table on Argentina - Market size and forecast 2025-2030 ($ thousand)
Chart on Argentina - Year-over-year growth 2025-2030 (%)
Data Table on Argentina - Year-over-year growth 2025-2030 (%)

12.7.3 Chile - Market size and forecast 2025-2030

Chart on Chile - Market size and forecast 2025-2030 ($ thousand)
Data Table on Chile - Market size and forecast 2025-2030 ($ thousand)
Chart on Chile - Year-over-year growth 2025-2030 (%)
Data Table on Chile - Year-over-year growth 2025-2030 (%)

12.8 Market opportunity by geography

Market opportunity by geography ($ thousand)
Data Tables on Market opportunity by geography ($ thousand)

13. Drivers, Challenges, and Opportunity

13.1 Market drivers

Increasing use of automation in kitchens
Rising demand from end-use industries
Growing demand for packaged and processed foods

13.2 Market challenges

Lack of awareness among consumers
High product and maintenance costs
Inability of robots to perform multiple kitchen related activities at a time

13.3 Impact of drivers and challenges

Impact of drivers and challenges in 2025 and 2030

13.4 Market opportunities

New product launches and expansions
Increasing marketing initiatives by business owners
Technological developments augmenting market growth

14. Competitive Landscape

14.1 Overview

14.2

Overview on criticality of inputs and factors of differentiation

14.3 Landscape disruption

Overview on factors of disruption

14.4 Industry risks

Impact of key risks on business

15. Competitive Analysis

15.1 Companies profiled

Companies covered

15.2 Company ranking index

15.3 Market positioning of companies

Matrix on companies position and classification

15.4 Aniai Inc.

Aniai Inc. - Overview
Aniai Inc. - Product / Service
Aniai Inc. - Key offerings
SWOT

15.5 Appetronix

Appetronix - Overview
Appetronix - Product / Service
Appetronix - Key offerings
SWOT

15.6 Botinkit

Botinkit - Overview
Botinkit - Product / Service
Botinkit - Key offerings
SWOT

15.7 Chef Robotics

Chef Robotics - Overview
Chef Robotics - Product / Service
Chef Robotics - Key offerings
SWOT

15.8 Connected Robotics Inc.

Connected Robotics Inc. - Overview
Connected Robotics Inc. - Product / Service
Connected Robotics Inc. - Key offerings
SWOT

15.9 Cook e

Cook e - Overview
Cook e - Product / Service
Cook e - Key offerings
SWOT

15.10 Hyper Food Robotics

Hyper Food Robotics - Overview
Hyper Food Robotics - Product / Service
Hyper Food Robotics - Key offerings
SWOT

15.11 Hyphen

Hyphen - Overview
Hyphen - Product / Service
Hyphen - Key offerings
SWOT

15.12 Miso Robotics Inc.

Miso Robotics Inc. - Overview
Miso Robotics Inc. - Product / Service
Miso Robotics Inc. - Key offerings
SWOT

15.13 Moley Services Ltd.

Moley Services Ltd. - Overview
Moley Services Ltd. - Product / Service
Moley Services Ltd. - Key offerings
SWOT

15.14 Nala Robotics Inc.

Nala Robotics Inc. - Overview
Nala Robotics Inc. - Product / Service
Nala Robotics Inc. - Key offerings
SWOT

15.15 Niryo

Niryo - Overview
Niryo - Product / Service
Niryo - Key offerings
SWOT

15.16 TechMagic Inc.

TechMagic Inc. - Overview
TechMagic Inc. - Product / Service
TechMagic Inc. - Key offerings
SWOT

15.17 XRobotics

XRobotics - Overview
XRobotics - Product / Service
XRobotics - Key offerings
SWOT

15.18 YPC Technologies

YPC Technologies - Overview
YPC Technologies - Product / Service
YPC Technologies - Key offerings
SWOT

16. Appendix

16.1 Scope of the report

Market definition
Objectives
Notes and caveats

16.2 Inclusions and exclusions checklist

Inclusions checklist
Exclusions checklist

16.3 Currency conversion rates for US$

16.4 Research methodology

16.5 Data procurement

Information sources

16.6 Data validation

16.7 Validation techniques employed for market sizing

16.8 Data synthesis

16.9 360 degree market analysis

16.10 List of abbreviations

Research Methodology

Technavio presents a detailed picture of the market by way of study, synthesis, and summation of data from multiple sources. The analysts have presented the various facets of the market with a particular focus on identifying the key industry influencers. The data thus presented is comprehensive, reliable, and the result of extensive research, both primary and secondary.

INFORMATION SOURCES

Primary sources

  • Manufacturers and suppliers
  • Channel partners
  • Industry experts
  • Strategic decision makers

Secondary sources

  • Industry journals and periodicals
  • Government data
  • Financial reports of key industry players
  • Historical data
  • Press releases

DATA ANALYSIS

Data Synthesis

  • Collation of data
  • Estimation of key figures
  • Analysis of derived insights

Data Validation

  • Triangulation with data models
  • Reference against proprietary databases
  • Corroboration with industry experts

REPORT WRITING

Qualitative

  • Market drivers
  • Market challenges
  • Market trends
  • Five forces analysis

Quantitative

  • Market size and forecast
  • Market segmentation
  • Geographical insights
  • Competitive landscape

Interested in this report?

Get your sample now to see our research methodology and insights!

Download Now

Frequently Asked Questions

Robot Kitchen market growth will increase by USD 310800.9 thousand thousand during 2026-2030.

The Robot Kitchen market is expected to grow at a CAGR of 24.6% during 2026-2030.

Robot Kitchen market is segmented by Application (Commercial, Residential) Type (Hardware, Software) Price range (Mid range robots, Budget friendly robots, Premium robots)

Aniai Inc., Appetronix, Armstrong Robotics, Botinkit, Chef Robotics, Cibotica, Connected Robotics Inc., Cook e, GammaChef, Hyper Food Robotics, Hyphen, Miso Robotics Inc., Moley Services Ltd., Nala Robotics Inc., Niryo, Picnic Works Inc., TechMagic Inc., The Chef Robot, XRobotics, YPC Technologies are a few of the key vendors in the Robot Kitchen market.

North America will register the highest growth rate of 40.8% among the other regions. Therefore, the Robot Kitchen market in North America is expected to garner significant business opportunities for the vendors during the forecast period.

US, Canada, Mexico, Germany, UK, France, Italy, Spain, The Netherlands, China, Japan, India, South Korea, Australia, Indonesia, Saudi Arabia, UAE, South Africa, Israel, Turkey, Brazil, Argentina, Chile

  • Increasing use of automation in kitchens is the driving factor this market.

The Robot Kitchen market vendors should focus on grabbing business opportunities from the Application segment as it accounted for the largest market share in the base year.
RIA - Research AI Assistant
Ask RIA