Cafes And Bars Market Analysis, Size, and Forecast 2024-2028: North America (US and Canada), Europe (France, Germany, Italy, and UK), Middle East and Africa (Egypt, KSA, Oman, and UAE), APAC (China, India, and Japan), South America (Argentina and Brazil), and Rest of World (ROW)

Cafes And Bars Market Analysis, Size, and Forecast 2024-2028:
North America (US and Canada), Europe (France, Germany, Italy, and UK), Middle East and Africa (Egypt, KSA, Oman, and UAE), APAC (China, India, and Japan), South America (Argentina and Brazil), and Rest of World (ROW)

Published: Aug 2024 170 Pages SKU: IRTNTR45383

Market Overview at a Glance

$68.8 B
Market Opportunity
4.36%
CAGR
4.12
YoY growth 2023-2024(%)

Cafes And Bars Market Size 2024-2028

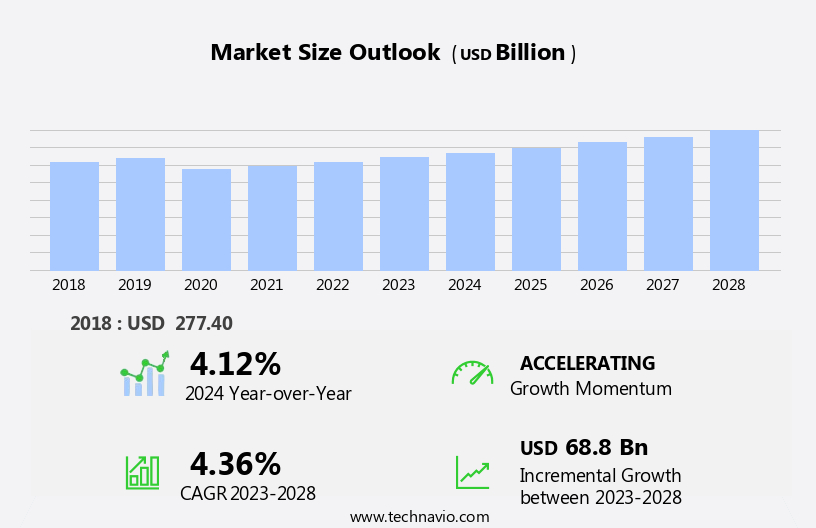
The cafes and bars market size is forecast to increase by USD 68.8 billion, at a CAGR of 4.36% between 2023 and 2028.

  • The market is experiencing significant growth, fueled by the increasing number of establishments catering to diverse consumer preferences. This proliferation of cafes signifies a shift towards more casual dining experiences, offering convenience and flexibility for consumers. This trend is fueled by the changing consumer preferences towards convenient and social dining experiences. Another key driver is the demand for innovation and customization in food menus, which is leading cafes and bars to offer unique and personalized offerings to attract customers. However, the market is not without challenges. The rising popularity of home-cooked meals and the increasing competition from quick-service restaurants pose significant threats.
  • To capitalize on market opportunities and navigate challenges effectively, companies must stay attuned to evolving consumer trends and preferences, continually innovating their offerings and enhancing the customer experience. Additionally, strategic partnerships and collaborations can help cafes and bars differentiate themselves and attract a loyal customer base.

What will be the Size of the Cafes And Bars Market during the forecast period?

Cafes And Bars Market Size

Explore in-depth regional segment analysis with market size data - historical 2018-2022 and forecasts 2024-2028 - in the full report.  
Request Free Sample

In the dynamic and evolving the market, specialty coffee continues to gain popularity, with extraction ratios and roast profiles being meticulously refined through advanced espresso machines. Catering services expand their offerings, integrating sensory evaluation and dessert menus to elevate the customer experience. Restaurant design innovations incorporate bar stools and beer selection, while event hosting requires careful cost control and coffee packaging. Bartending skills and social media marketing are essential for bars, with supply chain optimization and loyalty programs enhancing customer engagement. Employee training and beverage dispensing systems ensure consistency, while roast profiles and brewing methods cater to diverse preferences.

Health inspections, food safety, and fair trade coffee are crucial components of the industry, with ethical sourcing and inventory management shaping the supply chain. Waste management and marketing strategies are also vital for sustainability and profitability. Cafes and bars adapt to the continuous unfolding of market activities, integrating organic coffee, milk frothing techniques, and nitrogen infusion into their offerings. Coffee cupping and food pairing provide unique experiences, while Instant Coffee and staff scheduling streamline operations. The market remains a dynamic and ever-evolving landscape, with hygiene standards, water filtration, and pricing strategies shaping the competitive landscape. Quality control and wine lists add depth to the customer experience, making this industry a fascinating and continuously unfolding business environment.

How is this Cafes And Bars Industry segmented?

The cafes and bars industry research report provides comprehensive data (region-wise segment analysis), with forecasts and estimates in "USD billion" for the period 2024-2028, as well as historical data from 2018-2022 for the following segments.

  • Product
    • Beverages
    • Food
  • Type
    • Bars and pubs
    • Cafes
    • Specialty coffee shops
  • Service Mode
    • Dine-In
    • Takeaway
    • Delivery
  • Cuisine Type
    • Specialty Coffee
    • Alcoholic Beverages
    • Ethnic Snacks
    • Traditional Snacks
  • Geography
    • North America
      • US
      • Canada
    • Europe
      • France
      • Germany
      • Italy
      • UK
    • Middle East and Africa
      • Egypt
      • KSA
      • Oman
      • UAE
    • APAC
      • China
      • India
      • Japan
    • South America
      • Argentina
      • Brazil
    • Rest of World (ROW)

By Product Insights

The beverages segment is estimated to witness significant growth during the forecast period.

In The market, the food segment is experiencing significant growth due to consumers' increasing preference for quick breakfast options. Despite beverages dominating sales in developed countries like North America and Europe, the trend of purchasing convenient breakfast foods from cafes and bars is on the rise. This shift is attributed to people's hectic lifestyles and the availability of a variety of food items. Popular offerings include cakes, pastries, doughnuts, sandwiches, burgers, pizza, and chocolates. Coffee shops also sell packaged side items. Snacking options, such as doughnuts and sandwiches, are increasingly popular among consumers worldwide. Catering services are another growing trend in the market, providing customized food options for events and offices.

The coffee shop layout and atmosphere play a crucial role in attracting customers, with many focusing on creating a harmonious and immersive experience. Sensory evaluation is essential in ensuring the quality of food offerings, while ethical sourcing and fair trade practices are prioritized to meet customer demands. Food safety, inventory management, and cost control are essential aspects of running a successful cafes and bars business. Additionally, marketing strategies, pricing strategies, and social media marketing are crucial in reaching and retaining customers. The food segment's growth is further driven by the availability of various brewing methods, including cold brew coffee and nitrogen infusion, and the increasing popularity of specialty coffee, decaf coffee, and organic coffee.

Employee training and customer service are key to providing a memorable experience, while beverage dispensing systems and coffee packaging ensure consistency and convenience. Overall, the market is dynamic and evolving, with a focus on providing high-quality food and beverage offerings, innovative brewing methods, and exceptional customer experiences.

Cafes And Bars Market Size

Request Free Sample

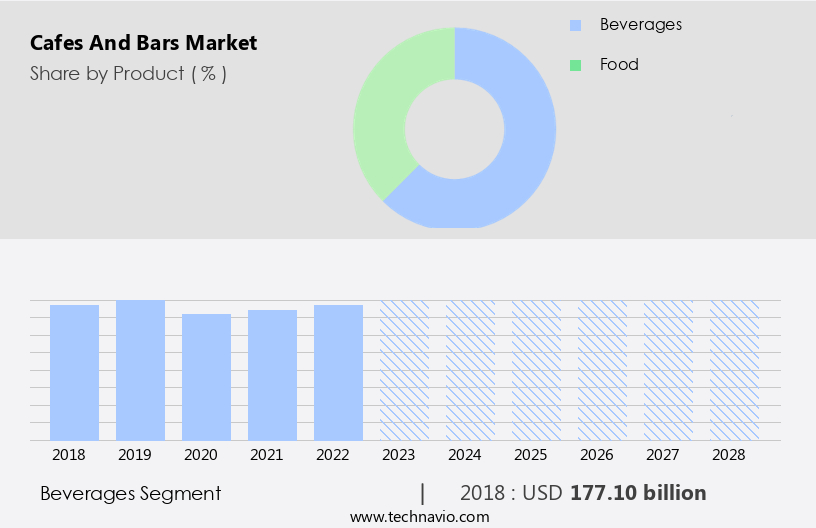
The Beverages segment was valued at USD 177.10 billion in 2018 and showed a gradual increase during the forecast period.

Regional Analysis

Europe is estimated to contribute 44% to the growth of the global market during the forecast period.Technavio's analysts have elaborately explained the regional trends and drivers that shape the market during the forecast period.

Cafes And Bars Market Share by Geography

 Request Free Sample

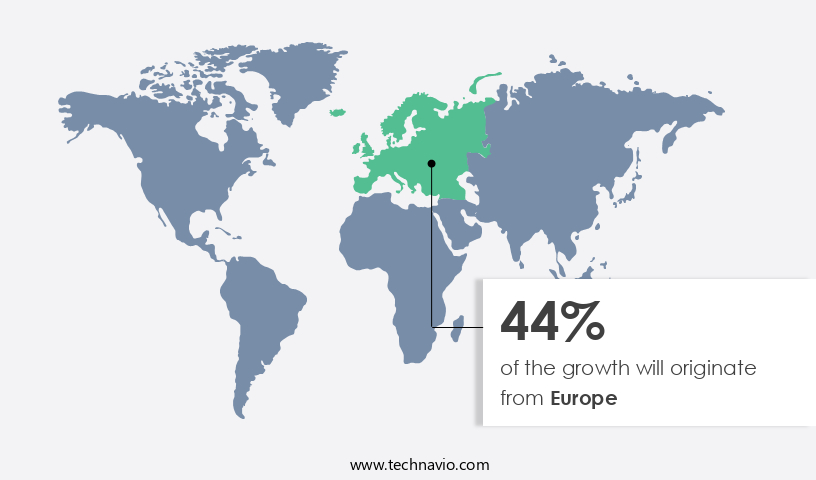
The European market is experiencing growth due to the rising demand for healthier on-the-go food options. Key European markets include the UK, Germany, France, Spain, Italy, and Russia. To cater to this trend, cafes and bars are expanding their menus with fresh, healthier fast food choices. These offerings include more mixed salads, whole wheat bread, and low-calorie meals. companies are also focusing on preparing meals with fewer amounts of fats, sodium, sugar, artificial colors, and food additives. Additionally, coffee shops are incorporating various brewing methods, such as espresso machines and cold brew coffee, to cater to diverse customer preferences.

Ethical sourcing and sustainable practices, including fair trade coffee and direct trade, are becoming increasingly important to consumers. Cafes and bars are also investing in staff training, customer service, and supply chain management to ensure consistent quality and efficiency. Beverage dispensing systems, milk frothing, and sensory evaluation techniques are used to maintain the highest standards of coffee preparation. Inventory management, health inspections, and food safety regulations are crucial elements of restaurant design and operation. Social media marketing and loyalty programs are essential tools for attracting and retaining customers. Cafes and bars are also exploring waste management solutions and marketing strategies to reduce their environmental impact.

Pricing strategies, water filtration, and quality control are other critical factors influencing the market's dynamics.

Market Dynamics

Our researchers analyzed the data with 2023 as the base year, along with the key drivers, trends, and challenges. A holistic analysis of drivers will help companies refine their marketing strategies to gain a competitive advantage.

Nestled in the heart of bustling urban areas and picturesque town centers, cafes and bars have become integral parts of modern life, offering more than just a place to grab a quick coffee or unwind with a drink. These social hubs cater to diverse clientele, providing not only refreshing beverages and delectable snacks but also a welcoming atmosphere where people can connect, collaborate, and create. From artisanal roasts and locally sourced ingredients to innovative cocktails and comfortable seating, cafes and bars continue to evolve, integrating technology, sustainability, and community engagement. Whether a casual meetup spot or a destination for special occasions, these establishments foster a sense of belonging and contribute significantly to the local economy and cultural landscape. 

What are the key market drivers leading to the rise in the adoption of Cafes And Bars Industry?

  • The proliferation of cafes serves as the primary catalyst for market growth. 
  • The expanding urban population and the increasing preference for socializing at cafes are key factors fueling the growth of the market. According to the World Bank Group, over 56% of the global population resided in urban areas in 2020, and this figure is projected to reach 60% by 2030. The rapid expansion of urban areas is leading to an increase in the number of white-collar workers, thereby driving the demand for food service outlets. Cafes and bars have become popular social hubs, offering a range of beverages, including single-origin coffees, and food items, such as desserts. The focus on providing high-quality coffee beans, extraction ratios, and milk frothing using espresso machines has become essential to cater to the evolving consumer preferences.
  • Sensory evaluation plays a crucial role in ensuring the quality of coffee and desserts, making it essential for cafes and bars to invest in advanced equipment and training for their staff. Moreover, the dessert menu and seating arrangements, including bar stools, contribute to the overall dining experience. The beverage selection extends beyond coffee, with many cafes and bars offering a diverse range of beer options to cater to a broader customer demographic. The trend towards organic coffee and coffee beans is also gaining traction, as consumers become more health-conscious and environmentally aware. In conclusion, the market is expected to witness significant growth due to the increasing urban population, evolving consumer preferences, and the importance of providing an immersive and harmonious dining experience.

What are the market trends shaping the Cafes And Bars Industry?

  • The trend in the food industry is shifting towards greater demand for innovation and customization in menus. This mandate for personalized offerings reflects the growing expectation among consumers for unique and tailored dining experiences.
  • The cafe and bars market is experiencing significant growth due to the increasing preference for unique and customizable food and beverage offerings. Consumers, particularly millennials, seek innovative flavors and the ability to personalize their experiences. For instance, lease agreements for coffee shops often include provisions for diverse menu offerings, such as cold brew coffee, nitrogen-infused coffee, and various grinding techniques. Franchise opportunities in this sector allow entrepreneurs to provide these options while adhering to ethical sourcing practices, ensuring the use of high-quality beans like robusta. Moreover, the café atmosphere is increasingly immersive and harmonious, with a focus on staff scheduling and efficient service.
  • The cocktail menu, a staple in bars, is expanding to include an array of creative concoctions. Coffee cupping sessions are becoming popular events where patrons can sample various brews and learn about their distinct flavors. The market also caters to consumers with dietary restrictions and preferences, offering instant coffee options and alternative milk choices. As the demand for customization continues to surge, businesses are responding with innovative solutions, ensuring a satisfying and memorable experience for their customers.

What challenges does the Cafes And Bars Industry face during its growth?

  • The increasing preference for home-cooked meals poses a significant threat to the expansion of the food industry. 
  • The specialty the market is experiencing significant growth due to various factors. One key trend is the increasing preference for high-quality coffee, including decaf options, among consumers. This has led to a focus on restaurant design that creates an immersive and harmonious atmosphere, enhancing the overall customer experience. Event hosting has also become a popular offering for cafes and bars, providing additional revenue streams. Cost control is a crucial aspect of the market, with coffee packaging and employee training being essential areas of focus. Bartending skills are increasingly important, particularly in bars, as consumers seek unique and personalized beverage experiences.
  • Social media marketing plays a significant role in attracting and retaining customers, with supply chain efficiency and loyalty programs also contributing to business success. Beverage dispensing systems and roast profiles are other key market dynamics, with advancements in technology enabling greater customization and consistency. Effective supply chain management and employee training programs are essential for maintaining quality and ensuring customer satisfaction. In conclusion, the specialty the market is driven by consumer preferences for high-quality coffee, unique experiences, and health-conscious options, with innovation and efficiency key to staying competitive.

Exclusive Customer Landscape

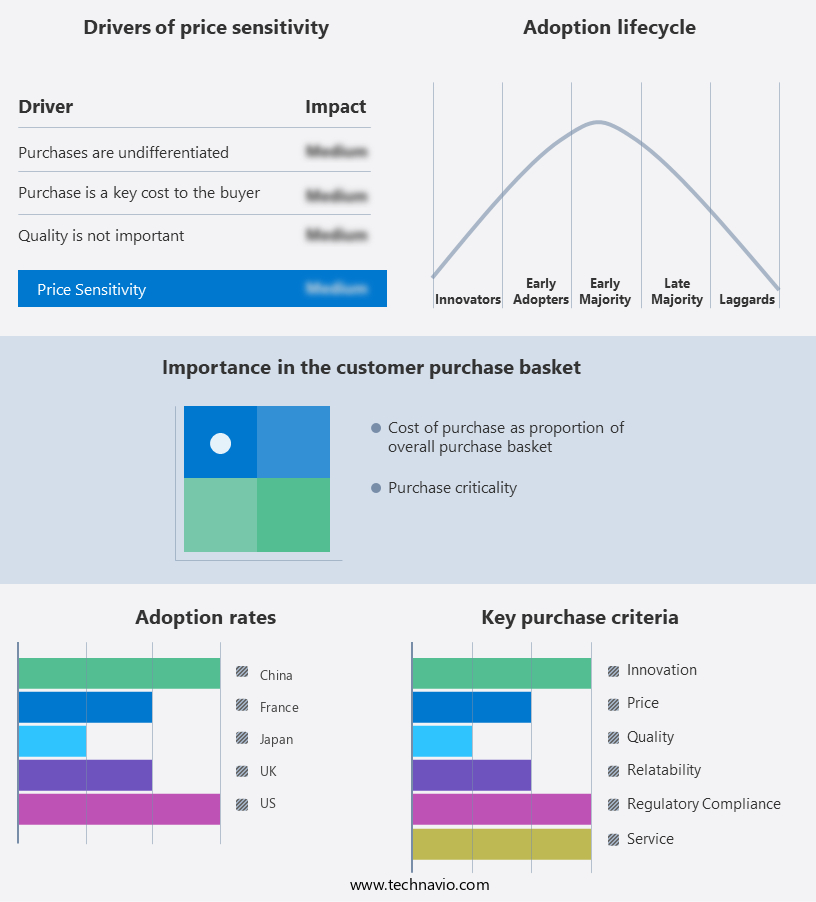
The cafes and bars market forecasting report includes the adoption lifecycle of the market, covering from the innovator's stage to the laggard's stage. It focuses on adoption rates in different regions based on penetration. Furthermore, the cafes and bars market report also includes key purchase criteria and drivers of price sensitivity to help companies evaluate and develop their market growth analysis strategies.

Cafes And Bars Market Share by Geography

 Customer Landscape

Key Companies & Market Insights

Companies are implementing various strategies, such as strategic alliances, cafes and bars market forecast, partnerships, mergers and acquisitions, geographical expansion, and product/service launches, to enhance their presence in the industry.

Berkshire Hathaway Inc. - This company specializes in operating cafes and bars, showcasing a unique and original approach to the hospitality industry. 

The industry research and growth report includes detailed analyses of the competitive landscape of the market and information about key companies, including:

  • Berkshire Hathaway Inc.
  • BJs Restaurants Inc.
  • Brinker International Inc.
  • Caffe Nero Group Ltd
  • Caribou Coffee Operating Co. Inc.
  • Coffee Day Enterprises Ltd.
  • Doutor Coffee Co. Ltd.
  • Ediya Co. Ltd.
  • Inspire Brands Inc.
  • JAB Holding Co.
  • Jollibee Foods Corp.
  • LUIGI LAVAZZA SpA
  • McDonald Corp.
  • Red Robin Gourmet Burgers Inc.
  • Restaurant Brands International Inc.
  • Starbucks Corp.
  • Stonegate Pub Co. Ltd.
  • The Coca Cola Co.
  • Whitbread PLC
  • YUM Brands Inc.

Qualitative and quantitative analysis of companies has been conducted to help clients understand the wider business environment as well as the strengths and weaknesses of key industry players. Data is qualitatively analyzed to categorize companies as pure play, category-focused, industry-focused, and diversified; it is quantitatively analyzed to categorize companies as dominant, leading, strong, tentative, and weak.

Recent Development and News in Cafes And Bars Market

  • In January 2024, Starbucks Corporation announced the launch of its new plant-based protein beverage, the "Plant-Based Protein Refresher," in collaboration with plant-based protein company, Ripple Foods (Bloomberg). This strategic partnership marked Starbucks' commitment to expanding its plant-based offerings in response to growing consumer demand for sustainable and ethical food choices.
  • In March 2024, Dunkin' Brands Group, Inc. And JAB Holding Company entered into a definitive agreement for JAB to acquire a controlling stake in Dunkin' Brands (Reuters). The transaction, valued at approximately USD11.3 billion, represented a significant shift in the ownership structure of the global coffee and baked goods chain.
  • In April 2025, Costa Coffee, a leading UK-based coffee chain, secured approval from the UK government to pilot a contactless ordering system using facial recognition technology in select stores (Government Digital Service press release). The initiative aimed to streamline the ordering process and improve customer experience while adhering to social distancing guidelines.
  • In May 2025, McDonald's Corporation announced a strategic partnership with Deliveroo, the UK-based food delivery company, to expand its delivery capabilities across Europe (McDonald's press release). The collaboration marked McDonald's entry into the growing food delivery market and represented a significant expansion of its offerings to meet evolving consumer preferences.

Research Analyst Overview

  • In the dynamic market, atmospheric design plays a crucial role in customer retention, creating inviting spaces that foster community engagement. Online ordering and delivery services cater to the convenience-driven consumer, while sales forecasting and menu engineering help cafes optimize food cost control and profit margin. Roasting techniques and beverage innovation differentiate brands, providing a competitive advantage. Risk management, waste reduction, and financial projections are essential for long-term success. Technology adoption, including data analytics and espresso machine maintenance, streamlines operations and enhances the customer experience.
  • Brands focus on brand loyalty through content marketing, public relations, media outreach, and local partnerships. Seasonal promotions and sustainability initiatives resonate with consumers, driving sales reports. Employee management, rent negotiation, and supplier relationships are key areas for labor cost control and bean sourcing. Barista skills remain a critical factor in coffee production and customer feedback, ensuring a high-quality product and positive reviews.

Dive into Technavio's robust research methodology, blending expert interviews, extensive data synthesis, and validated models for unparalleled Cafes And Bars Market insights. See full methodology.

Market Scope

Report Coverage

Details

Page number

170

Base year

2023

Historic period

2018-2022

Forecast period

2024-2028

Growth momentum & CAGR

Accelerate at a CAGR of 4.36%

Market growth 2024-2028

USD 68.8 billion

Market structure

Fragmented

YoY growth 2023-2024(%)

4.12

Key countries

US, Canada, Germany, UK, Italy, France, China, India, Japan, Brazil, Egypt, UAE, Oman, Argentina, KSA, UAE, Brazil, and Rest of World (ROW)

Competitive landscape

Leading Companies, Market Positioning of Companies, Competitive Strategies, and Industry Risks

Request Free Sample

What are the Key Data Covered in this Cafes And Bars Market Research and Growth Report?

  • CAGR of the Cafes And Bars industry during the forecast period
  • Detailed information on factors that will drive the growth and forecasting between 2024 and 2028
  • Precise estimation of the size of the market and its contribution of the industry in focus to the parent market
  • Accurate predictions about upcoming growth and trends and changes in consumer behaviour
  • Growth of the market across Europe, APAC, North America, Middle East and Africa, and South America
  • Thorough analysis of the market's competitive landscape and detailed information about companies
  • Comprehensive analysis of factors that will challenge the cafes and bars market growth of industry companies

We can help! Our analysts can customize this cafes and bars market research report to meet your requirements.

Get in touch

1 Executive Summary

  • 1.1 Market overview
    • Executive Summary - Chart on Market Overview
    • Executive Summary - Data Table on Market Overview
    • Executive Summary - Chart on Global Market Characteristics
    • Executive Summary - Chart on Market by Geography
    • Executive Summary - Chart on Market Segmentation by Product
    • Executive Summary - Chart on Market Segmentation by Type
    • Executive Summary - Chart on Incremental Growth
    • Executive Summary - Data Table on Incremental Growth
    • Executive Summary - Chart on Company Market Positioning

2 Market Landscape

  • 2.1 Market ecosystem
    • Parent Market
    • Data Table on - Parent Market
  • 2.2 Market characteristics
    • Market characteristics analysis
  • 2.3 Value chain analysis
    • Value Chain Analysis

3 Market Sizing

  • 3.1 Market definition
    • Offerings of companies included in the market definition
  • 3.2 Market segment analysis
    • Market segments
  • 3.3 Market size 2023
    • 3.4 Market outlook: Forecast for 2023-2028
      • Chart on Global - Market size and forecast 2023-2028 ($ billion)
      • Data Table on Global - Market size and forecast 2023-2028 ($ billion)
      • Chart on Global Market: Year-over-year growth 2023-2028 (%)
      • Data Table on Global Market: Year-over-year growth 2023-2028 (%)

    4 Historic Market Size

    • 4.1 Global Cafes And Bars Market 2018 - 2022
      • Historic Market Size - Data Table on Global Cafes And Bars Market 2018 - 2022 ($ billion)
    • 4.2 Product segment analysis 2018 - 2022
      • Historic Market Size - Product Segment 2018 - 2022 ($ billion)
    • 4.3 Type segment analysis 2018 - 2022
      • Historic Market Size - Type Segment 2018 - 2022 ($ billion)
    • 4.4 Geography segment analysis 2018 - 2022
      • Historic Market Size - Geography Segment 2018 - 2022 ($ billion)
    • 4.5 Country segment analysis 2018 - 2022
      • Historic Market Size - Country Segment 2018 - 2022 ($ billion)

    5 Five Forces Analysis

    • 5.1 Five forces summary
      • Five forces analysis - Comparison between 2023 and 2028
    • 5.2 Bargaining power of buyers
      • Bargaining power of buyers - Impact of key factors 2023 and 2028
    • 5.3 Bargaining power of suppliers
      • Bargaining power of suppliers - Impact of key factors in 2023 and 2028
    • 5.4 Threat of new entrants
      • Threat of new entrants - Impact of key factors in 2023 and 2028
    • 5.5 Threat of substitutes
      • Threat of substitutes - Impact of key factors in 2023 and 2028
    • 5.6 Threat of rivalry
      • Threat of rivalry - Impact of key factors in 2023 and 2028
    • 5.7 Market condition
      • Chart on Market condition - Five forces 2023 and 2028

    6 Market Segmentation by Product

    • 6.1 Market segments
      • Chart on Product - Market share (2023-2028) (%)
      • Data Table on Product - Market share (2023-2028) (%)
    • 6.2 Comparison by Product
      • Chart on Comparison by Product
      • Data Table on Comparison by Product
    • 6.3 Beverages - Market size and forecast (2023-2028)
      • Chart on Beverages - Market size and forecast (2023-2028) ($ billion)
      • Data Table on Beverages - Market size and forecast (2023-2028) ($ billion)
      • Chart on Beverages - Year-over-year growth (2023-2028) (%)
      • Data Table on Beverages - Year-over-year growth (2023-2028) (%)
    • 6.4 Food - Market size and forecast (2023-2028)
      • Chart on Food - Market size and forecast (2023-2028) ($ billion)
      • Data Table on Food - Market size and forecast (2023-2028) ($ billion)
      • Chart on Food - Year-over-year growth (2023-2028) (%)
      • Data Table on Food - Year-over-year growth (2023-2028) (%)
    • 6.5 Market opportunity by Product
      • Market opportunity by Product ($ billion)
      • Data Table on Market opportunity by Product ($ billion)

    7 Market Segmentation by Type

    • 7.1 Market segments
      • Chart on Type - Market share (2023-2028) (%)
      • Data Table on Type - Market share (2023-2028) (%)
    • 7.2 Comparison by Type
      • Chart on Comparison by Type
      • Data Table on Comparison by Type
    • 7.3 Bars and pubs - Market size and forecast (2023-2028)
      • Chart on Bars and pubs - Market size and forecast (2023-2028) ($ billion)
      • Data Table on Bars and pubs - Market size and forecast (2023-2028) ($ billion)
      • Chart on Bars and pubs - Year-over-year growth (2023-2028) (%)
      • Data Table on Bars and pubs - Year-over-year growth (2023-2028) (%)
    • 7.4 Cafes - Market size and forecast (2023-2028)
      • Chart on Cafes - Market size and forecast (2023-2028) ($ billion)
      • Data Table on Cafes - Market size and forecast (2023-2028) ($ billion)
      • Chart on Cafes - Year-over-year growth (2023-2028) (%)
      • Data Table on Cafes - Year-over-year growth (2023-2028) (%)
    • 7.5 Specialty coffee shops - Market size and forecast (2023-2028)
      • Chart on Specialty coffee shops - Market size and forecast (2023-2028) ($ billion)
      • Data Table on Specialty coffee shops - Market size and forecast (2023-2028) ($ billion)
      • Chart on Specialty coffee shops - Year-over-year growth (2023-2028) (%)
      • Data Table on Specialty coffee shops - Year-over-year growth (2023-2028) (%)
    • 7.6 Market opportunity by Type
      • Market opportunity by Type ($ billion)
      • Data Table on Market opportunity by Type ($ billion)

    8 Market Segmentation by Service Mode

    • 8.1 Market segments
      • Chart on Service Mode - Market share (2023-2028) (%)
      • Data Table on Service Mode - Market share (2023-2028) (%)
    • 8.2 Comparison by Service Mode
      • Chart on Comparison by Service Mode
      • Data Table on Comparison by Service Mode
    • 8.3 Dine-In - Market size and forecast (2023-2028)
      • Chart on Dine-In - Market size and forecast (2023-2028) ($ billion)
      • Data Table on Dine-In - Market size and forecast (2023-2028) ($ billion)
      • Chart on Dine-In - Year-over-year growth (2023-2028) (%)
      • Data Table on Dine-In - Year-over-year growth (2023-2028) (%)
    • 8.4 Takeaway - Market size and forecast (2023-2028)
      • Chart on Takeaway - Market size and forecast (2023-2028) ($ billion)
      • Data Table on Takeaway - Market size and forecast (2023-2028) ($ billion)
      • Chart on Takeaway - Year-over-year growth (2023-2028) (%)
      • Data Table on Takeaway - Year-over-year growth (2023-2028) (%)
    • 8.5 Delivery - Market size and forecast (2023-2028)
      • Chart on Delivery - Market size and forecast (2023-2028) ($ billion)
      • Data Table on Delivery - Market size and forecast (2023-2028) ($ billion)
      • Chart on Delivery - Year-over-year growth (2023-2028) (%)
      • Data Table on Delivery - Year-over-year growth (2023-2028) (%)
    • 8.6 Market opportunity by Service Mode
      • Market opportunity by Service Mode ($ billion)
      • Data Table on Market opportunity by Service Mode ($ billion)

    9 Market Segmentation by Cuisine Type

    • 9.1 Market segments
      • Chart on Cuisine Type - Market share (2023-2028) (%)
      • Data Table on Cuisine Type - Market share (2023-2028) (%)
    • 9.2 Comparison by Cuisine Type
      • Chart on Comparison by Cuisine Type
      • Data Table on Comparison by Cuisine Type
    • 9.3 Specialty Coffee - Market size and forecast (2023-2028)
      • Chart on Specialty Coffee - Market size and forecast (2023-2028) ($ billion)
      • Data Table on Specialty Coffee - Market size and forecast (2023-2028) ($ billion)
      • Chart on Specialty Coffee - Year-over-year growth (2023-2028) (%)
      • Data Table on Specialty Coffee - Year-over-year growth (2023-2028) (%)
    • 9.4 Alcoholic Beverages - Market size and forecast (2023-2028)
      • Chart on Alcoholic Beverages - Market size and forecast (2023-2028) ($ billion)
      • Data Table on Alcoholic Beverages - Market size and forecast (2023-2028) ($ billion)
      • Chart on Alcoholic Beverages - Year-over-year growth (2023-2028) (%)
      • Data Table on Alcoholic Beverages - Year-over-year growth (2023-2028) (%)
    • 9.5 Ethnic Snacks - Market size and forecast (2023-2028)
      • Chart on Ethnic Snacks - Market size and forecast (2023-2028) ($ billion)
      • Data Table on Ethnic Snacks - Market size and forecast (2023-2028) ($ billion)
      • Chart on Ethnic Snacks - Year-over-year growth (2023-2028) (%)
      • Data Table on Ethnic Snacks - Year-over-year growth (2023-2028) (%)
    • 9.6 Traditional Snacks - Market size and forecast (2023-2028)
      • Chart on Traditional Snacks - Market size and forecast (2023-2028) ($ billion)
      • Data Table on Traditional Snacks - Market size and forecast (2023-2028) ($ billion)
      • Chart on Traditional Snacks - Year-over-year growth (2023-2028) (%)
      • Data Table on Traditional Snacks - Year-over-year growth (2023-2028) (%)
    • 9.7 Market opportunity by Cuisine Type
      • Market opportunity by Cuisine Type ($ billion)
      • Data Table on Market opportunity by Cuisine Type ($ billion)

    10 Customer Landscape

    • 10.1 Customer landscape overview
      • Analysis of price sensitivity, lifecycle, customer purchase basket, adoption rates, and purchase criteria

    11 Geographic Landscape

    • 11.1 Geographic segmentation
      • Chart on Market share by geography 2023-2028 (%)
      • Data Table on Market share by geography 2023-2028 (%)
    • 11.2 Geographic comparison
      • Chart on Geographic comparison
      • Data Table on Geographic comparison
    • 11.3 Europe - Market size and forecast 2023-2028
      • Chart on Europe - Market size and forecast 2023-2028 ($ billion)
      • Data Table on Europe - Market size and forecast 2023-2028 ($ billion)
      • Chart on Europe - Year-over-year growth 2023-2028 (%)
      • Data Table on Europe - Year-over-year growth 2023-2028 (%)
    • 11.4 APAC - Market size and forecast 2023-2028
      • Chart on APAC - Market size and forecast 2023-2028 ($ billion)
      • Data Table on APAC - Market size and forecast 2023-2028 ($ billion)
      • Chart on APAC - Year-over-year growth 2023-2028 (%)
      • Data Table on APAC - Year-over-year growth 2023-2028 (%)
    • 11.5 North America - Market size and forecast 2023-2028
      • Chart on North America - Market size and forecast 2023-2028 ($ billion)
      • Data Table on North America - Market size and forecast 2023-2028 ($ billion)
      • Chart on North America - Year-over-year growth 2023-2028 (%)
      • Data Table on North America - Year-over-year growth 2023-2028 (%)
    • 11.6 Middle East and Africa - Market size and forecast 2023-2028
      • Chart on Middle East and Africa - Market size and forecast 2023-2028 ($ billion)
      • Data Table on Middle East and Africa - Market size and forecast 2023-2028 ($ billion)
      • Chart on Middle East and Africa - Year-over-year growth 2023-2028 (%)
      • Data Table on Middle East and Africa - Year-over-year growth 2023-2028 (%)
    • 11.7 South America - Market size and forecast 2023-2028
      • Chart on South America - Market size and forecast 2023-2028 ($ billion)
      • Data Table on South America - Market size and forecast 2023-2028 ($ billion)
      • Chart on South America - Year-over-year growth 2023-2028 (%)
      • Data Table on South America - Year-over-year growth 2023-2028 (%)
    • 11.8 US - Market size and forecast 2023-2028
      • Chart on US - Market size and forecast 2023-2028 ($ billion)
      • Data Table on US - Market size and forecast 2023-2028 ($ billion)
      • Chart on US - Year-over-year growth 2023-2028 (%)
      • Data Table on US - Year-over-year growth 2023-2028 (%)
    • 11.9 China - Market size and forecast 2023-2028
      • Chart on China - Market size and forecast 2023-2028 ($ billion)
      • Data Table on China - Market size and forecast 2023-2028 ($ billion)
      • Chart on China - Year-over-year growth 2023-2028 (%)
      • Data Table on China - Year-over-year growth 2023-2028 (%)
    • 11.10 Japan - Market size and forecast 2023-2028
      • Chart on Japan - Market size and forecast 2023-2028 ($ billion)
      • Data Table on Japan - Market size and forecast 2023-2028 ($ billion)
      • Chart on Japan - Year-over-year growth 2023-2028 (%)
      • Data Table on Japan - Year-over-year growth 2023-2028 (%)
    • 11.11 UK - Market size and forecast 2023-2028
      • Chart on UK - Market size and forecast 2023-2028 ($ billion)
      • Data Table on UK - Market size and forecast 2023-2028 ($ billion)
      • Chart on UK - Year-over-year growth 2023-2028 (%)
      • Data Table on UK - Year-over-year growth 2023-2028 (%)
    • 11.12 France - Market size and forecast 2023-2028
      • Chart on France - Market size and forecast 2023-2028 ($ billion)
      • Data Table on France - Market size and forecast 2023-2028 ($ billion)
      • Chart on France - Year-over-year growth 2023-2028 (%)
      • Data Table on France - Year-over-year growth 2023-2028 (%)
    • 11.13 Market opportunity by geography
      • Market opportunity by geography ($ billion)
      • Data Tables on Market opportunity by geography ($ billion)
    • 11.14 Canada - Market size and forecast (2023-2028)
      • Chart on Canada - Market size and forecast (2023-2028) ($ billion)
      • Data Table on Canada - Market size and forecast (2023-2028) ($ billion)
      • Chart on Canada - Year-over-year growth (2023-2028) (%)
      • Data Table on Canada - Year-over-year growth (2023-2028) (%)
    • 11.15 Germany - Market size and forecast (2023-2028)
      • Chart on Germany - Market size and forecast (2023-2028) ($ billion)
      • Data Table on Germany - Market size and forecast (2023-2028) ($ billion)
      • Chart on Germany - Year-over-year growth (2023-2028) (%)
      • Data Table on Germany - Year-over-year growth (2023-2028) (%)
    • 11.16 Italy - Market size and forecast (2023-2028)
      • Chart on Italy - Market size and forecast (2023-2028) ($ billion)
      • Data Table on Italy - Market size and forecast (2023-2028) ($ billion)
      • Chart on Italy - Year-over-year growth (2023-2028) (%)
      • Data Table on Italy - Year-over-year growth (2023-2028) (%)
    • 11.17 India - Market size and forecast (2023-2028)
      • Chart on India - Market size and forecast (2023-2028) ($ billion)
      • Data Table on India - Market size and forecast (2023-2028) ($ billion)
      • Chart on India - Year-over-year growth (2023-2028) (%)
      • Data Table on India - Year-over-year growth (2023-2028) (%)
    • 11.18 Brazil - Market size and forecast (2023-2028)
      • Chart on Brazil - Market size and forecast (2023-2028) ($ billion)
      • Data Table on Brazil - Market size and forecast (2023-2028) ($ billion)
      • Chart on Brazil - Year-over-year growth (2023-2028) (%)
      • Data Table on Brazil - Year-over-year growth (2023-2028) (%)
    • 11.19 Egypt - Market size and forecast (2023-2028)
      • Chart on Egypt - Market size and forecast (2023-2028) ($ billion)
      • Data Table on Egypt - Market size and forecast (2023-2028) ($ billion)
      • Chart on Egypt - Year-over-year growth (2023-2028) (%)
      • Data Table on Egypt - Year-over-year growth (2023-2028) (%)
    • 11.20 UAE - Market size and forecast (2023-2028)
      • Chart on UAE - Market size and forecast (2023-2028) ($ billion)
      • Data Table on UAE - Market size and forecast (2023-2028) ($ billion)
      • Chart on UAE - Year-over-year growth (2023-2028) (%)
      • Data Table on UAE - Year-over-year growth (2023-2028) (%)
    • 11.21 Oman - Market size and forecast (2023-2028)
      • Chart on Oman - Market size and forecast (2023-2028) ($ billion)
      • Data Table on Oman - Market size and forecast (2023-2028) ($ billion)
      • Chart on Oman - Year-over-year growth (2023-2028) (%)
      • Data Table on Oman - Year-over-year growth (2023-2028) (%)
    • 11.22 Argentina - Market size and forecast (2023-2028)
      • Chart on Argentina - Market size and forecast (2023-2028) ($ billion)
      • Data Table on Argentina - Market size and forecast (2023-2028) ($ billion)
      • Chart on Argentina - Year-over-year growth (2023-2028) (%)
      • Data Table on Argentina - Year-over-year growth (2023-2028) (%)
    • 11.23 KSA - Market size and forecast (2023-2028)
      • Chart on KSA - Market size and forecast (2023-2028) ($ billion)
      • Data Table on KSA - Market size and forecast (2023-2028) ($ billion)
      • Chart on KSA - Year-over-year growth (2023-2028) (%)
      • Data Table on KSA - Year-over-year growth (2023-2028) (%)
    • 11.24 Rest of World (ROW) - Market size and forecast (2023-2028)
      • Chart on Rest of World (ROW) - Market size and forecast (2023-2028) ($ billion)
      • Data Table on Rest of World (ROW) - Market size and forecast (2023-2028) ($ billion)
      • Chart on Rest of World (ROW) - Year-over-year growth (2023-2028) (%)
      • Data Table on Rest of World (ROW) - Year-over-year growth (2023-2028) (%)

    12 Drivers, Challenges, and Opportunity/Restraints

    • 12.1 Market drivers
      • 12.2 Market challenges
        • 12.3 Impact of drivers and challenges
          • Impact of drivers and challenges in 2023 and 2028
        • 12.4 Market opportunities/restraints

          13 Competitive Landscape

          • 13.1 Overview
            • 13.2 Competitive Landscape
              • Overview on criticality of inputs and factors of differentiation
            • 13.3 Landscape disruption
              • Overview on factors of disruption
            • 13.4 Industry risks
              • Impact of key risks on business

            14 Competitive Analysis

            • 14.1 Companies profiled
              • Companies covered
            • 14.2 Market positioning of companies
              • Matrix on companies position and classification
            • 14.3 Caffe Nero Group Ltd
              • Caffe Nero Group Ltd - Overview
              • Caffe Nero Group Ltd - Product / Service
              • Caffe Nero Group Ltd - Key offerings
            • 14.4 Caribou Coffee Operating Co. Inc.
              • Caribou Coffee Operating Co. Inc. - Overview
              • Caribou Coffee Operating Co. Inc. - Product / Service
              • Caribou Coffee Operating Co. Inc. - Key offerings
            • 14.5 Coffee Day Enterprises Ltd.
              • Coffee Day Enterprises Ltd. - Overview
              • Coffee Day Enterprises Ltd. - Business segments
              • Coffee Day Enterprises Ltd. - Key offerings
              • Coffee Day Enterprises Ltd. - Segment focus
            • 14.6 Doutor Coffee Co. Ltd.
              • Doutor Coffee Co. Ltd. - Overview
              • Doutor Coffee Co. Ltd. - Product / Service
              • Doutor Coffee Co. Ltd. - Key offerings
            • 14.7 Ediya Co. Ltd.
              • Ediya Co. Ltd. - Overview
              • Ediya Co. Ltd. - Product / Service
              • Ediya Co. Ltd. - Key offerings
            • 14.8 Inspire Brands Inc.
              • Inspire Brands Inc. - Overview
              • Inspire Brands Inc. - Product / Service
              • Inspire Brands Inc. - Key offerings
            • 14.9 JAB Holding Co.
              • JAB Holding Co. - Overview
              • JAB Holding Co. - Product / Service
              • JAB Holding Co. - Key offerings
            • 14.10 Jollibee Foods Corp.
              • Jollibee Foods Corp. - Overview
              • Jollibee Foods Corp. - Business segments
              • Jollibee Foods Corp. - Key offerings
              • Jollibee Foods Corp. - Segment focus
            • 14.11 LUIGI LAVAZZA SpA
              • LUIGI LAVAZZA SpA - Overview
              • LUIGI LAVAZZA SpA - Product / Service
              • LUIGI LAVAZZA SpA - Key offerings
            • 14.12 McDonald Corp.
              • McDonald Corp. - Overview
              • McDonald Corp. - Business segments
              • McDonald Corp. - Key news
              • McDonald Corp. - Key offerings
              • McDonald Corp. - Segment focus
            • 14.13 Restaurant Brands International Inc.
              • Restaurant Brands International Inc. - Overview
              • Restaurant Brands International Inc. - Business segments
              • Restaurant Brands International Inc. - Key news
              • Restaurant Brands International Inc. - Key offerings
              • Restaurant Brands International Inc. - Segment focus
            • 14.14 Starbucks Corp.
              • Starbucks Corp. - Overview
              • Starbucks Corp. - Business segments
              • Starbucks Corp. - Key news
              • Starbucks Corp. - Key offerings
              • Starbucks Corp. - Segment focus
            • 14.15 Stonegate Pub Co. Ltd.
              • Stonegate Pub Co. Ltd. - Overview
              • Stonegate Pub Co. Ltd. - Business segments
              • Stonegate Pub Co. Ltd. - Key offerings
              • Stonegate Pub Co. Ltd. - Segment focus
            • 14.16 The Coca Cola Co.
              • The Coca Cola Co. - Overview
              • The Coca Cola Co. - Business segments
              • The Coca Cola Co. - Key news
              • The Coca Cola Co. - Key offerings
              • The Coca Cola Co. - Segment focus
            • 14.17 Whitbread PLC
              • Whitbread PLC - Overview
              • Whitbread PLC - Business segments
              • Whitbread PLC - Key offerings
              • Whitbread PLC - Segment focus

            15 Appendix

            • 15.1 Scope of the report
              • 15.2 Inclusions and exclusions checklist
                • Inclusions checklist
                • Exclusions checklist
              • 15.3 Currency conversion rates for US$
                • Currency conversion rates for US$
              • 15.4 Research methodology
                • Research methodology
              • 15.5 Data procurement
                • Information sources
              • 15.6 Data validation
                • Data validation
              • 15.7 Validation techniques employed for market sizing
                • Validation techniques employed for market sizing
              • 15.8 Data synthesis
                • Data synthesis
              • 15.9 360 degree market analysis
                • 360 degree market analysis
              • 15.10 List of abbreviations
                • List of abbreviations

              Research Methodology

              Technavio presents a detailed picture of the market by way of study, synthesis, and summation of data from multiple sources. The analysts have presented the various facets of the market with a particular focus on identifying the key industry influencers. The data thus presented is comprehensive, reliable, and the result of extensive research, both primary and secondary.

              INFORMATION SOURCES

              Primary sources

              • Manufacturers and suppliers
              • Channel partners
              • Industry experts
              • Strategic decision makers

              Secondary sources

              • Industry journals and periodicals
              • Government data
              • Financial reports of key industry players
              • Historical data
              • Press releases

              DATA ANALYSIS

              Data Synthesis

              • Collation of data
              • Estimation of key figures
              • Analysis of derived insights

              Data Validation

              • Triangulation with data models
              • Reference against proprietary databases
              • Corroboration with industry experts

              REPORT WRITING

              Qualitative

              • Market drivers
              • Market challenges
              • Market trends
              • Five forces analysis

              Quantitative

              • Market size and forecast
              • Market segmentation
              • Geographical insights
              • Competitive landscape

              Interested in this report?

              Get your sample now to see our research methodology and insights!

              Download Now

              Frequently Asked Questions

              Cafes And Bars market growth will increase by $ 68.8 bn during 2024-2028.

              The Cafes And Bars market is expected to grow at a CAGR of 4.36% during 2024-2028.

              Cafes And Bars market is segmented by Product( Beverages, Food) Type( Bars and pubs, Cafes, Specialty coffee shops)

              Berkshire Hathaway Inc., BJs Restaurants Inc., Brinker International Inc., Caffe Nero Group Ltd, Caribou Coffee Operating Co. Inc., Coffee Day Enterprises Ltd., Doutor Coffee Co. Ltd., Ediya Co. Ltd., Inspire Brands Inc., JAB Holding Co., Jollibee Foods Corp., LUIGI LAVAZZA SpA, McDonald Corp., Red Robin Gourmet Burgers Inc., Restaurant Brands International Inc., Starbucks Corp., Stonegate Pub Co. Ltd., The Coca Cola Co., Whitbread PLC, YUM Brands Inc. are a few of the key vendors in the Cafes And Bars market.

              Europe will register the highest growth rate of 44% among the other regions. Therefore, the Cafes And Bars market in Europe is expected to garner significant business opportunities for the vendors during the forecast period.

              US, Canada, Germany, UK, Italy, France, China, India, Japan, Brazil, Egypt, UAE, Oman, Argentina, KSA, UAE, Brazil, Rest of World (ROW)

              • Increasing number of cafesThe growing concept of socializing at cafes among urban youth is expected to drive the market during the forecast period. According to the World Bank Group (WBG) is the driving factor this market.
              • in 2020 is the driving factor this market.
              • over 56% of the world's population lived in urban areas. By 2030 is the driving factor this market.
              • the world is predicted to have 1.2 million km2 more of the urban built-up area because urban land consumption is expected to continue to expand at a rate that is up to 50% faster than population growth. The growth in the influx of people to urban areas and a substantially large white-collar demographic have brought out an increase in the number of food service outlets. Varied tastes and preferences for different types of premium coffee have further led to the emergence of specialty coffee shops. Leading cafe chains such as Starbucks Corp. is the driving factor this market.
              • under the company The Coca-Cola Co. (Costa Coffee) is the driving factor this market.
              • and Dunkin Brands Group Inc. is the driving factor this market.
              • are opening their outlets in many developing economies of Asia and South America. For instance is the driving factor this market.
              • in October 2022 is the driving factor this market.
              • Starbucks Corp. announced its increase in the global store count by 8% is the driving factor this market.
              • which is 18 is the driving factor this market.
              • 416 from 17 is the driving factor this market.
              • 007 in October 2021. Also is the driving factor this market.
              • there has been a growth in the number of coffee chains that offer products like iced coffee that have attracted the attention of the youth. Also is the driving factor this market.
              • the growth in the infrastructure is the driving factor this market.
              • like new airports and expressways in developing countries such as India is the driving factor this market.
              • Indonesia is the driving factor this market.
              • Iran is the driving factor this market.
              • and Iraq gives scope to the major coffee chains to establish their outlets. Frequent travel by road is the driving factor this market.
              • rail is the driving factor this market.
              • or air has increased coffee intake among consumers. Such factors are expected to drive the growth of the global cafes and bars market during the forecast period. is the driving factor this market.

              The Cafes And Bars market vendors should focus on grabbing business opportunities from the Beverages segment as it accounted for the largest market share in the base year.