Rotary Steerable Systems Market Analysis, Size, and Forecast 2026-2030: North America (US, Canada, and Mexico), Europe (Germany, UK, and France), APAC (China, Australia, and Japan), Middle East and Africa (Saudi Arabia, UAE, and Turkey), South America (Brazil, Argentina, and Colombia), and Rest of World (ROW)

Rotary Steerable Systems Market Analysis, Size, and Forecast 2026-2030:
North America (US, Canada, and Mexico), Europe (Germany, UK, and France), APAC (China, Australia, and Japan), Middle East and Africa (Saudi Arabia, UAE, and Turkey), South America (Brazil, Argentina, and Colombia), and Rest of World (ROW)

Published: Apr 2026 282 Pages SKU: IRTNTR41544

Market Overview at a Glance

$3.08 B
Market Opportunity
7.2%
CAGR 2025 - 2030
46.1%
North America Growth
$3.97 B
Onshore segment 2024

Rotary Steerable Systems Market Size 2026-2030

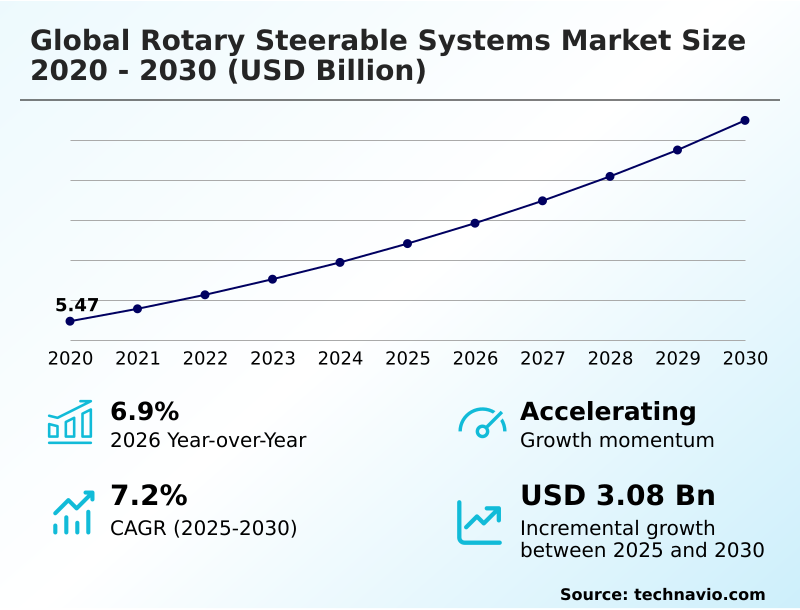
The rotary steerable systems market size is valued to increase by USD 3.08 billion, at a CAGR of 7.2% from 2025 to 2030. Expansion of complex unconventional drilling and extended-reach reservoirs will drive the rotary steerable systems market.

Major Market Trends & Insights

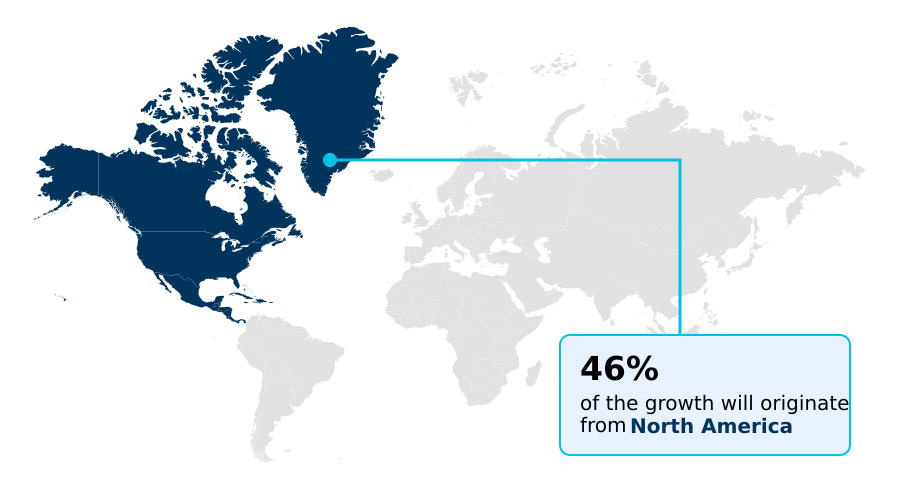
  • North America dominated the market and accounted for a 46.1% growth during the forecast period.
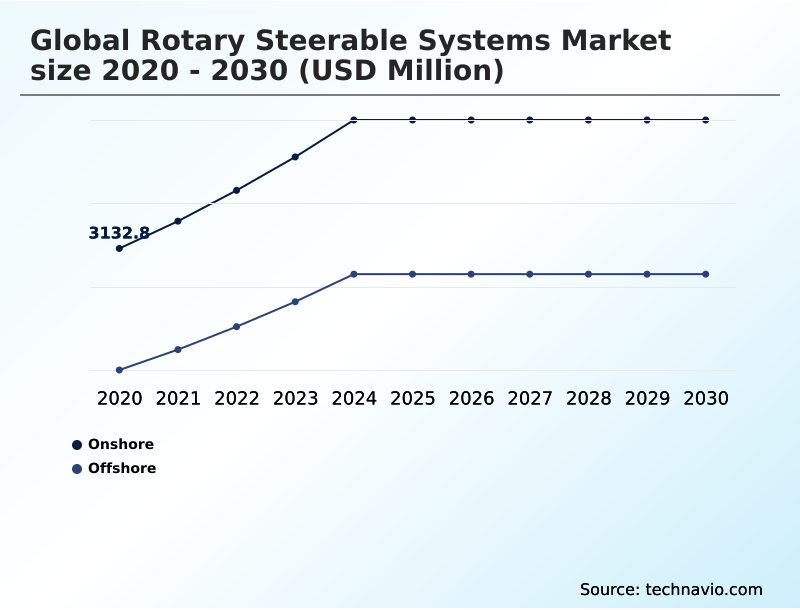
  • By Application - Onshore segment was valued at USD 3.97 billion in 2024
  • By Type - Horizontal segment accounted for the largest market revenue share in 2024

Market Size & Forecast

  • Market Opportunities: USD 5.02 billion
  • Market Future Opportunities: USD 3.08 billion
  • CAGR from 2025 to 2030 : 7.2%

Market Summary

  • The rotary steerable systems market is defined by a profound transformation toward high-precision drilling and operational efficiency to unlock resources from increasingly complex reservoirs. These systems, enabling continuous drill string rotation while steering the bit, are indispensable for developing unconventional shale plays, extended-reach offshore wells, and high-pressure, high-temperature environments.
  • A primary catalyst is the shift from manual, motor-based directional drilling to integrated, closed-loop automated solutions, driven by the imperative to reduce non-productive time and enhance wellbore quality.
  • In a typical scenario, an operator targeting a thin pay zone in a horizontal well leverages real-time geosteering data to make micro-adjustments, ensuring the wellbore remains in the most productive rock layer and maximizing asset value.
  • Beyond traditional oil and gas, the technology is expanding into geothermal energy and carbon capture, where precise navigation in hard rock and deep formations is critical. The integration of advanced sensors and data analytics continues to refine system capabilities, ensuring projects remain economically viable amid volatile commodity prices and stringent environmental regulations.

What will be the Size of the Rotary Steerable Systems Market during the forecast period?

Get Key Insights on Market Forecast (PDF) Request Free Sample

How is the Rotary Steerable Systems Market Segmented?

The rotary steerable systems industry research report provides comprehensive data (region-wise segment analysis), with forecasts and estimates in "USD million" for the period 2026-2030, as well as historical data from 2020-2024 for the following segments.

  • Application
    • Onshore
    • Offshore
  • Type
    • Horizontal
    • Directional
  • Technology
    • Push-the-bit
    • Point-the-bit
  • Geography
    • North America
      • US
      • Canada
      • Mexico
    • Europe
      • Germany
      • UK
      • France
    • APAC
      • China
      • Australia
      • Japan
    • Middle East and Africa
      • Saudi Arabia
      • UAE
      • Turkey
    • South America
      • Brazil
      • Argentina
      • Colombia
    • Rest of World (ROW)

By Application Insights

The onshore segment is estimated to witness significant growth during the forecast period.

The onshore segment is pivotal, shaped by the proliferation of unconventional resource plays and the necessity for extended-reach drilling.

Within this sub-segment, the transition from traditional mud motors to sophisticated rotary steerable systems is motivated by the requirement for higher rates of penetration (ROP) and mitigation of wellbore tortuosity, with some autonomous deployments achieving a 15% reduction in trajectory deviations.

Onshore operators focus on reducing total cost of ownership by minimizing non-productive time, which is achieved through continuous drill string rotation.

The integration of real-time data from measurement-while-drilling (MWD) tools and formation evaluation sensors into the steering logic of the bottom-hole assembly (BHA) allows for precise reservoir navigation and drill bit guidance, maximizing the net-to-gross pay ratio in marginal field economics.

Request Free Sample

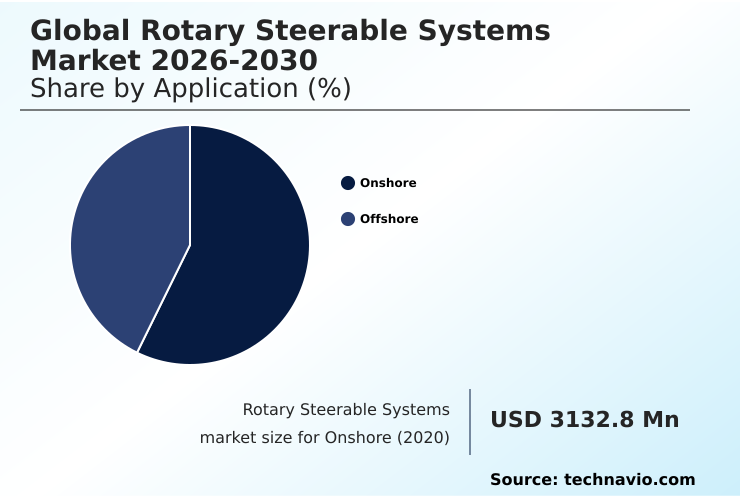
The Onshore segment was valued at USD 3.97 billion in 2024 and showed a gradual increase during the forecast period.

Request Free Sample

Regional Analysis

North America is estimated to contribute 46.1% to the growth of the global market during the forecast period.Technavio’s analysts have elaborately explained the regional trends and drivers that shape the market during the forecast period.

See How Rotary Steerable Systems Market Demand is Rising in North America Request Free Sample

The geographic landscape is dominated by North America, which accounts for over 46% of the incremental growth, driven by mature unconventional shale plays.

Operators in this region leverage advanced push-the-bit technology and point-the-bit mechanisms for automated trajectory correction to reduce wellbore tortuosity. The market is also expanding into geothermal energy drilling and carbon capture and storage (CCS) wells.

In contrast, APAC is a rapidly growing region, contributing over 23% to market expansion, fueled by efforts to increase domestic production and ensure energy security.

This has led to a surge in complex projects, including ultra-deep wells, where logging-while-drilling (LWD) and geomechanical stress modeling are critical for formation characterization.

The Middle East and Africa also show strong demand, focusing on gas production and deploying advanced wellbore architecture.

Market Dynamics

Our researchers analyzed the data with 2025 as the base year, along with the key drivers, trends, and challenges. A holistic analysis of drivers will help companies refine their marketing strategies to gain a competitive advantage.

  • A comprehensive cost-benefit analysis of rotary steerable systems reveals significant advantages over conventional methods, particularly in complex drilling scenarios. When comparing rotary steerable systems vs conventional mud motors, the primary distinction lies in the ability to achieve a higher rate of penetration with rotary steerable systems while improving wellbore quality.
  • The debate over push-the-bit vs point-the-bit performance often centers on the application; push-the-bit excels in maintaining stable control, whereas point-the-bit offers precision in softer formations. The reliability of high-temperature rotary steerable tools is a critical factor in deep, high-pressure environments, where maintenance costs for rotary steerable systems must be weighed against the high expense of non-productive time.
  • The autonomous rotary steerable system for deepwater applications is revolutionizing offshore drilling by reducing human error. Moreover, integrating AI with rotary steerable systems enables closed-loop steering for precise well placement. This is crucial for rotary steerable systems for geothermal drilling and rotary steerable systems for carbon capture wells, where accuracy is paramount.
  • Telemetry limitations in extended-reach drilling remain a challenge, but advancements in real-time geosteering with rotary steerable systems are mitigating this issue.
  • The technology is also fundamental for constructing rotary steerable systems for multilateral wells and is a key enabler for rotary steerable systems for unconventional shale, where optimizing wellbore quality with RSS can lead to production gains exceeding those of older technologies by more than 15%.
  • The impact of dogleg severity on RSS performance is a key consideration, as is the use of rotary steerable systems for mature field optimization to extend asset life.

What are the key market drivers leading to the rise in the adoption of Rotary Steerable Systems Industry?

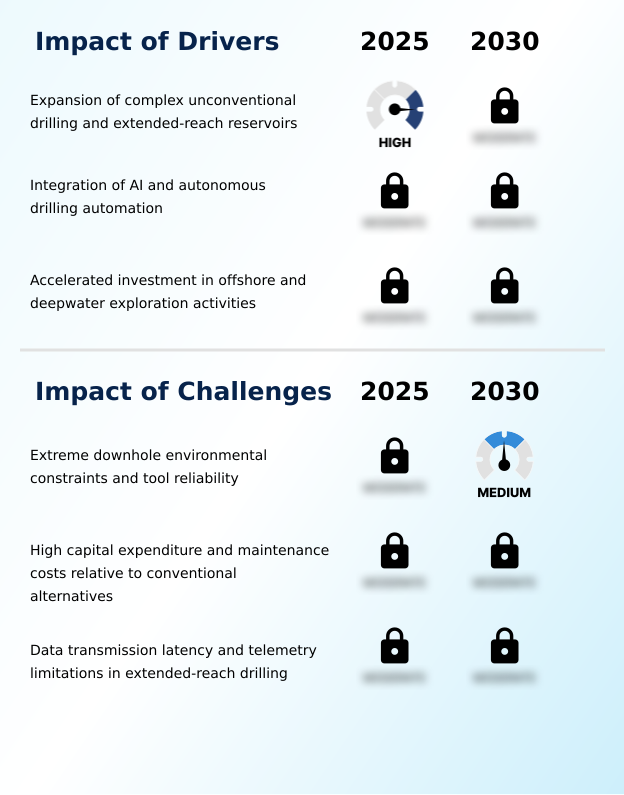
  • A key driver for the market is the expansion of complex unconventional drilling and extended-reach reservoirs, which compels operators to target geologically challenging formations requiring high-precision directional drilling.

  • The market is propelled by the need to access complex reservoirs through extended-reach drilling (ERD), where directional drilling precision is paramount.
  • The use of continuous drill string rotation is a key enabler, significantly reducing non-productive time (NPT) and improving subsea tie-back efficiency in deepwater exploration projects.
  • As operators pursue mature field redevelopment and pre-salt reservoir exploitation, the economic case for intelligent drilling systems strengthens. For instance, integrated digital twin simulation allows for optimized well planning, contributing to operational cost optimization.
  • The move toward drilling-as-a-service models is also gaining traction, particularly in the context of energy transition drilling, where efficiency gains of up to 15% in tortuosity reduction have been documented on geothermal projects.

What are the market trends shaping the Rotary Steerable Systems Industry?

  • The market is increasingly shaped by technological advancements and the digital integration of drilling operations. This shift is driven by the need to enhance the precision of wellbore placement and minimize human error.

  • A primary trend transforming the market is the integration of digital technologies, where advanced sensor integration and real-time geosteering are becoming standard. This shift toward autonomous drilling automation and closed-loop steering control enables superior wellbore placement accuracy, which is critical for unconventional resource development and complex horizontal well construction.
  • Operators are leveraging these systems to enhance the rate of penetration (ROP) and improve hole cleaning efficiency, directly impacting drilling efficiency metrics. For instance, the adoption of remote drilling operations allows for centralized expertise to manage multiple sites, reducing operational costs.
  • This digital evolution supports integrated drilling services and full well lifecycle management, with some automated platforms reducing drilling time by over 10% on complex wells.

What challenges does the Rotary Steerable Systems Industry face during its growth?

  • A significant challenge affecting industry growth stems from extreme downhole environmental constraints and ensuring tool reliability in high-pressure, high-temperature conditions.

  • A significant market challenge is ensuring downhole tool reliability in extreme conditions, where high-pressure high-temperature (HPHT) tools are essential. Navigating complex reservoirs during tight gas and shale drilling operations exposes systems with hydraulic actuation mechanisms to conditions exceeding 175 degrees Celsius, leading to failures.
  • The industry is focused on developing ruggedized downhole electronics and implementing predictive maintenance for drilling tools to mitigate these risks. Another hurdle is data transmission latency, as both mud pulse telemetry and electromagnetic (EM) telemetry face signal degradation in long-reach wells, sometimes causing delays of up to three minutes.
  • This impacts asset performance solutions and complicates high-dogleg drilling applications, especially in subsea infrastructure development where real-time control is critical.

Exclusive Technavio Analysis on Customer Landscape

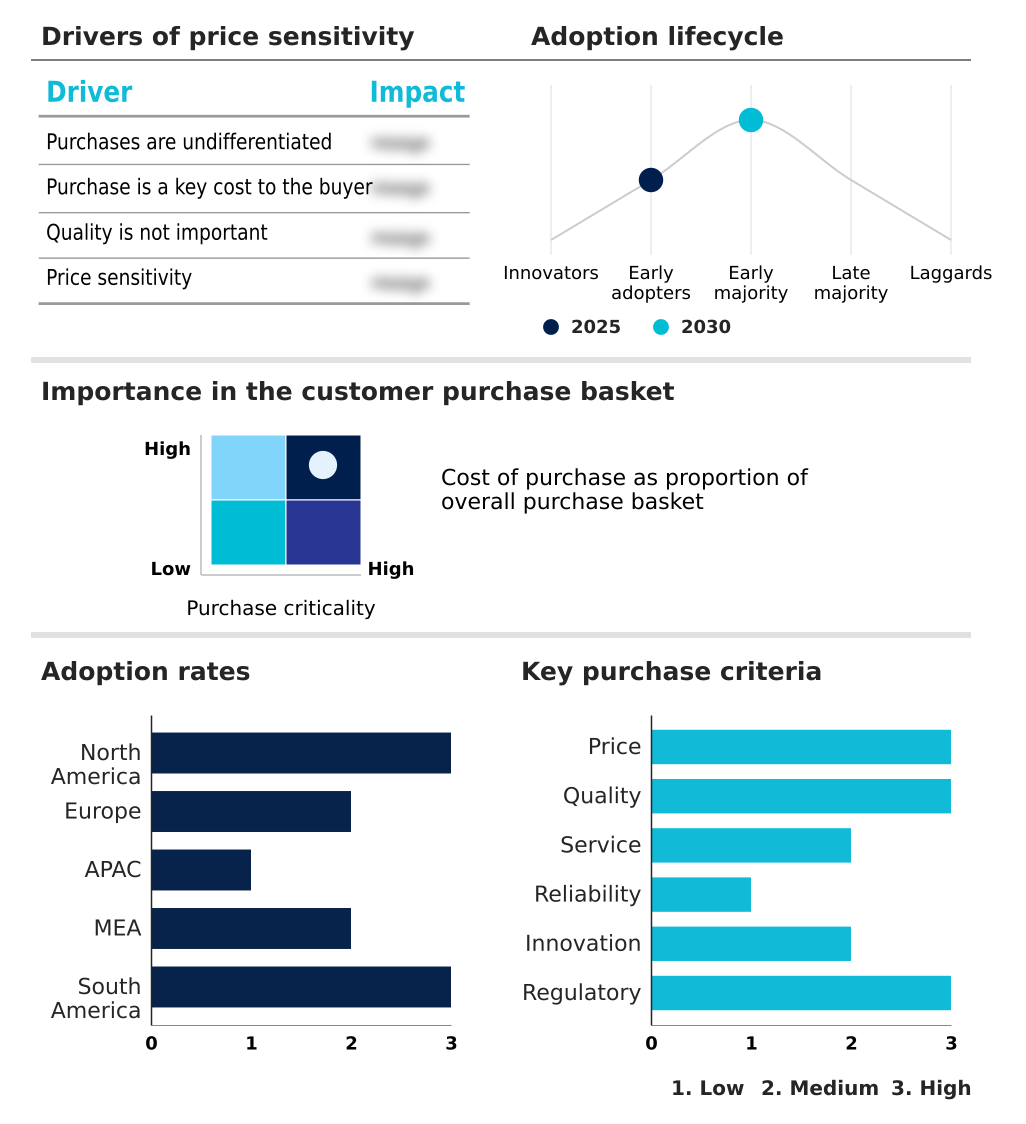
The rotary steerable systems market forecasting report includes the adoption lifecycle of the market, covering from the innovator’s stage to the laggard’s stage. It focuses on adoption rates in different regions based on penetration. Furthermore, the rotary steerable systems market report also includes key purchase criteria and drivers of price sensitivity to help companies evaluate and develop their market growth analysis strategies.

Customer Landscape of Rotary Steerable Systems Industry

Competitive Landscape

Companies are implementing various strategies, such as strategic alliances, rotary steerable systems market forecast, partnerships, mergers and acquisitions, geographical expansion, and product/service launches, to enhance their presence in the industry.

Altitude Energy Partners - Key offerings include advanced electromechanical and sensor products, featuring rotary steerable systems and measurement-while-drilling tools designed for drilling optimization and enhanced performance.

The industry research and growth report includes detailed analyses of the competitive landscape of the market and information about key companies, including:

  • Altitude Energy Partners
  • APS Technology Inc.
  • Baker Hughes Co.
  • Burintekh Ltd.
  • D Tech Drilling Tools
  • DeepFast
  • GA Drilling AS
  • Halliburton Co.
  • Landrill Oil Tools Co. Ltd.
  • MorningStar RSS LLC
  • NOV Inc.
  • Schlumberger Ltd.
  • Scientific Drilling Intl.
  • Scout Downhole
  • SenNavs
  • Sinodrills Co. Ltd.
  • TAQA KSA
  • Weatherford International Plc

Qualitative and quantitative analysis of companies has been conducted to help clients understand the wider business environment as well as the strengths and weaknesses of key industry players. Data is qualitatively analyzed to categorize companies as pure play, category-focused, industry-focused, and diversified; it is quantitatively analyzed to categorize companies as dominant, leading, strong, tentative, and weak.

Recent Development and News in Rotary steerable systems market

  • In June 2025, Fervo Energy secured $206 million in financing to advance its geothermal energy project, which relies heavily on autonomous drilling technologies and rotary steerable systems to access geothermal resources.
  • In September 2025, Baker Hughes secured a significant contract to provide integrated subsea tree systems and related services for the third phase of the Sakarya Gas Field development in Turkey, highlighting the complexity of modern offshore projects requiring advanced drilling support.
  • In February 2025, a North American drilling contractor successfully deployed a next-generation autonomous rotary steerable system in a Haynesville Shale deep-gas project, which performed real-time trajectory corrections and reduced wellbore tortuosity by 15% compared to offset wells.
  • In May 2025, SLB introduced a novel at-bit imaging tool designed for integration with its rotary steerable system portfolio, providing drillers with instantaneous, high-resolution visual and geological data from the drill bit.

Dive into Technavio’s robust research methodology, blending expert interviews, extensive data synthesis, and validated models for unparalleled Rotary Steerable Systems Market insights. See full methodology.

Market Scope
Page number 282
Base year 2025
Historic period 2020-2024
Forecast period 2026-2030
Growth momentum & CAGR Accelerate at a CAGR of 7.2%
Market growth 2026-2030 USD 3077.2 million
Market structure Fragmented
YoY growth 2025-2026(%) 6.9%
Key countries US, Canada, Mexico, Germany, UK, France, Italy, Spain, The Netherlands, China, Australia, Japan, India, Indonesia, Thailand, Saudi Arabia, UAE, Oman, Turkey, Israel, Brazil, Argentina and Colombia
Competitive landscape Leading Companies, Market Positioning of Companies, Competitive Strategies, and Industry Risks

Request Free Sample

Research Analyst Overview

  • The rotary steerable systems market is fundamentally driven by the need for directional drilling precision in increasingly complex geological settings. Technologies enabling continuous drill string rotation, such as push-the-bit technology and point-the-bit mechanisms, are central to enhancing the rate of penetration (ROP) and improving overall wellbore quality.
  • The industry is rapidly adopting intelligent drilling systems that leverage digital twin simulation and autonomous drilling automation for real-time geosteering. Key to this is the integration of advanced sensor technologies, including measurement-while-drilling (MWD), logging-while-drilling (LWD), and formation evaluation sensors, into the bottom-hole assembly (BHA) for superior reservoir navigation.
  • For boardroom consideration, allocating capital toward closed-loop steering control platforms, which have demonstrated a 15% reduction in wellbore tortuosity, directly correlates to lower non-productive time (NPT) and improved returns. Addressing challenges like downhole tool reliability in high-pressure high-temperature (HPHT) conditions with ruggedized downhole electronics and advanced hydraulic actuation mechanisms is critical.
  • Improving downhole telemetry systems, including both mud pulse and electromagnetic (EM) telemetry, is essential for accurate toolface orientation control and automated trajectory correction, especially in extended-reach drilling (ERD) where dogleg severity control ensures precise wellbore placement and enhanced hole cleaning efficiency.

What are the Key Data Covered in this Rotary Steerable Systems Market Research and Growth Report?

  • What is the expected growth of the Rotary Steerable Systems Market between 2026 and 2030?

    • USD 3.08 billion, at a CAGR of 7.2%

  • What segmentation does the market report cover?

    • The report is segmented by Application (Onshore, and Offshore), Type (Horizontal, and Directional), Technology (Push-the-bit, and Point-the-bit) and Geography (North America, Europe, APAC, Middle East and Africa, South America)

  • Which regions are analyzed in the report?

    • North America, Europe, APAC, Middle East and Africa and South America

  • What are the key growth drivers and market challenges?

    • Expansion of complex unconventional drilling and extended-reach reservoirs, Extreme downhole environmental constraints and tool reliability

  • Who are the major players in the Rotary Steerable Systems Market?

    • Altitude Energy Partners, APS Technology Inc., Baker Hughes Co., Burintekh Ltd., D Tech Drilling Tools, DeepFast, GA Drilling AS, Halliburton Co., Landrill Oil Tools Co. Ltd., MorningStar RSS LLC, NOV Inc., Schlumberger Ltd., Scientific Drilling Intl., Scout Downhole, SenNavs, Sinodrills Co. Ltd., TAQA KSA and Weatherford International Plc

Market Research Insights

  • Market dynamics are increasingly shaped by the push for operational cost optimization and the need to navigate complex reservoirs, driving adoption of integrated drilling services. In deepwater exploration projects, for instance, leveraging real-time data analytics can improve decision-making, while predictive maintenance for drilling tools helps mitigate risks associated with high-dogleg drilling applications.
  • The industry's move toward drilling-as-a-service models and well lifecycle management is also notable. Advanced wellbore architecture in mature field redevelopment now yields recovery improvements of over 20%, a significant gain. However, telemetry limitations can cause signal delays of up to three minutes in extended-reach wells, impacting efficiency.
  • Simultaneously, the focus on environmental footprint reduction is steering investment toward more efficient automated rig platforms and asset performance solutions.

We can help! Our analysts can customize this rotary steerable systems market research report to meet your requirements.

Get in touch

1. Executive Summary

1.1 Market overview

Executive Summary - Chart on Market Overview
Executive Summary - Data Table on Market Overview
Executive Summary - Chart on Global Market Characteristics
Executive Summary - Chart on Market by Geography
Executive Summary - Chart on Market Segmentation by Application
Executive Summary - Chart on Market Segmentation by Type
Executive Summary - Chart on Market Segmentation by Technology
Executive Summary - Chart on Incremental Growth
Executive Summary - Data Table on Incremental Growth
Executive Summary - Chart on Company Market Positioning

2. Technavio Analysis

2.1 Analysis of price sensitivity, lifecycle, customer purchase basket, adoption rates, and purchase criteria

2.2 Criticality of inputs and Factors of differentiation

Chart on Overview on criticality of inputs and factors of differentiation

2.3 Factors of disruption

Chart on Overview on factors of disruption

2.4 Impact of drivers and challenges

Chart on Impact of drivers and challenges in 2025 and 2030

3. Market Landscape

3.1 Market ecosystem

Chart on Parent Market
Data Table on - Parent Market

3.2 Market characteristics

Chart on Market characteristics analysis

3.3 Value chain analysis

Chart on Value chain analysis

4. Market Sizing

4.1 Market definition

Data Table on Offerings of companies included in the market definition

4.2 Market segment analysis

Market segments

4.3 Market size 2025

4.4 Market outlook: Forecast for 2025-2030

Chart on Global - Market size and forecast 2025-2030 ($ million)
Data Table on Global - Market size and forecast 2025-2030 ($ million)
Chart on Global Market: Year-over-year growth 2025-2030 (%)
Data Table on Global Market: Year-over-year growth 2025-2030 (%)

5. Historic Market Size

5.1 Global Rotary Steerable Systems Market 2020 - 2024

Historic Market Size - Data Table on Global Rotary Steerable Systems Market 2020 - 2024 ($ million)

5.2 Application segment analysis 2020 - 2024

Historic Market Size - Application Segment 2020 - 2024 ($ million)

5.3 Type segment analysis 2020 - 2024

Historic Market Size - Type Segment 2020 - 2024 ($ million)

5.4 Technology segment analysis 2020 - 2024

Historic Market Size - Technology Segment 2020 - 2024 ($ million)

5.5 Geography segment analysis 2020 - 2024

Historic Market Size - Geography Segment 2020 - 2024 ($ million)

5.6 Country segment analysis 2020 - 2024

Historic Market Size - Country Segment 2020 - 2024 ($ million)

6. Qualitative Analysis

6.1 Impact of AI on Global Rotary Steerable Systems Market

6.2 Impact of Geopolitical Conflicts on Global Rotary Steerable Systems Market

7. Five Forces Analysis

7.1 Five forces summary

Five forces analysis - Comparison between 2025 and 2030

7.2 Bargaining power of buyers

Bargaining power of buyers - Impact of key factors 2025 and 2030

7.3 Bargaining power of suppliers

Bargaining power of suppliers - Impact of key factors in 2025 and 2030

7.4 Threat of new entrants

Threat of new entrants - Impact of key factors in 2025 and 2030

7.5 Threat of substitutes

Threat of substitutes - Impact of key factors in 2025 and 2030

7.6 Threat of rivalry

Threat of rivalry - Impact of key factors in 2025 and 2030

7.7 Market condition

Chart on Market condition - Five forces 2025 and 2030

8. Market Segmentation by Application

8.1 Market segments

Chart on Application - Market share 2025-2030 (%)
Data Table on Application - Market share 2025-2030 (%)

8.2 Comparison by Application

Chart on Comparison by Application
Data Table on Comparison by Application

8.3 Onshore - Market size and forecast 2025-2030

Chart on Onshore - Market size and forecast 2025-2030 ($ million)
Data Table on Onshore - Market size and forecast 2025-2030 ($ million)
Chart on Onshore - Year-over-year growth 2025-2030 (%)
Data Table on Onshore - Year-over-year growth 2025-2030 (%)

8.4 Offshore - Market size and forecast 2025-2030

Chart on Offshore - Market size and forecast 2025-2030 ($ million)
Data Table on Offshore - Market size and forecast 2025-2030 ($ million)
Chart on Offshore - Year-over-year growth 2025-2030 (%)
Data Table on Offshore - Year-over-year growth 2025-2030 (%)

8.5 Market opportunity by Application

Market opportunity by Application ($ million)
Data Table on Market opportunity by Application ($ million)

9. Market Segmentation by Type

9.1 Market segments

Chart on Type - Market share 2025-2030 (%)
Data Table on Type - Market share 2025-2030 (%)

9.2 Comparison by Type

Chart on Comparison by Type
Data Table on Comparison by Type

9.3 Horizontal - Market size and forecast 2025-2030

Chart on Horizontal - Market size and forecast 2025-2030 ($ million)
Data Table on Horizontal - Market size and forecast 2025-2030 ($ million)
Chart on Horizontal - Year-over-year growth 2025-2030 (%)
Data Table on Horizontal - Year-over-year growth 2025-2030 (%)

9.4 Directional - Market size and forecast 2025-2030

Chart on Directional - Market size and forecast 2025-2030 ($ million)
Data Table on Directional - Market size and forecast 2025-2030 ($ million)
Chart on Directional - Year-over-year growth 2025-2030 (%)
Data Table on Directional - Year-over-year growth 2025-2030 (%)

9.5 Market opportunity by Type

Market opportunity by Type ($ million)
Data Table on Market opportunity by Type ($ million)

10. Market Segmentation by Technology

10.1 Market segments

Chart on Technology - Market share 2025-2030 (%)
Data Table on Technology - Market share 2025-2030 (%)

10.2 Comparison by Technology

Chart on Comparison by Technology
Data Table on Comparison by Technology

10.3 Push-the-bit - Market size and forecast 2025-2030

Chart on Push-the-bit - Market size and forecast 2025-2030 ($ million)
Data Table on Push-the-bit - Market size and forecast 2025-2030 ($ million)
Chart on Push-the-bit - Year-over-year growth 2025-2030 (%)
Data Table on Push-the-bit - Year-over-year growth 2025-2030 (%)

10.4 Point-the-bit - Market size and forecast 2025-2030

Chart on Point-the-bit - Market size and forecast 2025-2030 ($ million)
Data Table on Point-the-bit - Market size and forecast 2025-2030 ($ million)
Chart on Point-the-bit - Year-over-year growth 2025-2030 (%)
Data Table on Point-the-bit - Year-over-year growth 2025-2030 (%)

10.5 Market opportunity by Technology

Market opportunity by Technology ($ million)
Data Table on Market opportunity by Technology ($ million)

11. Customer Landscape

11.1 Customer landscape overview

Analysis of price sensitivity, lifecycle, customer purchase basket, adoption rates, and purchase criteria

12. Geographic Landscape

12.1 Geographic segmentation

Chart on Market share by geography 2025-2030 (%)
Data Table on Market share by geography 2025-2030 (%)

12.2 Geographic comparison

Chart on Geographic comparison
Data Table on Geographic comparison

12.3 North America - Market size and forecast 2025-2030

Chart on North America - Market size and forecast 2025-2030 ($ million)
Data Table on North America - Market size and forecast 2025-2030 ($ million)
Chart on North America - Year-over-year growth 2025-2030 (%)
Data Table on North America - Year-over-year growth 2025-2030 (%)
Chart on Regional Comparison - North America
Data Table on Regional Comparison - North America

12.3.1 US - Market size and forecast 2025-2030

Chart on US - Market size and forecast 2025-2030 ($ million)
Data Table on US - Market size and forecast 2025-2030 ($ million)
Chart on US - Year-over-year growth 2025-2030 (%)
Data Table on US - Year-over-year growth 2025-2030 (%)

12.3.2 Canada - Market size and forecast 2025-2030

Chart on Canada - Market size and forecast 2025-2030 ($ million)
Data Table on Canada - Market size and forecast 2025-2030 ($ million)
Chart on Canada - Year-over-year growth 2025-2030 (%)
Data Table on Canada - Year-over-year growth 2025-2030 (%)

12.3.3 Mexico - Market size and forecast 2025-2030

Chart on Mexico - Market size and forecast 2025-2030 ($ million)
Data Table on Mexico - Market size and forecast 2025-2030 ($ million)
Chart on Mexico - Year-over-year growth 2025-2030 (%)
Data Table on Mexico - Year-over-year growth 2025-2030 (%)

12.4 Europe - Market size and forecast 2025-2030

Chart on Europe - Market size and forecast 2025-2030 ($ million)
Data Table on Europe - Market size and forecast 2025-2030 ($ million)
Chart on Europe - Year-over-year growth 2025-2030 (%)
Data Table on Europe - Year-over-year growth 2025-2030 (%)
Chart on Regional Comparison - Europe
Data Table on Regional Comparison - Europe

12.4.1 Germany - Market size and forecast 2025-2030

Chart on Germany - Market size and forecast 2025-2030 ($ million)
Data Table on Germany - Market size and forecast 2025-2030 ($ million)
Chart on Germany - Year-over-year growth 2025-2030 (%)
Data Table on Germany - Year-over-year growth 2025-2030 (%)

12.4.2 UK - Market size and forecast 2025-2030

Chart on UK - Market size and forecast 2025-2030 ($ million)
Data Table on UK - Market size and forecast 2025-2030 ($ million)
Chart on UK - Year-over-year growth 2025-2030 (%)
Data Table on UK - Year-over-year growth 2025-2030 (%)

12.4.3 France - Market size and forecast 2025-2030

Chart on France - Market size and forecast 2025-2030 ($ million)
Data Table on France - Market size and forecast 2025-2030 ($ million)
Chart on France - Year-over-year growth 2025-2030 (%)
Data Table on France - Year-over-year growth 2025-2030 (%)

12.4.4 Italy - Market size and forecast 2025-2030

Chart on Italy - Market size and forecast 2025-2030 ($ million)
Data Table on Italy - Market size and forecast 2025-2030 ($ million)
Chart on Italy - Year-over-year growth 2025-2030 (%)
Data Table on Italy - Year-over-year growth 2025-2030 (%)

12.4.5 Spain - Market size and forecast 2025-2030

Chart on Spain - Market size and forecast 2025-2030 ($ million)
Data Table on Spain - Market size and forecast 2025-2030 ($ million)
Chart on Spain - Year-over-year growth 2025-2030 (%)
Data Table on Spain - Year-over-year growth 2025-2030 (%)

12.4.6 The Netherlands - Market size and forecast 2025-2030

Chart on The Netherlands - Market size and forecast 2025-2030 ($ million)
Data Table on The Netherlands - Market size and forecast 2025-2030 ($ million)
Chart on The Netherlands - Year-over-year growth 2025-2030 (%)
Data Table on The Netherlands - Year-over-year growth 2025-2030 (%)

12.5 APAC - Market size and forecast 2025-2030

Chart on APAC - Market size and forecast 2025-2030 ($ million)
Data Table on APAC - Market size and forecast 2025-2030 ($ million)
Chart on APAC - Year-over-year growth 2025-2030 (%)
Data Table on APAC - Year-over-year growth 2025-2030 (%)
Chart on Regional Comparison - APAC
Data Table on Regional Comparison - APAC

12.5.1 China - Market size and forecast 2025-2030

Chart on China - Market size and forecast 2025-2030 ($ million)
Data Table on China - Market size and forecast 2025-2030 ($ million)
Chart on China - Year-over-year growth 2025-2030 (%)
Data Table on China - Year-over-year growth 2025-2030 (%)

12.5.2 Australia - Market size and forecast 2025-2030

Chart on Australia - Market size and forecast 2025-2030 ($ million)
Data Table on Australia - Market size and forecast 2025-2030 ($ million)
Chart on Australia - Year-over-year growth 2025-2030 (%)
Data Table on Australia - Year-over-year growth 2025-2030 (%)

12.5.3 Japan - Market size and forecast 2025-2030

Chart on Japan - Market size and forecast 2025-2030 ($ million)
Data Table on Japan - Market size and forecast 2025-2030 ($ million)
Chart on Japan - Year-over-year growth 2025-2030 (%)
Data Table on Japan - Year-over-year growth 2025-2030 (%)

12.5.4 India - Market size and forecast 2025-2030

Chart on India - Market size and forecast 2025-2030 ($ million)
Data Table on India - Market size and forecast 2025-2030 ($ million)
Chart on India - Year-over-year growth 2025-2030 (%)
Data Table on India - Year-over-year growth 2025-2030 (%)

12.5.5 Indonesia - Market size and forecast 2025-2030

Chart on Indonesia - Market size and forecast 2025-2030 ($ million)
Data Table on Indonesia - Market size and forecast 2025-2030 ($ million)
Chart on Indonesia - Year-over-year growth 2025-2030 (%)
Data Table on Indonesia - Year-over-year growth 2025-2030 (%)

12.5.6 Thailand - Market size and forecast 2025-2030

Chart on Thailand - Market size and forecast 2025-2030 ($ million)
Data Table on Thailand - Market size and forecast 2025-2030 ($ million)
Chart on Thailand - Year-over-year growth 2025-2030 (%)
Data Table on Thailand - Year-over-year growth 2025-2030 (%)

12.6 Middle East and Africa - Market size and forecast 2025-2030

Chart on Middle East and Africa - Market size and forecast 2025-2030 ($ million)
Data Table on Middle East and Africa - Market size and forecast 2025-2030 ($ million)
Chart on Middle East and Africa - Year-over-year growth 2025-2030 (%)
Data Table on Middle East and Africa - Year-over-year growth 2025-2030 (%)
Chart on Regional Comparison - Middle East and Africa
Data Table on Regional Comparison - Middle East and Africa

12.6.1 Saudi Arabia - Market size and forecast 2025-2030

Chart on Saudi Arabia - Market size and forecast 2025-2030 ($ million)
Data Table on Saudi Arabia - Market size and forecast 2025-2030 ($ million)
Chart on Saudi Arabia - Year-over-year growth 2025-2030 (%)
Data Table on Saudi Arabia - Year-over-year growth 2025-2030 (%)

12.6.2 UAE - Market size and forecast 2025-2030

Chart on UAE - Market size and forecast 2025-2030 ($ million)
Data Table on UAE - Market size and forecast 2025-2030 ($ million)
Chart on UAE - Year-over-year growth 2025-2030 (%)
Data Table on UAE - Year-over-year growth 2025-2030 (%)

12.6.3 Oman - Market size and forecast 2025-2030

Chart on Oman - Market size and forecast 2025-2030 ($ million)
Data Table on Oman - Market size and forecast 2025-2030 ($ million)
Chart on Oman - Year-over-year growth 2025-2030 (%)
Data Table on Oman - Year-over-year growth 2025-2030 (%)

12.6.4 Turkey - Market size and forecast 2025-2030

Chart on Turkey - Market size and forecast 2025-2030 ($ million)
Data Table on Turkey - Market size and forecast 2025-2030 ($ million)
Chart on Turkey - Year-over-year growth 2025-2030 (%)
Data Table on Turkey - Year-over-year growth 2025-2030 (%)

12.6.5 Israel - Market size and forecast 2025-2030

Chart on Israel - Market size and forecast 2025-2030 ($ million)
Data Table on Israel - Market size and forecast 2025-2030 ($ million)
Chart on Israel - Year-over-year growth 2025-2030 (%)
Data Table on Israel - Year-over-year growth 2025-2030 (%)

12.7 South America - Market size and forecast 2025-2030

Chart on South America - Market size and forecast 2025-2030 ($ million)
Data Table on South America - Market size and forecast 2025-2030 ($ million)
Chart on South America - Year-over-year growth 2025-2030 (%)
Data Table on South America - Year-over-year growth 2025-2030 (%)
Chart on Regional Comparison - South America
Data Table on Regional Comparison - South America

12.7.1 Brazil - Market size and forecast 2025-2030

Chart on Brazil - Market size and forecast 2025-2030 ($ million)
Data Table on Brazil - Market size and forecast 2025-2030 ($ million)
Chart on Brazil - Year-over-year growth 2025-2030 (%)
Data Table on Brazil - Year-over-year growth 2025-2030 (%)

12.7.2 Argentina - Market size and forecast 2025-2030

Chart on Argentina - Market size and forecast 2025-2030 ($ million)
Data Table on Argentina - Market size and forecast 2025-2030 ($ million)
Chart on Argentina - Year-over-year growth 2025-2030 (%)
Data Table on Argentina - Year-over-year growth 2025-2030 (%)

12.7.3 Colombia - Market size and forecast 2025-2030

Chart on Colombia - Market size and forecast 2025-2030 ($ million)
Data Table on Colombia - Market size and forecast 2025-2030 ($ million)
Chart on Colombia - Year-over-year growth 2025-2030 (%)
Data Table on Colombia - Year-over-year growth 2025-2030 (%)

12.8 Market opportunity by geography

Market opportunity by geography ($ million)
Data Tables on Market opportunity by geography ($ million)

13. Drivers, Challenges, and Opportunity

13.1 Market drivers

Expansion of complex unconventional drilling and extended-reach reservoirs
Integration of AI and autonomous drilling automation
Accelerated investment in offshore and deepwater exploration activities

13.2 Market challenges

Extreme downhole environmental constraints and tool reliability
High capital expenditure and maintenance costs relative to conventional alternatives
Data transmission latency and telemetry limitations in extended-reach drilling

13.3 Impact of drivers and challenges

Impact of drivers and challenges in 2025 and 2030

13.4 Market opportunities

Technological advancements and digital integration in drilling operations
Expansion of offshore and ultra-deepwater exploration projects
Rising demand for unconventional resource development and cost optimization

14. Competitive Landscape

14.1 Overview

14.2

Overview on criticality of inputs and factors of differentiation

14.3 Landscape disruption

Overview on factors of disruption

14.4 Industry risks

Impact of key risks on business

15. Competitive Analysis

15.1 Companies profiled

Companies covered

15.2 Company ranking index

15.3 Market positioning of companies

Matrix on companies position and classification

15.4 APS Technology Inc.

APS Technology Inc. - Overview
APS Technology Inc. - Product / Service
APS Technology Inc. - Key offerings
SWOT

15.5 Baker Hughes Co.

Baker Hughes Co. - Overview
Baker Hughes Co. - Business segments
Baker Hughes Co. - Key offerings
Baker Hughes Co. - Segment focus
SWOT

15.6 Burintekh Ltd.

Burintekh Ltd. - Overview
Burintekh Ltd. - Product / Service
Burintekh Ltd. - Key offerings
SWOT

15.7 DeepFast

DeepFast - Overview
DeepFast - Product / Service
DeepFast - Key offerings
SWOT

15.8 GA Drilling AS

GA Drilling AS - Overview
GA Drilling AS - Product / Service
GA Drilling AS - Key offerings
SWOT

15.9 Halliburton Co.

Halliburton Co. - Overview
Halliburton Co. - Business segments
Halliburton Co. - Key news
Halliburton Co. - Key offerings
Halliburton Co. - Segment focus
SWOT

15.10 Landrill Oil Tools Co. Ltd.

Landrill Oil Tools Co. Ltd. - Overview
Landrill Oil Tools Co. Ltd. - Product / Service
Landrill Oil Tools Co. Ltd. - Key offerings
SWOT

15.11 NOV Inc.

NOV Inc. - Overview
NOV Inc. - Business segments
NOV Inc. - Key offerings
NOV Inc. - Segment focus
SWOT

15.12 Schlumberger Ltd.

Schlumberger Ltd. - Overview
Schlumberger Ltd. - Business segments
Schlumberger Ltd. - Key news
Schlumberger Ltd. - Key offerings
Schlumberger Ltd. - Segment focus
SWOT

15.13 Scientific Drilling Intl.

Scientific Drilling Intl. - Overview
Scientific Drilling Intl. - Product / Service
Scientific Drilling Intl. - Key offerings
SWOT

15.14 Scout Downhole

Scout Downhole - Overview
Scout Downhole - Product / Service
Scout Downhole - Key offerings
SWOT

15.15 SenNavs

SenNavs - Overview
SenNavs - Product / Service
SenNavs - Key offerings
SWOT

15.16 Sinodrills Co. Ltd.

Sinodrills Co. Ltd. - Overview
Sinodrills Co. Ltd. - Product / Service
Sinodrills Co. Ltd. - Key offerings
SWOT

15.17 TAQA KSA

TAQA KSA - Overview
TAQA KSA - Product / Service
TAQA KSA - Key offerings
SWOT

15.18 Weatherford International Plc

Weatherford International Plc - Overview
Weatherford International Plc - Business segments
Weatherford International Plc - Key offerings
Weatherford International Plc - Segment focus
SWOT

16. Appendix

16.1 Scope of the report

Market definition
Objectives
Notes and caveats

16.2 Inclusions and exclusions checklist

Inclusions checklist
Exclusions checklist

16.3 Currency conversion rates for US$

16.4 Research methodology

16.5 Data procurement

Information sources

16.6 Data validation

16.7 Validation techniques employed for market sizing

16.8 Data synthesis

16.9 360 degree market analysis

16.10 List of abbreviations

Research Methodology

Technavio presents a detailed picture of the market by way of study, synthesis, and summation of data from multiple sources. The analysts have presented the various facets of the market with a particular focus on identifying the key industry influencers. The data thus presented is comprehensive, reliable, and the result of extensive research, both primary and secondary.

INFORMATION SOURCES

Primary sources

  • Manufacturers and suppliers
  • Channel partners
  • Industry experts
  • Strategic decision makers

Secondary sources

  • Industry journals and periodicals
  • Government data
  • Financial reports of key industry players
  • Historical data
  • Press releases

DATA ANALYSIS

Data Synthesis

  • Collation of data
  • Estimation of key figures
  • Analysis of derived insights

Data Validation

  • Triangulation with data models
  • Reference against proprietary databases
  • Corroboration with industry experts

REPORT WRITING

Qualitative

  • Market drivers
  • Market challenges
  • Market trends
  • Five forces analysis

Quantitative

  • Market size and forecast
  • Market segmentation
  • Geographical insights
  • Competitive landscape

Interested in this report?

Get your sample now to see our research methodology and insights!

Download Now

Frequently Asked Questions

Rotary Steerable Systems market growth will increase by USD 3077.2 million during 2026-2030.

The Rotary Steerable Systems market is expected to grow at a CAGR of 7.2% during 2026-2030.

Rotary Steerable Systems market is segmented by Application (Onshore, Offshore) Type (Horizontal, Directional) Technology (Push-the-bit, Point-the-bit)

Altitude Energy Partners, APS Technology Inc., Baker Hughes Co., Burintekh Ltd., D Tech Drilling Tools, DeepFast, GA Drilling AS, Halliburton Co., Landrill Oil Tools Co. Ltd., MorningStar RSS LLC, NOV Inc., Schlumberger Ltd., Scientific Drilling Intl., Scout Downhole, SenNavs, Sinodrills Co. Ltd., TAQA KSA, Weatherford International Plc are a few of the key vendors in the Rotary Steerable Systems market.

North America will register the highest growth rate of 46.1% among the other regions. Therefore, the Rotary Steerable Systems market in North America is expected to garner significant business opportunities for the vendors during the forecast period.

US, Canada, Mexico, Germany, UK, France, Italy, Spain, The Netherlands, China, Australia, Japan, India, Indonesia, Thailand, Saudi Arabia, UAE, Oman, Turkey, Israel, Brazil, Argentina, Colombia

  • Expansion of complex unconventional drilling and extended-reach reservoirs is the driving factor this market.

The Rotary Steerable Systems market vendors should focus on grabbing business opportunities from the Application segment as it accounted for the largest market share in the base year.
RIA - Research AI Assistant
Ask RIA