Rugged Devices Market Size 2026-2030
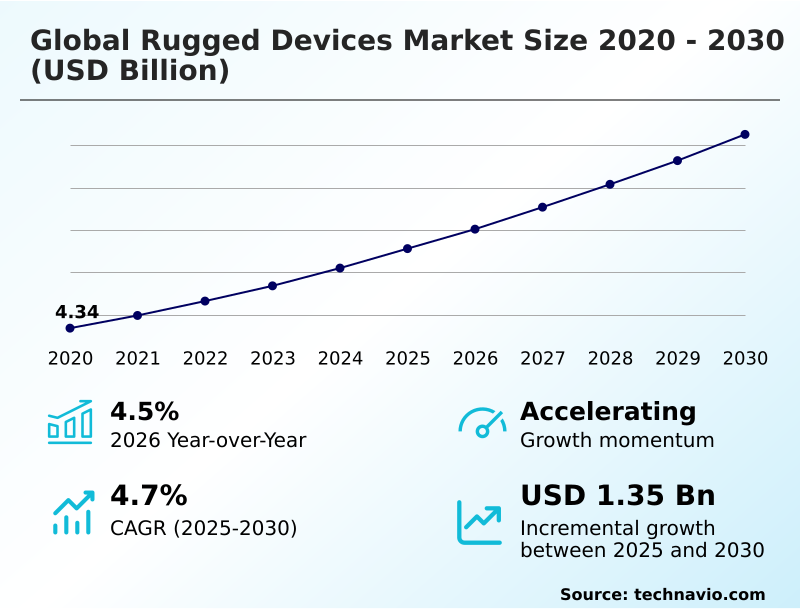
The rugged devices market size is valued to increase by USD 1.35 billion, at a CAGR of 4.7% from 2025 to 2030. Acceleration of AI and edge computing will drive the rugged devices market.
Major Market Trends & Insights
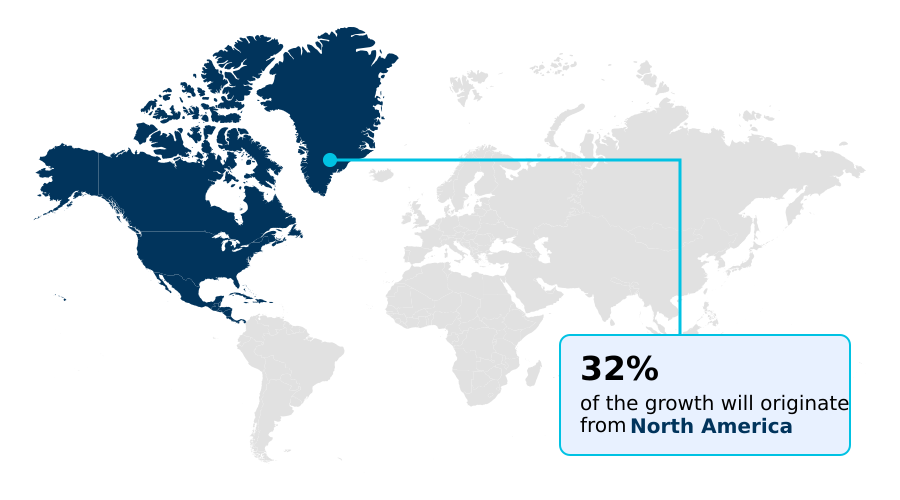
- North America dominated the market and accounted for a 32.4% growth during the forecast period.
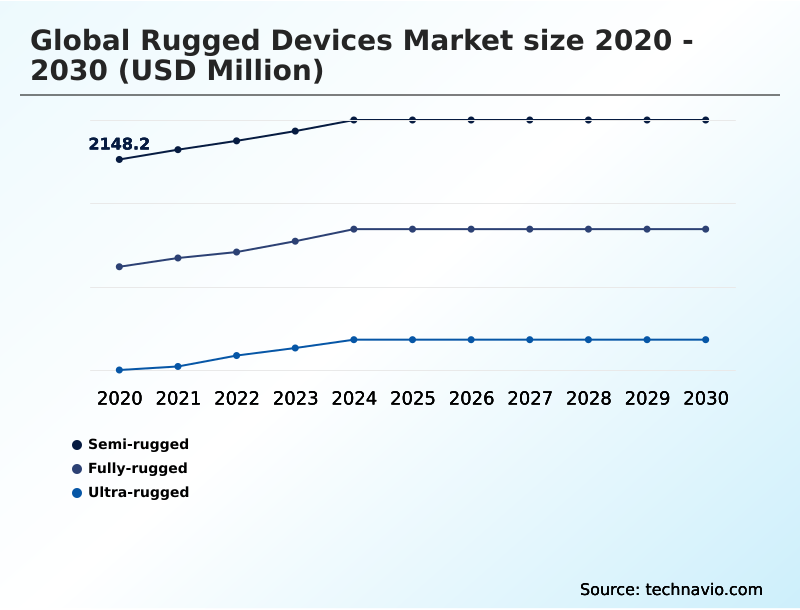
- By Type - Semi-rugged segment was valued at USD 2.41 billion in 2024
- By Product - Rugged mobile computers and smartphones segment accounted for the largest market revenue share in 2024
Market Size & Forecast
- Market Opportunities: USD 2.29 billion
- Market Future Opportunities: USD 1.35 billion
- CAGR from 2025 to 2030 : 4.7%
Market Summary
- The rugged devices market provides specialized electronic equipment engineered to operate reliably in harsh industrial, commercial, and military environments. These devices, from handhelds to tablets, are defined by their physical resilience, featuring reinforced casings, fanless thermal management, and protection against extreme temperatures, moisture, and impact.
- A key driver is the convergence of durability with advanced computing capabilities, such as edge AI and 5G connectivity, which empower mobile workforces in sectors like logistics, manufacturing, and public safety. For example, a logistics company utilizing rugged handhelds with integrated scanners and real-time data sync can optimize route planning and reduce delivery errors by over 20%.
- Key trends include the shift toward modular designs that extend product lifecycles and the adoption of wearable form factors for hands-free operation. However, high initial acquisition costs and complexities in integrating with legacy enterprise software remain significant adoption challenges for some organizations.
What will be the Size of the Rugged Devices Market during the forecast period?
Get Key Insights on Market Forecast (PDF) Get Free Sample
How is the Rugged Devices Market Segmented?
The rugged devices industry research report provides comprehensive data (region-wise segment analysis), with forecasts and estimates in "USD million" for the period 2026-2030, as well as historical data from 2020-2024 for the following segments.
- Type
- Semi-rugged
- Fully-rugged
- Ultra-rugged
- Product
- Rugged mobile computers and smartphones
- Rugged tablets and notebooks
- Rugged scanners
- Rugged air quality monitors
- End-user
- Commercial
- Industrial
- Military and defense
- Government
- Geography
- North America
- US
- Canada
- Mexico
- Europe
- Germany
- UK
- France
- APAC
- China
- Japan
- India
- South America
- Brazil
- Argentina
- Colombia
- Middle East and Africa
- Saudi Arabia
- UAE
- South Africa
- Rest of World (ROW)
- North America
By Type Insights
The semi-rugged segment is estimated to witness significant growth during the forecast period.
The semi-rugged segment bridges the gap between consumer and fully-rugged hardware, providing a balance of durability and cost for mobile workforce management.
These devices, often featuring hot-swappable batteries and push-to-talk communication, are engineered for field service automation and emergency response coordination.
While not designed for full immersion, they incorporate biometric authentication sensor technology and can withstand moderate drops, making them ideal for last-mile delivery optimization. Adoption in commercial sectors has reduced device failure rates by over 30% compared to non-specialized alternatives.
As enterprises prioritize a lower total cost of ownership, the demand for hardware that offers extreme temperature operation and reliable performance in mixed indoor/outdoor environments continues to grow.
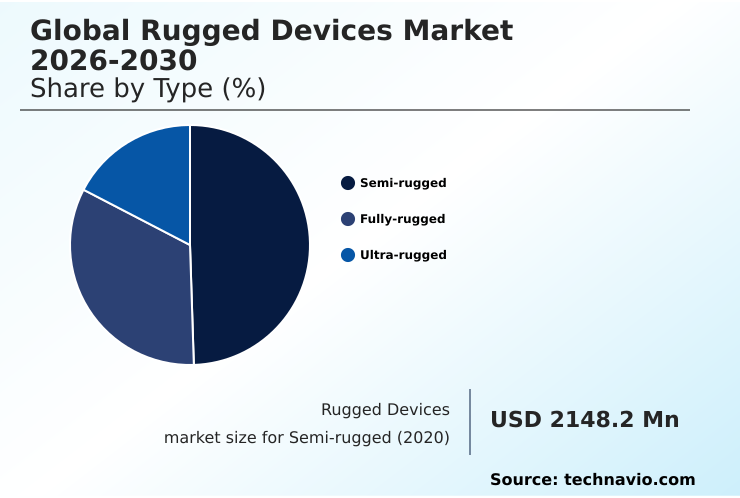
The Semi-rugged segment was valued at USD 2.41 billion in 2024 and showed a gradual increase during the forecast period.
Regional Analysis
North America is estimated to contribute 32.4% to the growth of the global market during the forecast period.Technavio’s analysts have elaborately explained the regional trends and drivers that shape the market during the forecast period.
See How Rugged Devices Market Demand is Rising in North America Get Free Sample
The geographic landscape is shaped by regional industrial needs. In North America and Europe, stringent regulations drive demand for MIL-STD-810H certified hardware with hazardous location certification for oil and gas exploration and chemical manufacturing.
APAC's growth is fueled by massive infrastructure projects requiring devices for construction site management and maritime logistics platform coordination. In these regions, IP67 ingress protection is a baseline requirement.
In South America, GNSS receiver precision is critical for agriculture and mining, while MEA focuses on utility grid maintenance. The vehicle-mounted computer remains a staple globally for logistics, with adoption growing by 12% in emerging markets.
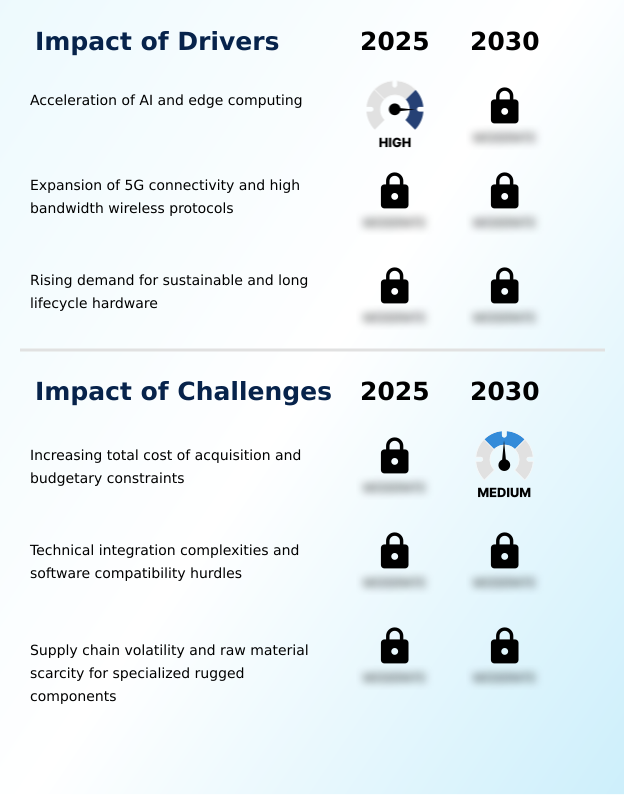
Market Dynamics
Our researchers analyzed the data with 2025 as the base year, along with the key drivers, trends, and challenges. A holistic analysis of drivers will help companies refine their marketing strategies to gain a competitive advantage.
- The adoption of specialized hardware is accelerating across industries, driven by specific operational needs. For instance, the use of an ultra-rugged tablet for mining operations is now standard for managing extraction processes in hazardous environments. In urban settings, a semi-rugged laptop for public safety vehicles provides reliable connectivity for emergency responders.
- Logistics centers are optimizing workflows with a fully-rugged handheld for warehouse inventory, which improves accuracy and speed. The efficiency of a wearable scanner for logistics order picking has been shown to improve picking rates by over 25% compared to traditional handhelds. For high-risk energy sectors, an intrinsically safe smartphone for oil rigs is essential for preventing ignition hazards.
- Many organizations now specify a rugged tablet with integrated barcode scanner to consolidate tools for field workers. Evaluating the rugged device total cost of ownership model reveals long-term savings despite higher initial costs. The capability for edge AI processing on rugged hardware enables predictive maintenance, while a 5G-enabled rugged device for field service ensures real-time data sync.
- Compliance with MIL-STD compliance for defense electronics remains a non-negotiable for military contracts. Similarly, an IP68 rated smartphone for construction sites is a baseline requirement. For supply chains, a rugged computer for extreme cold storage maintains operational continuity. The promise of non-terrestrial network connectivity for remote assets is expanding the addressable market.
- The rugged device battery life performance benchmark is a key purchasing criterion. Furthermore, a modular rugged laptop for field upgrades extends asset lifespan, and rugged tablet sunlight readability comparison influences procurement for outdoor use. A vehicle-mounted terminal for supply chain logistics optimizes fleet management, and a glove-enabled touchscreen for industrial use is critical for productivity.
- A lightweight rugged tablet for mobile salesforce combines portability with durability, while a secure rugged device for government agencies protects sensitive data.
What are the key market drivers leading to the rise in the adoption of Rugged Devices Industry?
- The acceleration of AI and edge computing capabilities integrated into mobile hardware is a key driver for the market.
- The integration of advanced processing and connectivity is a major driver. The inclusion of a dedicated NPU for edge AI enables powerful tactical edge computing and predictive analytics directly on the device, improving decision-making speed by up to 25%.
- High-speed wireless standards like 5G sub-6 connectivity and the Wi-Fi 7 module are essential for the modern smart factory interface, facilitating real-time asset tracking and seamless warehouse inventory control.
- This technological push extends to outdoor applications, where it supports the collection of precision agriculture data, with some farms reporting a 10% increase in yield through optimized resource management.
What are the market trends shaping the Rugged Devices Industry?
- A transformative trend is the adoption of hands-free wearable computing and voice-first interfaces. This shift facilitates enhanced operational efficiency in high-intensity work environments.
- A primary trend is the adoption of circular economy principles, leading to devices with field-replaceable units and modular designs that reduce e-waste by up to 40%. This shift toward sustainability is complemented by advancements in hands-free operation, with the wearable ring scanner and head-mounted display overlay improving worker productivity by 15% in logistics.
- Furthermore, non-terrestrial network integration is becoming critical, ensuring connectivity for remote diagnostic tool applications in mining and maritime sectors. This hybrid connectivity is also vital for public safety communication and telemedicine field support, where uninterrupted data flow is essential for mission-critical tasks.
What challenges does the Rugged Devices Industry face during its growth?
- The high total cost of acquisition for specialized hardware, coupled with organizational budgetary constraints, presents a key challenge to widespread market adoption.
- Despite performance advancements, significant challenges persist. The high total cost of acquisition remains a primary barrier, while software compatibility hurdles with legacy enterprise systems can delay deployment and increase costs. Physically, while features like shock-mounted hard drives and a magnesium alloy chassis improve drop-to-concrete survival, the industry faces supply chain volatility and raw material scarcity for these specialized components.
- This reliance on a complex global supply network creates risks, with lead times for certain components having increased by 20% in some cases. Furthermore, ensuring data integrity through encrypted solid-state storage adds to the upfront cost, complicating procurement for budget-constrained organizations.
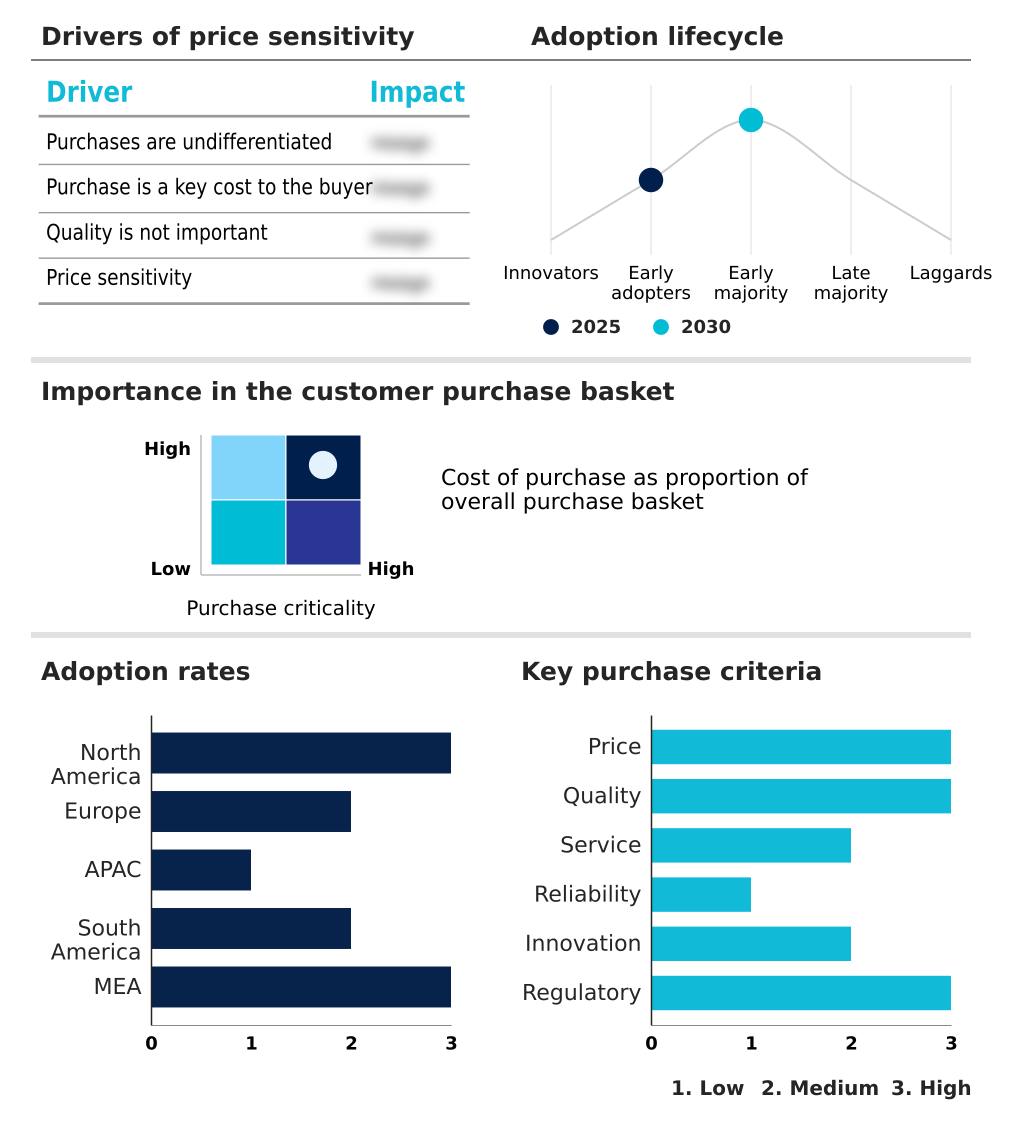
Exclusive Technavio Analysis on Customer Landscape
The rugged devices market forecasting report includes the adoption lifecycle of the market, covering from the innovator’s stage to the laggard’s stage. It focuses on adoption rates in different regions based on penetration. Furthermore, the rugged devices market report also includes key purchase criteria and drivers of price sensitivity to help companies evaluate and develop their market growth analysis strategies.
Customer Landscape of Rugged Devices Industry
Competitive Landscape
Companies are implementing various strategies, such as strategic alliances, rugged devices market forecast, partnerships, mergers and acquisitions, geographical expansion, and product/service launches, to enhance their presence in the industry.
Acer Inc. - Delivering ruggedized laptops and tablets, including Enduro and Chromebook models, engineered for resilience in field use, education, and demanding commercial applications.
The industry research and growth report includes detailed analyses of the competitive landscape of the market and information about key companies, including:
- Acer Inc.
- Advantech Co. Ltd.
- AGM
- CipherLab Co. Ltd.
- CROSSCALL
- Datalogic SpA
- Dell Technologies Inc.
- DT Research Inc.
- Getac Holdings Corp.
- Honeywell International Inc.
- Juniper Systems Inc.
- Kyocera Corp.
- MilDef Group AB
- MobileDemand Corp.
- OUKITEL
- Panasonic Holdings Corp.
- Samsung Electronics Co. Ltd.
- Sonim Technologies Inc.
- Ulefone
- Zebra Technologies Corp.
Qualitative and quantitative analysis of companies has been conducted to help clients understand the wider business environment as well as the strengths and weaknesses of key industry players. Data is qualitatively analyzed to categorize companies as pure play, category-focused, industry-focused, and diversified; it is quantitatively analyzed to categorize companies as dominant, leading, strong, tentative, and weak.
Recent Development and News in Rugged devices market
- In September 2024, Zebra Technologies Corp. introduced the ET6x series of Windows rugged enterprise tablets, featuring AI-powered touch technology that adapts to use with gloves or in wet conditions.
- In October 2024, Panasonic Holdings Corp. launched the TOUGHBOOK G2mk3 tablet, the first in its class with a dedicated neural processing unit (NPU) for on-device AI processing.
- In March 2025, Dell Technologies Inc. announced the Pro Rugged 14 laptop, equipped with a sunlight-readable screen and dual hot-swappable batteries to support extended work shifts in remote locations.
- In May 2025, Durabook, a brand of Twinhead International Corp., launched a fully-rugged notebook with a 1000-nit high-brightness screen designed for optimal visibility in direct sunlight.
Dive into Technavio’s robust research methodology, blending expert interviews, extensive data synthesis, and validated models for unparalleled Rugged Devices Market insights. See full methodology.
| Market Scope | |
|---|---|
| Page number | 307 |
| Base year | 2025 |
| Historic period | 2020-2024 |
| Forecast period | 2026-2030 |
| Growth momentum & CAGR | Accelerate at a CAGR of 4.7% |
| Market growth 2026-2030 | USD 1354.7 million |
| Market structure | Fragmented |
| YoY growth 2025-2026(%) | 4.5% |
| Key countries | US, Canada, Mexico, Germany, UK, France, Italy, Spain, Sweden, China, Japan, India, South Korea, Australia, Indonesia, Brazil, Argentina, Colombia, Saudi Arabia, UAE, South Africa, Turkey and Nigeria |
| Competitive landscape | Leading Companies, Market Positioning of Companies, Competitive Strategies, and Industry Risks |
Research Analyst Overview
- The rugged devices market is defined by hardware engineered for high-performance computing in extreme conditions. Key differentiators include MIL-STD-810H certified chassis, IP67 ingress protection, and the use of a magnesium alloy chassis for structural integrity. The integration of an NPU for edge AI is becoming standard, enabling on-device data analysis.
- Features such as hot-swappable batteries and a sunlight readable display are critical for uninterrupted field operations, while glove-touch technology ensures usability in all weather. For secure industrial applications, intrinsically safe hardware and fanless thermal management prevent system failure. Internally, shock-mounted hard drives and encrypted solid-state storage protect data integrity.
- Communications are enhanced through push-to-talk communication and non-terrestrial network integration, supported by 5G sub-6 connectivity and the latest Wi-Fi 7 module. Precision GNSS receiver precision is vital for logistics, while barcode imaging technology and RFID data capture streamline inventory. Security is paramount, with biometric authentication sensor technology becoming commonplace.
- The shift toward modular component design with field-replaceable units, like the vehicle-mounted computer, wearable ring scanner, and head-mounted display overlay, reflects a strategic focus on lifecycle management, with some enterprises reducing e-waste by over 40% through component upgrades instead of full device replacement.
What are the Key Data Covered in this Rugged Devices Market Research and Growth Report?
-
What is the expected growth of the Rugged Devices Market between 2026 and 2030?
-
USD 1.35 billion, at a CAGR of 4.7%
-
-
What segmentation does the market report cover?
-
The report is segmented by Type (Semi-rugged, Fully-rugged, and Ultra-rugged), Product (Rugged mobile computers and smartphones, Rugged tablets and notebooks, Rugged scanners, and Rugged air quality monitors), End-user (Industrial, Commercial, Military and defense, and Government) and Geography (North America, Europe, APAC, South America, Middle East and Africa)
-
-
Which regions are analyzed in the report?
-
North America, Europe, APAC, South America and Middle East and Africa
-
-
What are the key growth drivers and market challenges?
-
Acceleration of AI and edge computing, Increasing total cost of acquisition and budgetary constraints
-
-
Who are the major players in the Rugged Devices Market?
-
Acer Inc., Advantech Co. Ltd., AGM, CipherLab Co. Ltd., CROSSCALL, Datalogic SpA, Dell Technologies Inc., DT Research Inc., Getac Holdings Corp., Honeywell International Inc., Juniper Systems Inc., Kyocera Corp., MilDef Group AB, MobileDemand Corp., OUKITEL, Panasonic Holdings Corp., Samsung Electronics Co. Ltd., Sonim Technologies Inc., Ulefone and Zebra Technologies Corp.
-
Market Research Insights
- The rugged devices market is evolving beyond simple durability, focusing on intelligent hardware for mobile workforce management. The adoption of devices certified for extreme temperature operation has enabled a 20% expansion of operations into previously inaccessible climates. In logistics, the use of specialized hardware for real-time asset tracking has reduced inventory shrinkage by up to 15%.
- This shift facilitates field service automation and improves supply chain visibility. Enterprises are prioritizing solutions that support emergency response coordination and smart factory interface integration. The move toward hardware designed for a high-vibration environment has cut device failure rates by over 30% in manufacturing and transport sectors, directly improving operational continuity and reducing long-term costs.
We can help! Our analysts can customize this rugged devices market research report to meet your requirements.
 RIA -
RIA - 
