Rugged Tablet Market Analysis, Size, and Forecast 2024-2028: North America (Mexico), Europe (France, Germany, Italy, Spain, and UK), Middle East and Africa (UAE), APAC (Australia, China, India, Japan, and South Korea), South America (Brazil), and Rest of World (ROW)

Rugged Tablet Market Analysis, Size, and Forecast 2024-2028:
North America (Mexico), Europe (France, Germany, Italy, Spain, and UK), Middle East and Africa (UAE), APAC (Australia, China, India, Japan, and South Korea), South America (Brazil), and Rest of World (ROW)

Published: Jan 2024 171 Pages SKU: IRTNTR73055

Market Overview at a Glance

$208.84 Mn
Market Opportunity
4.69%
CAGR
4.3
YoY growth 2023-2024(%)

Rugged Tablet Market Size 2024-2028

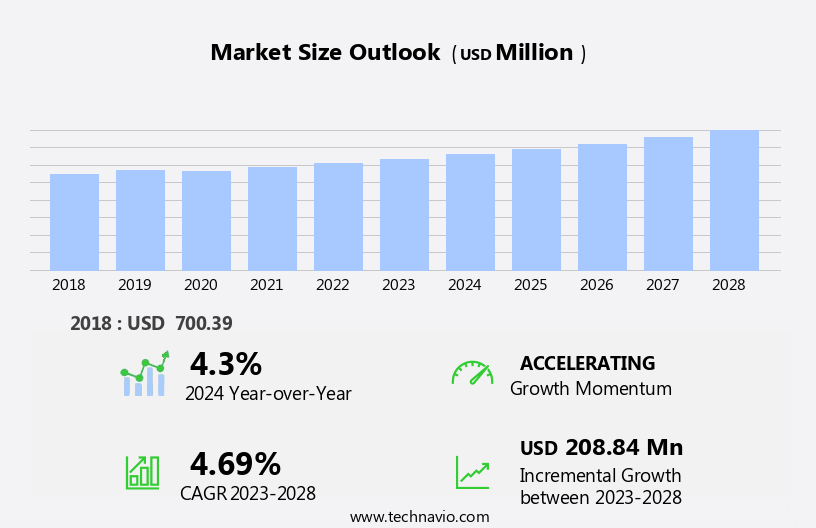
The rugged tablet market size is forecast to increase by USD 208.84 million at a CAGR of 4.69% between 2023 and 2028.

  • The market is experiencing significant growth, driven primarily by increasing demand from the defense sector and a growing preference for feature-rich devices. These devices are essential for military personnel and first responders, who require reliable and durable IOT technology to operate in harsh environments. The defense sector's demand is expected to continue, fueling market expansion. However, the high initial procurement cost of rugged tablets remains a significant challenge for both consumers and organizations. Despite this hurdle, companies can capitalize on market opportunities by offering competitive pricing and financing options. Additionally, continued innovation in rugged tablet technology, such as advanced security features and longer battery life, will further differentiate market offerings and attract buyers.
  • In summary, the market is poised for growth due to increasing demand from the defense sector and a preference for feature-rich devices, but high initial procurement costs present a significant challenge that companies must address to capitalize on market opportunities.

What will be the Size of the Rugged Tablet Market during the forecast period?

Rugged Tablet Market Size

 Request Free Sample

  • The market continues to evolve, driven by the increasing demand for reliable and durable mobile computing solutions across various sectors. These devices, characterized by their ruggedized design, long battery life, and data logging capabilities, are finding applications in law enforcement, public safety, industrial automation, workforce management, and more. The integration of mobile device management systems ensures seamless deployment and maintenance of these devices. Rugged tablets feature capacitive touchscreens, offering improved user experience and compatibility with various applications. Biometric authentication adds an extra layer of security, making these devices ideal for data-sensitive industries. Machine control and remote monitoring applications benefit from their robust design and long battery life.
  • Point of sale systems, field data collection, enterprise mobility, asset tracking, emergency response, and meter reading are just a few of the many applications that rugged tablets support. The integration of mobile payments, virtual reality, and augmented reality further expands their potential use cases. Rugged tablets undergo rigorous testing, adhering to standards such as mil-std-810g and IP rating, ensuring their ability to withstand harsh environments. Hot-swappable batteries, tablet PCs, and drop resistance add to their versatility and reliability. The ongoing development of operating systems, edge computing, cloud computing, and the Internet of Things further enhances the capabilities of rugged tablets, making them indispensable tools for businesses and organizations in need of mobile computing solutions.

How is this Rugged Tablet Industry segmented?

The rugged tablet industry research report provides comprehensive data (region-wise segment analysis), with forecasts and estimates in "USD million" for the period 2024-2028, as well as historical data from 2018-2022 for the following segments.

  • OS
    • Android
    • IOS
    • Windows
  • Technology
    • Semi-rugged
    • Fully-rugged
    • Ultra-rugged tablets
  • Size
    • Under 8 Inches
    • 8-10 Inches
    • Over 10 Inches
  • Distribution Channel
    • Online Retail
    • Direct Sales
    • Distributors
  • Geography
    • North America
      • US
      • Mexico
    • Europe
      • France
      • Germany
      • Italy
      • Spain
      • UK
    • Middle East and Africa
      • UAE
    • APAC
      • Australia
      • China
      • India
      • Japan
      • South Korea
    • South America
      • Brazil
    • Rest of World (ROW)

By OS Insights

The android segment is estimated to witness significant growth during the forecast period.

In the dynamic and evolving the market, the Android operating system holds a significant presence, catering to various industries' demands for durability and functionality. Rugged tablets, characterized by their ruggedized design and long battery life, are engineered to thrive in harsh environments. The Android OS, with its user-friendly interface and versatility, is a popular choice for these devices. Industries such as manufacturing, logistics, healthcare, and field services are adopting rugged tablets with Android OS for their unique advantages. In manufacturing, these tablets enable real-time data access, inventory management, and process monitoring on the factory floor. In logistics, they optimize supply chain visibility, asset tracking, and delivery management.

The healthcare sector leverages Android rugged tablets for patient data management, medical imaging, and point-of-care applications. Industrial automation and machine control applications benefit from rugged tablets' capacitive touchscreens and high display resolution, ensuring clear visuals for precise control. Law enforcement and public safety personnel rely on these tablets for data logging, remote monitoring, emergency response, and asset tracking. In the field of workforce management, rugged tablets facilitate efficient data collection, enabling real-time reporting and analysis. Rugged tablets' ruggedized design, with mil-std-810g certification and high drop resistance, ensures their durability in challenging conditions. Additionally, features like hot-swappable batteries, mobile device management, and mobile computing enable seamless integration into enterprise mobility solutions.

The integration of edge computing, cloud computing, and the Internet of Things further enhances their capabilities in various applications. In the realm of patient care, rugged tablets with high contrast ratio and Android OS facilitate efficient data management and communication between healthcare professionals. Virtual and augmented reality technologies, integrated into rugged tablets, offer immersive experiences for training, simulation, fingerprint sensor,  and remote assistance. In summary, The market is witnessing significant growth, with the Android operating system playing a pivotal role in catering to the diverse needs of industries. Rugged tablets' capabilities, including data security, biometric authentication, machine control, industrial automation, workforce management, data logging, remote monitoring, asset tracking, emergency response, and patient care, make them indispensable tools for various sectors.

Rugged Tablet Market Size

Request Free Sample

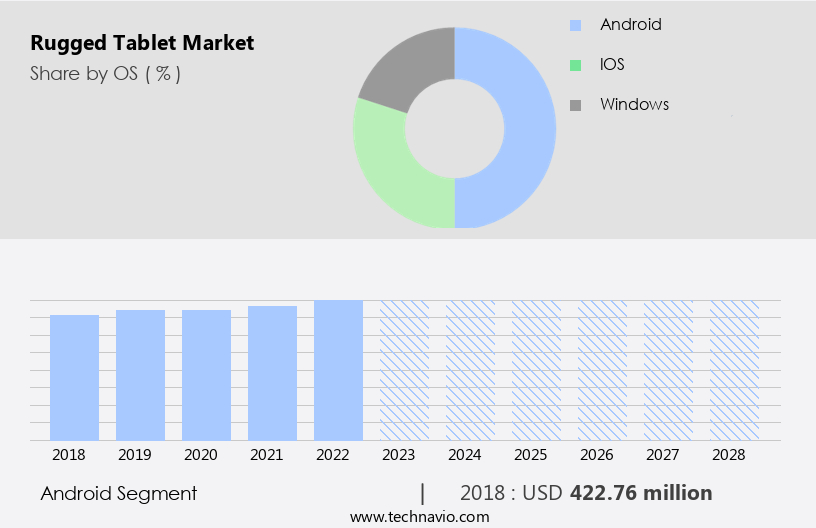
The Android segment was valued at USD 422.76 million in 2018 and showed a gradual increase during the forecast period.

Regional Analysis

North America is estimated to contribute 33% to the growth of the global market during the forecast period.Technavio's analysts have elaborately explained the regional trends and drivers that shape the market during the forecast period.

Rugged Tablet Market Share by Geography

 Request Free Sample

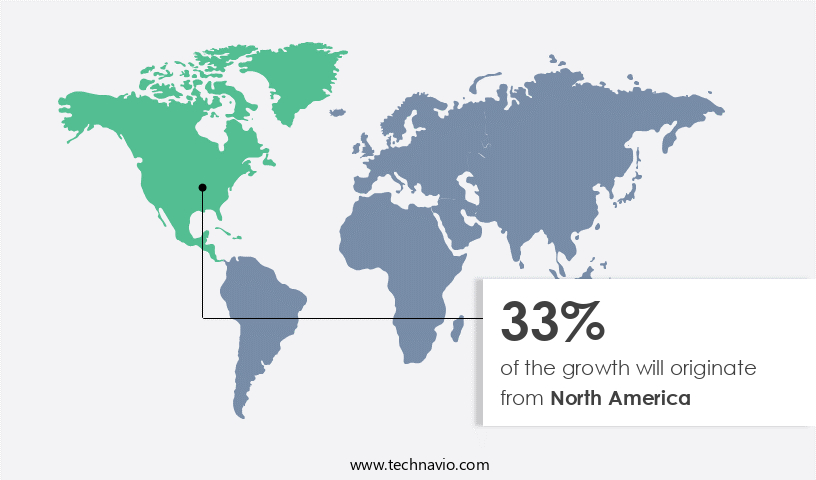
In the dynamic business landscape of North America, the adoption of advanced technologies is at an all-time high, particularly in the industrial and defense sectors. These industries prioritize ruggedized solutions to maintain competitiveness and thrive in the technology-driven business environment. The region, home to some of the world's most advanced and developing economies, is a significant market for rugged tablets. The defense and military segment is the primary driver of demand for rugged tablets due to the need for robust, shockproof devices. Furthermore, the growth of the logistics and retail sectors has increased the demand for rugged tablets in the region.

These devices offer essential features such as biometric authentication, projected capacitive touchscreens, and long battery life, making them ideal for machine control, data logging, and field data collection. In addition, rugged tablets are increasingly being used in industrial automation, workforce management, remote monitoring, asset tracking, emergency response, and meter reading. The integration of technologies like mil-std-810g, edge computing, cloud computing, and the Internet of Things further enhances their capabilities. Rugged tablets cater to various industries, including law enforcement, public safety, patient care, and field service, offering solutions for point of sale, mobile payments, virtual reality, and augmented reality applications.

With features like hot-swappable batteries, ruggedized design, and high-resolution displays, these tablets are ideal for use in harsh environments and demanding applications. The operating system and ip rating ensure seamless integration with mobile device management systems, ensuring data security and efficient mobile computing.

Market Dynamics

Our researchers analyzed the data with 2023 as the base year, along with the key drivers, trends, and challenges. A holistic analysis of drivers will help companies refine their marketing strategies to gain a competitive advantage.

The Global Rugged Tablet Market grows with rugged tablets for military and IP68 rugged tablets for industry. Rugged tablet market trends highlight rugged tablets for logistics and rugged tablets with 5G connectivity. Rugged tablets for construction and rugged tablets for healthcare ensure durability, per rugged tablet market forecast. MIL-STD-810G rugged tablets leverage rugged tablets with IoT integration, while rugged tablets for field services enhance mobility. Rugged tablets for oil and gas and rugged tablets for public safety drive demand. Rugged tablets for warehouse management, high-performance rugged tablets, and rugged tablets for outdoor use optimize operations. Rugged tablets for transportation, sustainable rugged tablet designs, rugged tablets for mining, advanced rugged tablet processors, rugged tablet market supply chain, and rugged tablets for remote work fuel growth through forecast year.

What are the key market drivers leading to the rise in the adoption of Rugged Tablet Industry?

  • The defense sector's escalating demand serves as the primary catalyst for market growth. 
  • In the defense sector, maximizing productivity is a top priority, and secure wireless and cellular broadband technologies have become essential components of military information infrastructures. Rugged tablets play a crucial role in facilitating the secure flow of information between personnel through these networks. The adoption of rugged tablets in the defense sector is driven by the real-time transmission and review of data, which is a significant advantage in critical situations. The emergence of secure networks in both wireless LAN and cellular broadband has enabled military personnel to access vital information from anywhere, enhancing situational awareness and decision-making capabilities. The ruggedness of these tablets ensures they can withstand harsh environments and drop resistance, making them ideal for use in various military applications.
  • Moreover, the integration of edge computing and cloud computing technologies with rugged tablets has expanded their functionality. Edge computing allows data processing to occur at the source, reducing latency and improving response times, while cloud computing enables secure access to vast amounts of data and applications from anywhere. The Internet of Things (IoT) and field service applications are also benefiting from the use of rugged tablets in the defense sector. These technologies enable real-time monitoring and control of equipment and systems, improving efficiency and reducing downtime. Overall, rugged tablets are a critical component of modern military technology, enabling command and control, warehouse management, and various other applications in a secure and efficient manner.

What are the market trends shaping the Rugged Tablet Industry?

  • The increasing demand for feature-rich devices represents a significant market trend. Professionals and consumers alike prioritize devices that offer advanced functionalities and capabilities.
  • The market has experienced significant growth due to the increasing demand for portable devices that offer superior data security and durability in various industries, such as law enforcement, public safety, machine control, industrial automation, and workforce management. While most rugged tablets still run on Windows CE or Windows Mobile OS, there has been an effort to introduce Android-based industrial handheld devices in the past five years. However, the market for Android-powered rugged tablets has not yet matched the growth of the Windows-based market. Manufacturers have responded to the evolving technology landscape by upgrading the hardware of rugged tablets, including processors, storage, memory, and displays, to accommodate newer operating systems.
  • Notable trends in the market include the broader acceptance of capacitive multi-touch technology, increased display sizes, and the integration of advanced features such as radio-frequency identification (RFID), Global Positioning System (GPS), high-quality imagers and scanners, multi-sensor technology, and integrated high-resolution cameras. These advancements enhance the functionality and versatility of rugged tablets, making them indispensable tools for businesses and organizations that require reliable, secure, and durable mobile computing solutions.

What challenges does the Rugged Tablet Industry face during its growth?

  • The high initial procurement cost of rugged tablets poses a significant challenge to the industry's growth trajectory. Rugged tablets, known for their durability and resistance to harsh environments, come with a premium price tag that can hinder market expansion. This cost barrier may deter potential buyers, particularly small and medium-sized enterprises, from investing in these devices, thereby limiting the industry's growth potential. 
  • Rugged tablets are specialized mobile computing devices designed for data logging and mobile computing in challenging environments. Their ruggedized design ensures quality control in industries requiring field data collection, point of sale transactions, remote monitoring, asset tracking, emergency response, and mobile device management. Despite their higher initial procurement cost, rugged tablets offer lower total cost of ownership (TCO) due to their durability and reliability throughout their product life cycle. However, commercial-grade tablets are increasingly challenging the market as they can perform similar functions.
  • Rugged tablets offer ingress protection against solid substances, shockproofing, and drop resistance, which are essential for certain applications. Yet, many commercial and industrial applications do not necessitate high ingress protection or protection against liquids. Regardless, rugged tablets remain indispensable for industries where data integrity and operational efficiency are paramount.

Exclusive Customer Landscape

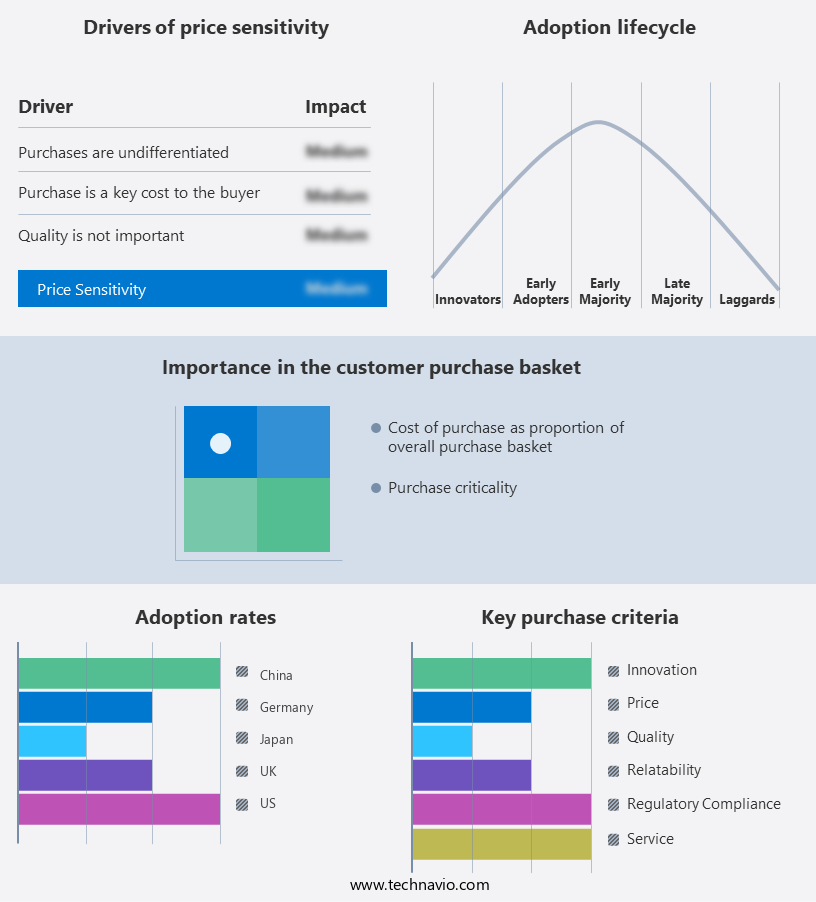
The rugged tablet market forecasting report includes the adoption lifecycle of the market, covering from the innovator's stage to the laggard's stage. It focuses on adoption rates in different regions based on penetration. Furthermore, the rugged tablet market report also includes key purchase criteria and drivers of price sensitivity to help companies evaluate and develop their market growth analysis strategies.

Rugged Tablet Market Share by Geography

 Customer Landscape

Key Companies & Market Insights

Companies are implementing various strategies, such as strategic alliances, rugged tablet market forecast, partnerships, mergers and acquisitions, geographical expansion, and product/service launches, to enhance their presence in the industry.

The industry research and growth report includes detailed analyses of the competitive landscape of the market and information about key companies, including:

  • Panasonic
  • Getac
  • Zebra Technologies
  • DT Research
  • Xplore Technologies
  • Dell
  • HP
  • Lenovo
  • Samsung
  • Apple
  • Microsoft
  • Trimble
  • MobileDemand
  • AAEON
  • Advantech
  • Kontron
  • MilDef
  • Winmate
  • RuggON
  • Logic Instrument

Qualitative and quantitative analysis of companies has been conducted to help clients understand the wider business environment as well as the strengths and weaknesses of key industry players. Data is qualitatively analyzed to categorize companies as pure play, category-focused, industry-focused, and diversified; it is quantitatively analyzed to categorize companies as dominant, leading, strong, tentative, and weak.

Recent Development and News in Rugged Tablet Market

  • In February 2023, Panasonic Corporation announced the launch of its newest rugged tablet, the Toughbook FZ-X1, featuring an Intel vPro platform and a detachable keyboard, catering to enterprise customers in industries such as public safety, transportation, and logistics (Panasonic Corporation Press Release, 2023).
  • In May 2024, Honeywell and Microsoft entered into a strategic partnership to integrate Microsoft's Azure IoT and Power BI services with Honeywell's rugged tablets, enhancing the capabilities of these devices for industrial applications and enabling real-time data analysis (Microsoft News Center, 2024).
  • In September 2024, Getac Technology Corporation raised USD50 million in a Series C funding round, led by WI Harper Group, to accelerate its research and development efforts and expand its global presence in the market (Getac Technology Corporation Press Release, 2024).

Research Analyst Overview

The market is experiencing significant advancements, with a focus on enhancing device functionality and security. Predictive maintenance and remote diagnostics enable proactive problem-solving, reducing downtime and maintenance costs. Thermal shock resistance ensures uninterrupted performance in extreme temperatures. Device security is a priority, with features such as secure boot, hardware encryption, and data encryption safeguarding sensitive information. Bar code scanners and RFID readers streamline inventory management, while voice control and glove-friendly touchscreens improve usability. Wearable computing and mobile application development expand tablet applications, enabling remote access and asset management. GPS tracking and geospatial mapping provide real-time location data for improved efficiency and productivity.

Big data, data analytics, and machine learning facilitate informed decision-making, while artificial intelligence and facial recognition enhance user experience. Durability testing and network security ensure device longevity and data protection. Vibration resistance and solar readability cater to industrial applications, and stylus support and custom software solutions cater to specific business needs. Software updates and device lifecycle management ensure optimal performance and longevity.

Dive into Technavio's robust research methodology, blending expert interviews, extensive data synthesis, and validated models for unparalleled Rugged Tablet Market insights. See full methodology.

Market Scope

Report Coverage

Details

Page number

171

Base year

2023

Historic period

2018-2022

Forecast period

2024-2028

Growth momentum & CAGR

Accelerate at a CAGR of 4.69%

Market growth 2024-2028

USD 208.84 million

Market structure

Fragmented

YoY growth 2023-2024(%)

4.3

Key countries

US, China, Germany, Japan, UK, Australia, India, France, Brazil, UAE, Rest of World (ROW), Saudi Arabia, France, South Korea, Mexico, Italy, and Spain

Competitive landscape

Leading Companies, Market Positioning of Companies, Competitive Strategies, and Industry Risks

Request Free Sample

What are the Key Data Covered in this Rugged Tablet Market Research and Growth Report?

  • CAGR of the Rugged Tablet industry during the forecast period
  • Detailed information on factors that will drive the growth and forecasting between 2024 and 2028
  • Precise estimation of the size of the market and its contribution of the industry in focus to the parent market
  • Accurate predictions about upcoming growth and trends and changes in consumer behaviour
  • Growth of the market across North America, Europe, APAC, South America, and Middle East and Africa
  • Thorough analysis of the market's competitive landscape and detailed information about companies
  • Comprehensive analysis of factors that will challenge the rugged tablet market growth of industry companies

We can help! Our analysts can customize this rugged tablet market research report to meet your requirements.

Get in touch

1 Executive Summary

  • 1.1 Market overview
    • Exhibit 01: Executive Summary – Chart on Market Overview
    • Exhibit 02: Executive Summary – Data Table on Market Overview
    • Exhibit 03: Executive Summary – Chart on Global Market Characteristics
    • Exhibit 04: Executive Summary – Chart on Market by Geography
    • Exhibit 05: Executive Summary – Chart on Market Segmentation by OS
    • Exhibit 06: Executive Summary – Chart on Market Segmentation by Technology
    • Exhibit 07: Executive Summary – Chart on Incremental Growth
    • Exhibit 08: Executive Summary – Data Table on Incremental Growth
    • Exhibit 09: Executive Summary – Chart on Vendor Market Positioning

2 Market Landscape

  • 2.1 Market ecosystem
    • Exhibit 10: Parent market
    • Exhibit 11: Market Characteristics

3 Market Sizing

  • 3.1 Market definition
    • Exhibit 12: Offerings of vendors included in the market definition
  • 3.2 Market segment analysis
    • Exhibit 13: Market segments
  • 3.3 Market size 2023
    • 3.4 Market outlook: Forecast for 2023-2028
      • Exhibit 14: Chart on Global - Market size and forecast 2023-2028 ($ million)
      • Exhibit 15: Data Table on Global - Market size and forecast 2023-2028 ($ million)
      • Exhibit 16: Chart on Global Market: Year-over-year growth 2023-2028 (%)
      • Exhibit 17: Data Table on Global Market: Year-over-year growth 2023-2028 (%)

    4 Historic Market Size

    • 4.1 Global rugged tablet market 2018 - 2022
      • Exhibit 18: Historic Market Size – Data Table on global rugged tablet market 2018 - 2022 ($ million)
    • 4.2 OS Segment Analysis 2018 - 2022
      • Exhibit 19: Historic Market Size – OS Segment 2018 - 2022 ($ million)
    • 4.3 Technology Segment Analysis 2018 - 2022
      • Exhibit 20: Historic Market Size – Technology Segment 2018 - 2022 ($ million)
    • 4.4 Geography Segment Analysis 2018 - 2022
      • Exhibit 21: Historic Market Size – Geography Segment 2018 - 2022 ($ million)
    • 4.5 Country Segment Analysis 2018 - 2022
      • Exhibit 22: Historic Market Size – Country Segment 2018 - 2022 ($ million)

    5 Five Forces Analysis

    • 5.1 Five forces summary
      • Exhibit 23: Five forces analysis - Comparison between 2023 and 2028
    • 5.2 Bargaining power of buyers
      • Exhibit 24: Chart on Bargaining power of buyers – Impact of key factors 2023 and 2028
    • 5.3 Bargaining power of suppliers
      • Exhibit 25: Bargaining power of suppliers – Impact of key factors in 2023 and 2028
    • 5.4 Threat of new entrants
      • Exhibit 26: Threat of new entrants – Impact of key factors in 2023 and 2028
    • 5.5 Threat of substitutes
      • Exhibit 27: Threat of substitutes – Impact of key factors in 2023 and 2028
    • 5.6 Threat of rivalry
      • Exhibit 28: Threat of rivalry – Impact of key factors in 2023 and 2028
    • 5.7 Market condition
      • Exhibit 29: Chart on Market condition - Five forces 2023 and 2028

    6 Market Segmentation by OS

    • 6.1 Market segments
      • Chart on OS - Market share (2023-2028) (%)
      • Data Table on OS - Market share (2023-2028) (%)
    • 6.2 Comparison by OS
      • Chart on Comparison by OS
      • Data Table on Comparison by OS
    • 6.3 Android - Market size and forecast (2023-2028)
      • Chart on Android - Market size and forecast (2023-2028) ($ million)
      • Data Table on Android - Market size and forecast (2023-2028) ($ million)
      • Chart on Android - Year-over-year growth (2023-2028) (%)
      • Data Table on Android - Year-over-year growth (2023-2028) (%)
    • 6.4 IOS - Market size and forecast (2023-2028)
      • Chart on IOS - Market size and forecast (2023-2028) ($ million)
      • Data Table on IOS - Market size and forecast (2023-2028) ($ million)
      • Chart on IOS - Year-over-year growth (2023-2028) (%)
      • Data Table on IOS - Year-over-year growth (2023-2028) (%)
    • 6.5 Windows - Market size and forecast (2023-2028)
      • Chart on Windows - Market size and forecast (2023-2028) ($ million)
      • Data Table on Windows - Market size and forecast (2023-2028) ($ million)
      • Chart on Windows - Year-over-year growth (2023-2028) (%)
      • Data Table on Windows - Year-over-year growth (2023-2028) (%)
    • 6.6 Market opportunity by OS
      • Market opportunity by OS ($ million)
      • Data Table on Market opportunity by OS ($ million)

    7 Market Segmentation by Technology

    • 7.1 Market segments
      • Chart on Technology - Market share (2023-2028) (%)
      • Data Table on Technology - Market share (2023-2028) (%)
    • 7.2 Comparison by Technology
      • Chart on Comparison by Technology
      • Data Table on Comparison by Technology
    • 7.3 Semi-rugged - Market size and forecast (2023-2028)
      • Chart on Semi-rugged - Market size and forecast (2023-2028) ($ million)
      • Data Table on Semi-rugged - Market size and forecast (2023-2028) ($ million)
      • Chart on Semi-rugged - Year-over-year growth (2023-2028) (%)
      • Data Table on Semi-rugged - Year-over-year growth (2023-2028) (%)
    • 7.4 Fully-rugged - Market size and forecast (2023-2028)
      • Chart on Fully-rugged - Market size and forecast (2023-2028) ($ million)
      • Data Table on Fully-rugged - Market size and forecast (2023-2028) ($ million)
      • Chart on Fully-rugged - Year-over-year growth (2023-2028) (%)
      • Data Table on Fully-rugged - Year-over-year growth (2023-2028) (%)
    • 7.5 Ultra-rugged tablets - Market size and forecast (2023-2028)
      • Chart on Ultra-rugged tablets - Market size and forecast (2023-2028) ($ million)
      • Data Table on Ultra-rugged tablets - Market size and forecast (2023-2028) ($ million)
      • Chart on Ultra-rugged tablets - Year-over-year growth (2023-2028) (%)
      • Data Table on Ultra-rugged tablets - Year-over-year growth (2023-2028) (%)
    • 7.6 Market opportunity by Technology
      • Market opportunity by Technology ($ million)
      • Data Table on Market opportunity by Technology ($ million)

    8 Market Segmentation by Size

    • 8.1 Market segments
      • Chart on Size - Market share (2023-2028) (%)
      • Data Table on Size - Market share (2023-2028) (%)
    • 8.2 Comparison by Size
      • Chart on Comparison by Size
      • Data Table on Comparison by Size
    • 8.3 Under 8 Inches - Market size and forecast (2023-2028)
      • Chart on Under 8 Inches - Market size and forecast (2023-2028) ($ million)
      • Data Table on Under 8 Inches - Market size and forecast (2023-2028) ($ million)
      • Chart on Under 8 Inches - Year-over-year growth (2023-2028) (%)
      • Data Table on Under 8 Inches - Year-over-year growth (2023-2028) (%)
    • 8-10 Inches - Market size and forecast (2023-2028)
      • Chart on 8-10 Inches - Market size and forecast (2023-2028) ($ million)
      • Data Table on 8-10 Inches - Market size and forecast (2023-2028) ($ million)
      • Chart on 8-10 Inches - Year-over-year growth (2023-2028) (%)
      • Data Table on 8-10 Inches - Year-over-year growth (2023-2028) (%)
    • 8.5 Over 10 Inches - Market size and forecast (2023-2028)
      • Chart on Over 10 Inches - Market size and forecast (2023-2028) ($ million)
      • Data Table on Over 10 Inches - Market size and forecast (2023-2028) ($ million)
      • Chart on Over 10 Inches - Year-over-year growth (2023-2028) (%)
      • Data Table on Over 10 Inches - Year-over-year growth (2023-2028) (%)
    • 8.6 Market opportunity by Size
      • Market opportunity by Size ($ million)
      • Data Table on Market opportunity by Size ($ million)

    9 Market Segmentation by Distribution Channel

    • 9.1 Market segments
      • Chart on Distribution Channel - Market share (2023-2028) (%)
      • Data Table on Distribution Channel - Market share (2023-2028) (%)
    • 9.2 Comparison by Distribution Channel
      • Chart on Comparison by Distribution Channel
      • Data Table on Comparison by Distribution Channel
    • 9.3 Online Retail - Market size and forecast (2023-2028)
      • Chart on Online Retail - Market size and forecast (2023-2028) ($ million)
      • Data Table on Online Retail - Market size and forecast (2023-2028) ($ million)
      • Chart on Online Retail - Year-over-year growth (2023-2028) (%)
      • Data Table on Online Retail - Year-over-year growth (2023-2028) (%)
    • 9.4 Direct Sales - Market size and forecast (2023-2028)
      • Chart on Direct Sales - Market size and forecast (2023-2028) ($ million)
      • Data Table on Direct Sales - Market size and forecast (2023-2028) ($ million)
      • Chart on Direct Sales - Year-over-year growth (2023-2028) (%)
      • Data Table on Direct Sales - Year-over-year growth (2023-2028) (%)
    • 9.5 Distributors - Market size and forecast (2023-2028)
      • Chart on Distributors - Market size and forecast (2023-2028) ($ million)
      • Data Table on Distributors - Market size and forecast (2023-2028) ($ million)
      • Chart on Distributors - Year-over-year growth (2023-2028) (%)
      • Data Table on Distributors - Year-over-year growth (2023-2028) (%)
    • 9.6 Market opportunity by Distribution Channel
      • Market opportunity by Distribution Channel ($ million)
      • Data Table on Market opportunity by Distribution Channel ($ million)

    8 Customer Landscape

    • 8.1 Customer landscape overview
      • Exhibit 66: Analysis of price sensitivity, lifecycle, customer purchase basket, adoption rates, and purchase criteria

    9 Geographic Landscape

    • 9.1 Geographic segmentation
      • Exhibit 67: Chart on Market share by geography 2023-2028 (%)
      • Exhibit 68: Data Table on Market share by geography 2023-2028 (%)
    • 9.2 Geographic comparison
      • Exhibit 69: Chart on Geographic comparison
      • Exhibit 70: Data Table on Geographic comparison
    • 9.3 North America - Market size and forecast 2023-2028
      • Exhibit 71: Chart on North America - Market size and forecast 2023-2028 ($ million)
      • Exhibit 72: Data Table on North America - Market size and forecast 2023-2028 ($ million)
      • Exhibit 73: Chart on North America - Year-over-year growth 2023-2028 (%)
      • Exhibit 74: Data Table on North America - Year-over-year growth 2023-2028 (%)
    • 9.4 Europe - Market size and forecast 2023-2028
      • Exhibit 75: Chart on Europe - Market size and forecast 2023-2028 ($ million)
      • Exhibit 76: Data Table on Europe - Market size and forecast 2023-2028 ($ million)
      • Exhibit 77: Chart on Europe - Year-over-year growth 2023-2028 (%)
      • Exhibit 78: Data Table on Europe - Year-over-year growth 2023-2028 (%)
    • 9.5 APAC - Market size and forecast 2023-2028
      • Exhibit 79: Chart on APAC - Market size and forecast 2023-2028 ($ million)
      • Exhibit 80: Data Table on APAC - Market size and forecast 2023-2028 ($ million)
      • Exhibit 81: Chart on APAC - Year-over-year growth 2023-2028 (%)
      • Exhibit 82: Data Table on APAC - Year-over-year growth 2023-2028 (%)
    • 9.6 South America - Market size and forecast 2023-2028
      • Exhibit 83: Chart on South America - Market size and forecast 2023-2028 ($ million)
      • Exhibit 84: Data Table on South America - Market size and forecast 2023-2028 ($ million)
      • Exhibit 85: Chart on South America - Year-over-year growth 2023-2028 (%)
      • Exhibit 86: Data Table on South America - Year-over-year growth 2023-2028 (%)
    • 9.7 Middle East and Africa - Market size and forecast 2023-2028
      • Exhibit 87: Chart on Middle East and Africa - Market size and forecast 2023-2028 ($ million)
      • Exhibit 88: Data Table on Middle East and Africa - Market size and forecast 2023-2028 ($ million)
      • Exhibit 89: Chart on Middle East and Africa - Year-over-year growth 2023-2028 (%)
      • Exhibit 90: Data Table on Middle East and Africa - Year-over-year growth 2023-2028 (%)
    • 9.8 US - Market size and forecast 2023-2028
      • Exhibit 91: Chart on US - Market size and forecast 2023-2028 ($ million)
      • Exhibit 92: Data Table on US - Market size and forecast 2023-2028 ($ million)
      • Exhibit 93: Chart on US - Year-over-year growth 2023-2028 (%)
      • Exhibit 94: Data Table on US - Year-over-year growth 2023-2028 (%)
    • 9.9 China - Market size and forecast 2023-2028
      • Exhibit 95: Chart on China - Market size and forecast 2023-2028 ($ million)
      • Exhibit 96: Data Table on China - Market size and forecast 2023-2028 ($ million)
      • Exhibit 97: Chart on China - Year-over-year growth 2023-2028 (%)
      • Exhibit 98: Data Table on China - Year-over-year growth 2023-2028 (%)
    • 9.10 Germany - Market size and forecast 2023-2028
      • Exhibit 99: Chart on Germany - Market size and forecast 2023-2028 ($ million)
      • Exhibit 100: Data Table on Germany - Market size and forecast 2023-2028 ($ million)
      • Exhibit 101: Chart on Germany - Year-over-year growth 2023-2028 (%)
      • Exhibit 102: Data Table on Germany - Year-over-year growth 2023-2028 (%)
    • 9.11 UK - Market size and forecast 2023-2028
      • Exhibit 103: Chart on UK - Market size and forecast 2023-2028 ($ million)
      • Exhibit 104: Data Table on UK - Market size and forecast 2023-2028 ($ million)
      • Exhibit 105: Chart on UK - Year-over-year growth 2023-2028 (%)
      • Exhibit 106: Data Table on UK - Year-over-year growth 2023-2028 (%)
    • 9.12 Japan - Market size and forecast 2023-2028
      • Exhibit 107: Chart on Japan - Market size and forecast 2023-2028 ($ million)
      • Exhibit 108: Data Table on Japan - Market size and forecast 2023-2028 ($ million)
      • Exhibit 109: Chart on Japan - Year-over-year growth 2023-2028 (%)
      • Exhibit 110: Data Table on Japan - Year-over-year growth 2023-2028 (%)
    • 9.13 Market opportunity by geography
      • Exhibit 111: Market opportunity by geography ($ million)
      • Exhibit 112: Data Tables on Market opportunity by geography ($ million)
    • 11.14 US - Market size and forecast (2023-2028)
      • Chart on US - Market size and forecast (2023-2028) ($ million)
      • Data Table on US - Market size and forecast (2023-2028) ($ million)
      • Chart on US - Year-over-year growth (2023-2028) (%)
      • Data Table on US - Year-over-year growth (2023-2028) (%)
    • 11.15 Australia - Market size and forecast (2023-2028)
      • Chart on Australia - Market size and forecast (2023-2028) ($ million)
      • Data Table on Australia - Market size and forecast (2023-2028) ($ million)
      • Chart on Australia - Year-over-year growth (2023-2028) (%)
      • Data Table on Australia - Year-over-year growth (2023-2028) (%)
    • 11.16 India - Market size and forecast (2023-2028)
      • Chart on India - Market size and forecast (2023-2028) ($ million)
      • Data Table on India - Market size and forecast (2023-2028) ($ million)
      • Chart on India - Year-over-year growth (2023-2028) (%)
      • Data Table on India - Year-over-year growth (2023-2028) (%)
    • 11.17 France - Market size and forecast (2023-2028)
      • Chart on France - Market size and forecast (2023-2028) ($ million)
      • Data Table on France - Market size and forecast (2023-2028) ($ million)
      • Chart on France - Year-over-year growth (2023-2028) (%)
      • Data Table on France - Year-over-year growth (2023-2028) (%)
    • 11.18 Brazil - Market size and forecast (2023-2028)
      • Chart on Brazil - Market size and forecast (2023-2028) ($ million)
      • Data Table on Brazil - Market size and forecast (2023-2028) ($ million)
      • Chart on Brazil - Year-over-year growth (2023-2028) (%)
      • Data Table on Brazil - Year-over-year growth (2023-2028) (%)
    • 11.19 UAE - Market size and forecast (2023-2028)
      • Chart on UAE - Market size and forecast (2023-2028) ($ million)
      • Data Table on UAE - Market size and forecast (2023-2028) ($ million)
      • Chart on UAE - Year-over-year growth (2023-2028) (%)
      • Data Table on UAE - Year-over-year growth (2023-2028) (%)
    • 11.20 Rest of World (ROW) - Market size and forecast (2023-2028)
      • Chart on Rest of World (ROW) - Market size and forecast (2023-2028) ($ million)
      • Data Table on Rest of World (ROW) - Market size and forecast (2023-2028) ($ million)
      • Chart on Rest of World (ROW) - Year-over-year growth (2023-2028) (%)
      • Data Table on Rest of World (ROW) - Year-over-year growth (2023-2028) (%)
    • 11.21 Saudi Arabia - Market size and forecast (2023-2028)
      • Chart on Saudi Arabia - Market size and forecast (2023-2028) ($ million)
      • Data Table on Saudi Arabia - Market size and forecast (2023-2028) ($ million)
      • Chart on Saudi Arabia - Year-over-year growth (2023-2028) (%)
      • Data Table on Saudi Arabia - Year-over-year growth (2023-2028) (%)
    • 11.22 South Korea - Market size and forecast (2023-2028)
      • Chart on South Korea - Market size and forecast (2023-2028) ($ million)
      • Data Table on South Korea - Market size and forecast (2023-2028) ($ million)
      • Chart on South Korea - Year-over-year growth (2023-2028) (%)
      • Data Table on South Korea - Year-over-year growth (2023-2028) (%)
    • 11.23 Mexico - Market size and forecast (2023-2028)
      • Chart on Mexico - Market size and forecast (2023-2028) ($ million)
      • Data Table on Mexico - Market size and forecast (2023-2028) ($ million)
      • Chart on Mexico - Year-over-year growth (2023-2028) (%)
      • Data Table on Mexico - Year-over-year growth (2023-2028) (%)
    • 11.24 Italy - Market size and forecast (2023-2028)
      • Chart on Italy - Market size and forecast (2023-2028) ($ million)
      • Data Table on Italy - Market size and forecast (2023-2028) ($ million)
      • Chart on Italy - Year-over-year growth (2023-2028) (%)
      • Data Table on Italy - Year-over-year growth (2023-2028) (%)
    • 11.25 Spain - Market size and forecast (2023-2028)
      • Chart on Spain - Market size and forecast (2023-2028) ($ million)
      • Data Table on Spain - Market size and forecast (2023-2028) ($ million)
      • Chart on Spain - Year-over-year growth (2023-2028) (%)
      • Data Table on Spain - Year-over-year growth (2023-2028) (%)

    10 Drivers, Challenges, and Trends

    • 10.1 Market drivers
      • 10.2 Market challenges
        • 10.3 Impact of drivers and challenges
          • Exhibit 113: Impact of drivers and challenges in 2023 and 2028
        • 10.4 Market trends

          11 Vendor Landscape

          • 11.1 Overview
            • 11.2 Vendor landscape
              • Exhibit 114: Overview on Criticality of inputs and Factors of differentiation
            • 11.3 Landscape disruption
              • Exhibit 115: Overview on factors of disruption
            • 11.4 Industry risks
              • Exhibit 116: Impact of key risks on business

            14 Competitive Analysis

            • 14.1 Companies profiled
              • Companies covered
            • 14.2 Market positioning of companies
              • Matrix on companies position and classification
            • 14.3 Panasonic
              • Panasonic - Overview
              • Panasonic - Product / Service
              • Panasonic - Key offerings
            • 14.4 Getac
              • Getac - Overview
              • Getac - Product / Service
              • Getac - Key offerings
            • 14.5 Zebra Technologies
              • Zebra Technologies - Overview
              • Zebra Technologies - Product / Service
              • Zebra Technologies - Key offerings
            • 14.6 DT Research
              • DT Research - Overview
              • DT Research - Product / Service
              • DT Research - Key offerings
            • 14.7 Xplore Technologies
              • Xplore Technologies - Overview
              • Xplore Technologies - Product / Service
              • Xplore Technologies - Key offerings
            • 14.8 Dell
              • Dell - Overview
              • Dell - Product / Service
              • Dell - Key offerings
            • 14.9 HP
              • HP - Overview
              • HP - Product / Service
              • HP - Key offerings
            • 14.10 Lenovo
              • Lenovo - Overview
              • Lenovo - Product / Service
              • Lenovo - Key offerings
            • 14.11 Samsung
              • Samsung - Overview
              • Samsung - Product / Service
              • Samsung - Key offerings
            • 14.12 Apple
              • Apple - Overview
              • Apple - Product / Service
              • Apple - Key offerings
            • 14.13 Microsoft
              • Microsoft - Overview
              • Microsoft - Product / Service
              • Microsoft - Key offerings
            • 14.14 Trimble
              • Trimble - Overview
              • Trimble - Product / Service
              • Trimble - Key offerings
            • 14.15 MobileDemand
              • MobileDemand - Overview
              • MobileDemand - Product / Service
              • MobileDemand - Key offerings
            • 14.16 AAEON
              • AAEON - Overview
              • AAEON - Product / Service
              • AAEON - Key offerings
            • 14.17 Advantech
              • Advantech - Overview
              • Advantech - Product / Service
              • Advantech - Key offerings
            • 14.18 Kontron
              • Kontron - Overview
              • Kontron - Product / Service
              • Kontron - Key offerings
            • 14.19 MilDef
              • MilDef - Overview
              • MilDef - Product / Service
              • MilDef - Key offerings
            • 14.20 Winmate
              • Winmate - Overview
              • Winmate - Product / Service
              • Winmate - Key offerings
            • 14.21 RuggON
              • RuggON - Overview
              • RuggON - Product / Service
              • RuggON - Key offerings
            • 14.22 Logic Instrument
              • Logic Instrument - Overview
              • Logic Instrument - Product / Service
              • Logic Instrument - Key offerings
            • 14.23 ASUSTeK Computer Inc.
              • ASUSTeK Computer Inc. - Overview
              • ASUSTeK Computer Inc. - Product / Service
              • ASUSTeK Computer Inc. - Key offerings
            • 14.24 Dell Technologies Inc.
              • Dell Technologies Inc. - Overview
              • Dell Technologies Inc. - Product / Service
              • Dell Technologies Inc. - Key offerings
            • 14.25 DT Research Inc.
              • DT Research Inc. - Overview
              • DT Research Inc. - Product / Service
              • DT Research Inc. - Key offerings
            • 14.26 Emdoor information Co. Ltd.
              • Emdoor information Co. Ltd. - Overview
              • Emdoor information Co. Ltd. - Product / Service
              • Emdoor information Co. Ltd. - Key offerings
            • 14.27 Getac Technology Corp.
              • Getac Technology Corp. - Overview
              • Getac Technology Corp. - Product / Service
              • Getac Technology Corp. - Key offerings
            • 14.28 Honeywell International Inc.
              • Honeywell International Inc. - Overview
              • Honeywell International Inc. - Product / Service
              • Honeywell International Inc. - Key offerings
            • 14.29 HP Inc.
              • HP Inc. - Overview
              • HP Inc. - Product / Service
              • HP Inc. - Key offerings
            • 14.30 Kontron AG
              • Kontron AG - Overview
              • Kontron AG - Product / Service
              • Kontron AG - Key offerings
            • 14.31 Leonardo S.p.A.
              • Leonardo S.p.A. - Overview
              • Leonardo S.p.A. - Product / Service
              • Leonardo S.p.A. - Key offerings
            • 14.32 Micro Star International Co. Ltd.
              • Micro Star International Co. Ltd. - Overview
              • Micro Star International Co. Ltd. - Product / Service
              • Micro Star International Co. Ltd. - Key offerings
            • 14.33 MilDef Group AB
              • MilDef Group AB - Overview
              • MilDef Group AB - Product / Service
              • MilDef Group AB - Key offerings
            • 14.34 MobileDemand Corp.
              • MobileDemand Corp. - Overview
              • MobileDemand Corp. - Product / Service
              • MobileDemand Corp. - Key offerings
            • 14.35 NEXCOM International Co. Ltd.
              • NEXCOM International Co. Ltd. - Overview
              • NEXCOM International Co. Ltd. - Product / Service
              • NEXCOM International Co. Ltd. - Key offerings
            • 14.36 Panasonic Holdings Corp.
              • Panasonic Holdings Corp. - Overview
              • Panasonic Holdings Corp. - Product / Service
              • Panasonic Holdings Corp. - Key offerings
            • 14.37 Samsung Electronics Co. Ltd.
              • Samsung Electronics Co. Ltd. - Overview
              • Samsung Electronics Co. Ltd. - Product / Service
              • Samsung Electronics Co. Ltd. - Key offerings
            • 14.38 STMicroelectronics International N.V.
              • STMicroelectronics International N.V. - Overview
              • STMicroelectronics International N.V. - Product / Service
              • STMicroelectronics International N.V. - Key offerings
            • 14.39 Trimble Inc.
              • Trimble Inc. - Overview
              • Trimble Inc. - Product / Service
              • Trimble Inc. - Key offerings
            • 14.40 Twinhead International Corp.
              • Twinhead International Corp. - Overview
              • Twinhead International Corp. - Product / Service
              • Twinhead International Corp. - Key offerings
            • 14.41 Unitech Computer Co. Ltd.
              • Unitech Computer Co. Ltd. - Overview
              • Unitech Computer Co. Ltd. - Product / Service
              • Unitech Computer Co. Ltd. - Key offerings
            • 14.42 Zebra Technologies Corp.
              • Zebra Technologies Corp. - Overview
              • Zebra Technologies Corp. - Product / Service
              • Zebra Technologies Corp. - Key offerings
            • 14.43 JLT Mobile Computers AB
              • JLT Mobile Computers AB - Overview
              • JLT Mobile Computers AB - Product / Service
              • JLT Mobile Computers AB - Key offerings

            13 Appendix

            • 13.1 Scope of the report
              • 13.2 Inclusions and exclusions checklist
                • Exhibit 181: Inclusions checklist
                • Exhibit 182: Exclusions checklist
              • 13.3 Currency conversion rates for US$
                • Exhibit 183: Currency conversion rates for US$
              • 13.4 Research methodology
                • Exhibit 184: Research methodology
                • Exhibit 185: Validation techniques employed for market sizing
                • Exhibit 186: Information sources
              • 13.5 List of abbreviations
                • Exhibit 187: List of abbreviations

              Research Methodology

              Technavio presents a detailed picture of the market by way of study, synthesis, and summation of data from multiple sources. The analysts have presented the various facets of the market with a particular focus on identifying the key industry influencers. The data thus presented is comprehensive, reliable, and the result of extensive research, both primary and secondary.

              INFORMATION SOURCES

              Primary sources

              • Manufacturers and suppliers
              • Channel partners
              • Industry experts
              • Strategic decision makers

              Secondary sources

              • Industry journals and periodicals
              • Government data
              • Financial reports of key industry players
              • Historical data
              • Press releases

              DATA ANALYSIS

              Data Synthesis

              • Collation of data
              • Estimation of key figures
              • Analysis of derived insights

              Data Validation

              • Triangulation with data models
              • Reference against proprietary databases
              • Corroboration with industry experts

              REPORT WRITING

              Qualitative

              • Market drivers
              • Market challenges
              • Market trends
              • Five forces analysis

              Quantitative

              • Market size and forecast
              • Market segmentation
              • Geographical insights
              • Competitive landscape

              Interested in this report?

              Get your sample now to see our research methodology and insights!

              Download Now

              Frequently Asked Questions

              Rugged Tablet market growth will increase by $ 208.84 mn during 2024-2028 .

              The Rugged Tablet market is expected to grow at a CAGR of 4.69% during 2024-2028 .

              Rugged Tablet market is segmented by OS( Android, IOS, Windows, Middle East and Africa) Technology( Semi-rugged, Fully-rugged, Ultra-rugged tablets, South America, Middle East and Africa)

              Panasonic, Getac, Zebra Technologies, DT Research, Xplore Technologies, Dell, HP, Lenovo, Samsung, Apple, Microsoft, Trimble, MobileDemand, AAEON, Advantech, Kontron, MilDef, Winmate, RuggON, Logic Instrument are a few of the key vendors in the Rugged Tablet market.

              North America will register the highest growth rate of 33% among the other regions. Therefore, the Rugged Tablet market in North America is expected to garner significant business opportunities for the vendors during the forecast period.

              US, China, Germany, Japan, UK, Australia, India, France, Brazil, UAE, Rest of World (ROW), Saudi Arabia, France, South Korea, Mexico, Italy, Spain

              • Increasing demand from defense sectorThe maximization of productivity has been the most important priority in the defense sector. Military information infrastructures comprise secure wireless and cellular broadband technologies is the driving factor this market.
              • and by using these services within a secure network is the driving factor this market.
              • military personnel can effortlessly relay critical information and minimize manual data distribution within the command. The defense sector is rapidly evolving and adopting mobility solutions. Rugged tablets form a critical part of providing mobility of information flow via a secure connection. Military personnel can easily access information on a real-time basis using a rugged tablet over a secure network. The real-time transmission and review of data that mobile tablets enable are widely attributed to the emergence of secure networks in both wireless LAN and cellular broadband. With improvements to the protocols essential for securing communication is the driving factor this market.
              • Wi-Fi has become highly valued by the military and public sectors. IT managers can fortify wireless networks with various encryption tools that help in protecting networks at the application or data layer. Some of the salient features of rugged tablets used in the defense sector are as follows: Flexibility: New-age rugged tablets come equipped with detachable keyboards. This permits defense personnel to use a single device for multiple tasks. Real-time data distribution: The real-time information exchange reduces the time of action and refines the overall operational efficiency. Extreme environments working: As the armed forces operate in a harsh environment is the driving factor this market.
              • military organizations use rugged tablets is the driving factor this market.
              • which are much more reliable than consumer-grade tablets. These tablets are manufactured to endure physical damage such as drops and vibrations. Thus is the driving factor this market.
              • the increase in demand from the defense sector boosts the growth of the global rugged tablet market during the forecast period. is the driving factor this market.

              The Rugged Tablet market vendors should focus on grabbing business opportunities from the Android segment as it accounted for the largest market share in the base year.