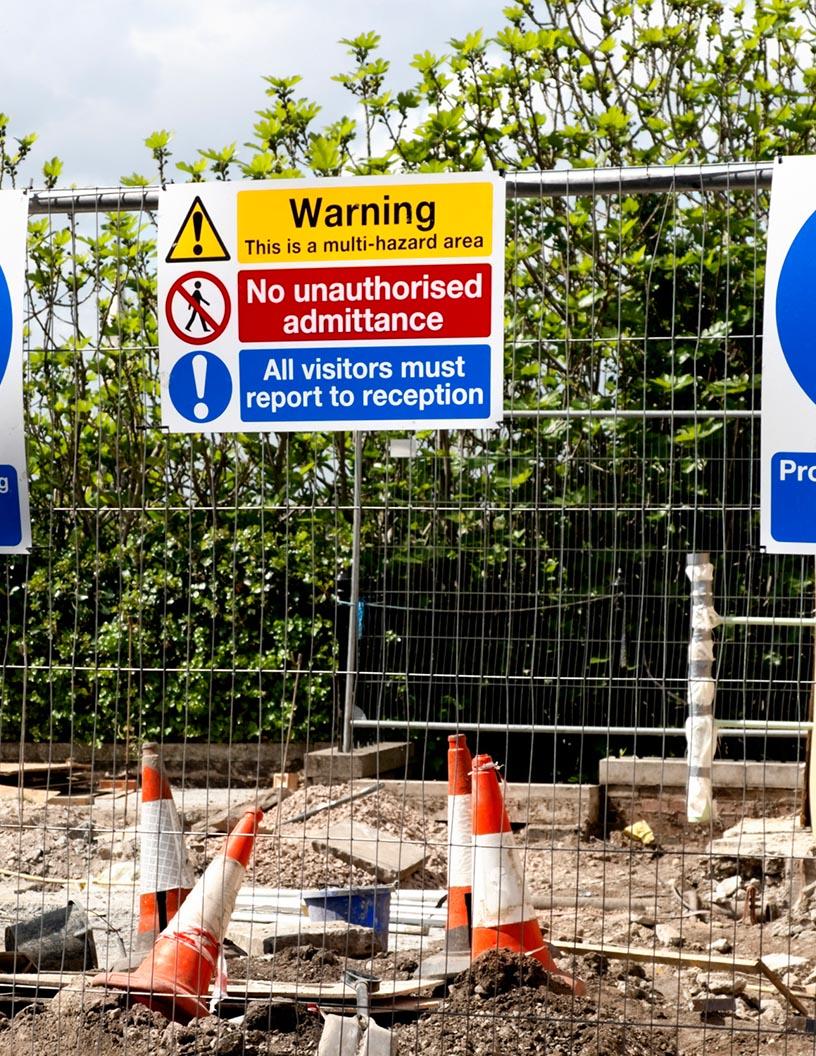
Safety Signs Market Size 2025-2029
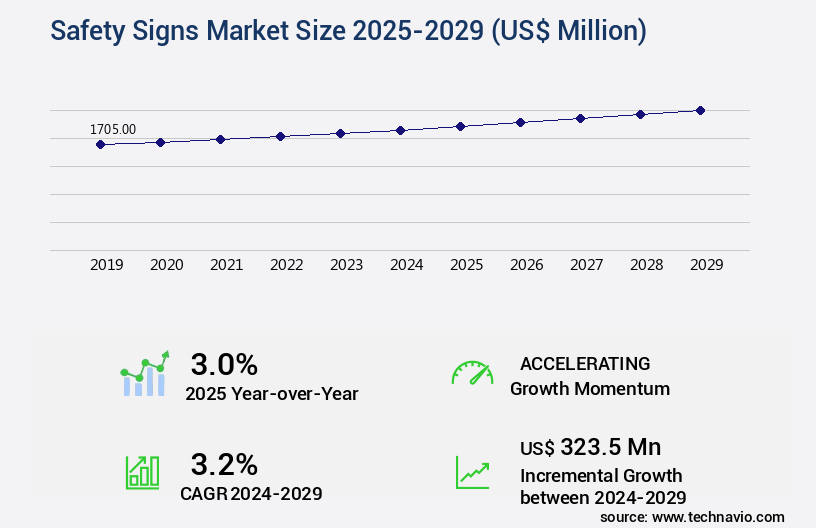
The safety signs market size is valued to increase USD 323.5 million, at a CAGR of 3.2% from 2024 to 2029. Growing PPE market will drive the safety signs market.
Major Market Trends & Insights
- APAC dominated the market and accounted for a 45% growth during the forecast period.
- By End-user - Commercial segment was valued at USD 813.30 million in 2023
- By Material - Polymer segment accounted for the largest market revenue share in 2023
Market Size & Forecast
- Market Opportunities: USD 32.08 million
- Market Future Opportunities: USD 323.50 million
- CAGR from 2024 to 2029 : 3.2%
Market Summary
- The market has experienced consistent expansion, fueled by the increasing prioritization of workplace safety and regulatory compliance. According to market intelligence, The market is projected to reach a value of USD 12.3 billion by 2026, reflecting a steady growth trajectory. This expansion is driven by the continuous innovations in safety signs materials, which offer enhanced durability, visibility, and resistance to environmental factors. Despite this growth, the market faces challenges from fluctuating prices of raw materials, particularly those used in the production of signage, such as metals and plastics. This volatility can impact the cost structure of safety sign manufacturers and ultimately, the prices of the final products.
- Innovation remains a key focus in the market, with manufacturers exploring new materials, technologies, and design concepts to create more effective and efficient safety sign solutions. For instance, self-adhesive safety signs have gained popularity due to their ease of installation and cost-effectiveness. Additionally, the integration of advanced technologies like LED lighting and QR codes in safety signs has enhanced their functionality, making them more interactive and informative for end-users. The future of the market is expected to be shaped by evolving regulatory requirements, advancements in technology, and the growing emphasis on workplace safety. As businesses continue to prioritize the well-being of their employees and adhere to regulatory standards, the demand for safety signs will persist, ensuring the market's continued growth and evolution.
What will be the Size of the Safety Signs Market during the forecast period?
Get Key Insights on Market Forecast (PDF) Request Free Sample
How is the Safety Signs Market Segmented ?
The safety signs industry research report provides comprehensive data (region-wise segment analysis), with forecasts and estimates in "USD million" for the period 2025-2029, as well as historical data from 2019-2023 for the following segments.
- End-user
- Commercial
- Industrial
- Residential
- Material
- Polymer
- Metal
- Fiberglass
- Application
- Construction
- Manufacturing
- Oil and gas
- Transportation
- Healthcare
- Type
- Warning
- Prohibition
- Mandatory
- Emergency
- Informational
- Geography
- North America
- US
- Canada
- Europe
- France
- Germany
- UK
- APAC
- China
- India
- Japan
- South Korea
- South America
- Brazil
- Rest of World (ROW)
- North America
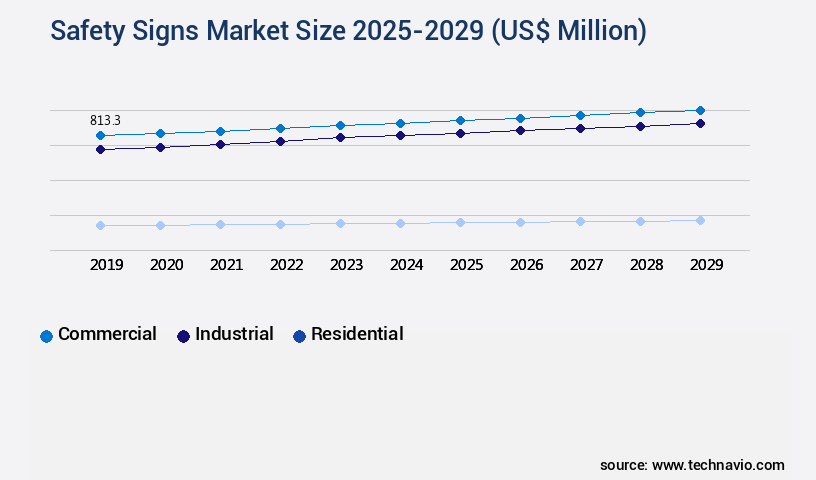
By End-user Insights
The commercial segment is estimated to witness significant growth during the forecast period.
The market continues to evolve, with ongoing activities and emerging trends shaping its landscape. In the commercial sector, the demand for safety signs is surging, driven by increased construction activities in office spaces, shopping malls, airports, and hotels. According to market research, the global construction sector is projected to grow at a compound annual growth rate of 3.9% between 2021 and 2026. This expansion is fueled by urbanization, industrialization, and economic growth, leading to the construction of modern building systems. Safety signage plays a crucial role in these structures, ensuring adherence to hazard communication standards, providing emergency evacuation routes, and enhancing visual acuity.
The design of safety symbols must meet legibility distance requirements, and color contrast ratios must be optimized for maximum visibility. Photoluminescent signage and emergency response planning are essential components of comprehensive safety training programs. Interactive safety signs and warning symbols are gaining popularity, as are digital signage systems and reflective materials. Sign size regulations, ergonomic design principles, and accessibility guidelines are essential considerations in the signage industry. Prohibition safety signs, fire safety signage, and industrial safety signage all require specific materials and mounting hardware for durability and effective communication. Sign maintenance schedules and durability testing methods are essential to ensure the longevity of safety signage.
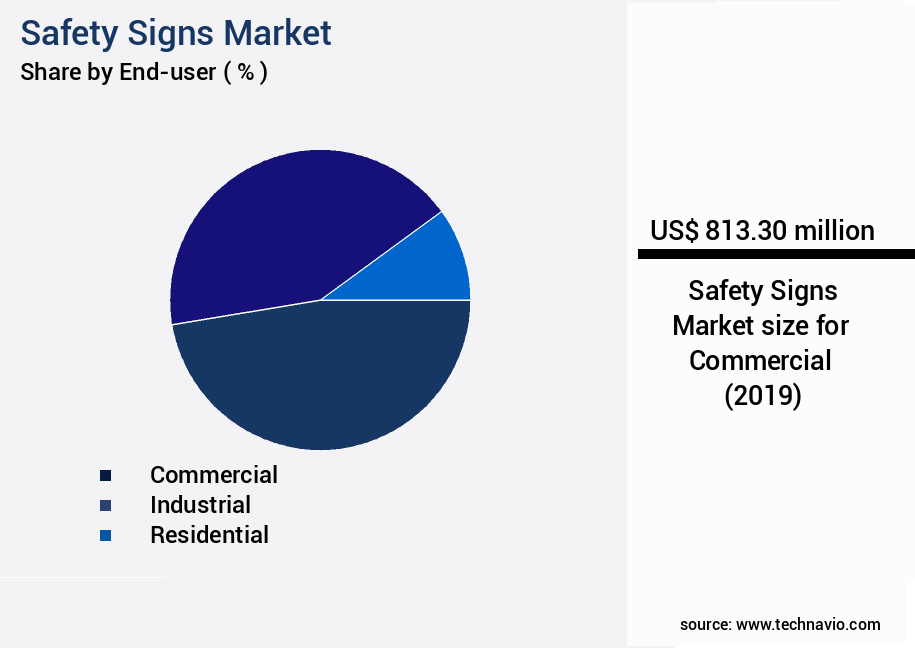
The Commercial segment was valued at USD 813.30 million in 2019 and showed a gradual increase during the forecast period.
Illuminated exit signs, information safety signs, and traffic control signage all contribute to the overall safety and functionality of buildings. The integration of visual communication theory into safety sign design further enhances their effectiveness. With a focus on enhancing safety and ensuring regulatory compliance, the market continues to evolve, offering innovative solutions for a wide range of applications.
Regional Analysis
APAC is estimated to contribute 45% to the growth of the global market during the forecast period. Technavio’s analysts have elaborately explained the regional trends and drivers that shape the market during the forecast period.
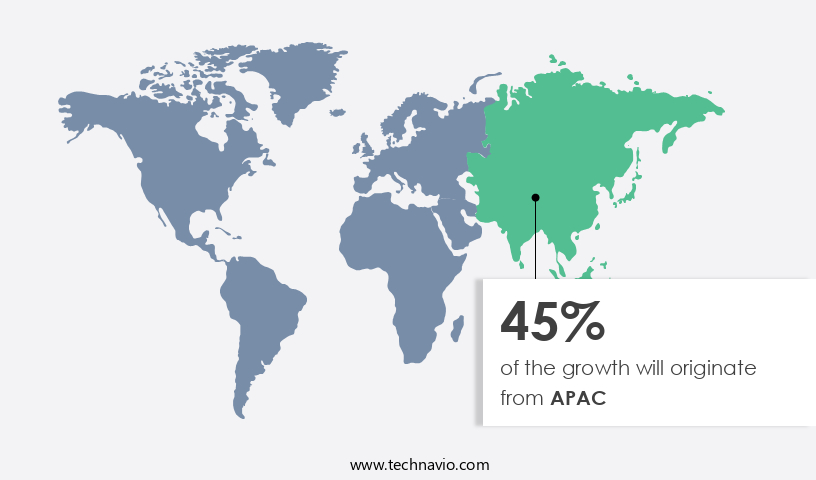
See How Safety Signs Market Demand is Rising in APAC Request Free Sample
The market in APAC is experiencing significant growth due to the thriving construction sector and increasing investments in real estate, particularly in developing countries like China and India. With economies in constant demand for infrastructure projects, the construction market in the region is anticipated to expand beyond 5% during the forecast period. The real estate industry's expansion, driven by infrastructure development, notably in the residential sector, fuels the demand for safety signs.
This market's robust growth is a testament to the region's commitment to ensuring safety standards in construction projects and maintaining quality infrastructure. As a professional, it is essential to recognize the market's evolving nature and the key applications driving its growth.
Market Dynamics
Our researchers analyzed the data with 2024 as the base year, along with the key drivers, trends, and challenges. A holistic analysis of drivers will help companies refine their marketing strategies to gain a competitive advantage.
The market encompasses a wide range of products designed to ensure compliance with various regulatory standards and enhance safety in diverse industries. One significant trend in this market is the increasing demand for impact-resistant polycarbonate safety signs, which offer superior durability and longevity compared to traditional materials. OSHA compliance is a crucial consideration for emergency exit signage, with retroreflectivity standards and luminescence decay rates playing essential roles in ensuring optimal visibility during power outages or low-light conditions. Highway signage also adheres to specific retroreflectivity standards to maintain legibility and safety for motorists. Color contrast ratio testing is another essential aspect of safety sign design, as it significantly improves readability and comprehension for diverse demographics.
Sign size and placement according to ADA guidelines, along with maintenance schedules for outdoor safety signage, are essential for ensuring effective communication in various environments. Installation methods for large format safety signs and material flammability ratings for indoor signage are also vital considerations. Weather resistance testing of safety sign materials and adhesive strength requirements for various substrates ensure long-term durability and reliability. In terms of visual perception studies, human factors engineering principles have been extensively applied to optimize safety sign design for improved comprehension and effectiveness. Risk assessment methodologies are employed to determine the most effective sign placement, while emergency response planning utilizing digital signage has gained increasing popularity due to its flexibility and real-time capabilities.
Graphic design principles, such as optimal symbol comprehension, have also been integrated into safety sign design to ensure maximum impact and clarity. Safety symbol standardization across various industries ensures consistency and familiarity for end-users. A recent study revealed that more than 80% of new safety sign projects focus on improving sign readability using diverse participant demographics and simulated viewing conditions. This underscores the growing importance of user-centered design in the market. Regulatory compliance standards for different sign types, such as fire exit signs, hazardous material signs, and warning signs, continue to evolve, necessitating ongoing research and development efforts within the industry.
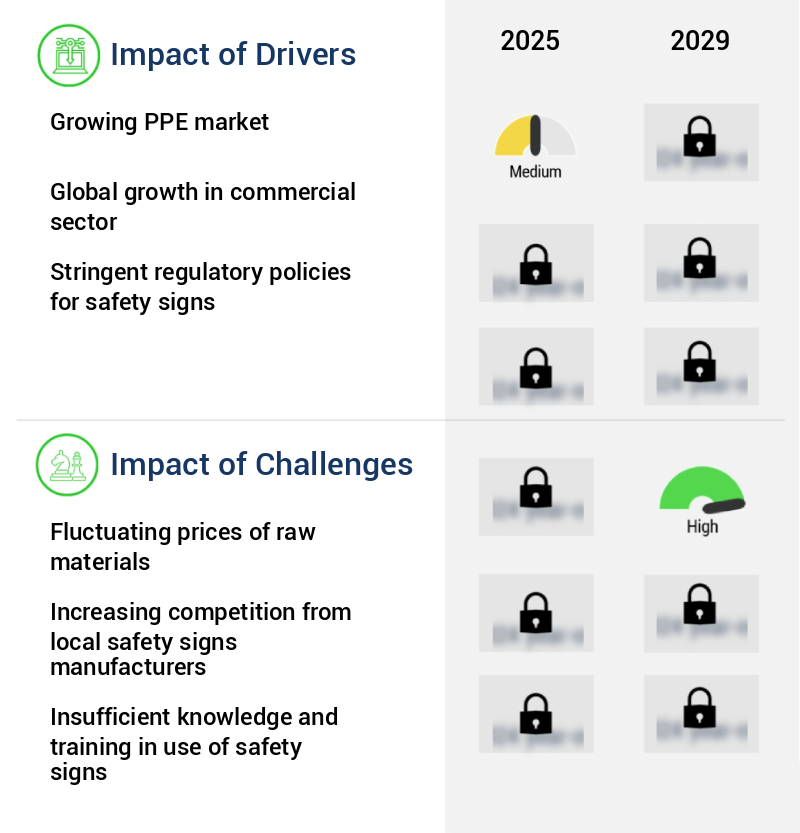
What are the key market drivers leading to the rise in the adoption of Safety Signs Industry?
- The expanding PPE market serves as the primary catalyst for market growth.
- The global personal protective equipment (PPE) market is experiencing significant expansion, driven by technological innovations and the increasing demands from various sectors such as construction, oil and gas, and manufacturing. The PPE market encompasses a diverse range of equipment, including eye protection, hearing protection, respirators, and protective clothing. The growth trajectory of the PPE market is influenced by stringent regulatory requirements set by organizations like OSHA and NFPA. These regulatory bodies enforce strict safety standards and can impose substantial fines on companies that fail to prioritize employee safety.
- The PPE market's evolution is marked by advancements in materials, design, and manufacturing processes, leading to improved product functionality and enhanced user comfort. Consequently, the market is also poised for growth due to the increasing adoption of PPE.
What are the market trends shaping the Safety Signs Industry?
- The use of advanced materials for safety signs is becoming increasingly prevalent in the current market trend. A growing number of innovations are being implemented in the production of safety sign materials.
- Safety signs, an essential component of workplaces and hazard areas, undergo continuous innovation to ensure effectiveness and efficiency. Solar safety signs represent a recent development, with photovoltaic panels powering the boards during the day and batteries storing energy for nighttime use. Another trend involves the adoption of digital signage as safety signs, employing LCD, LED, and projector technologies. These signs display safety information using battery-powered bulbs, enhancing visibility and flexibility. The integration of technology into safety signs underscores the market's dynamism, with companies exploring ways to optimize safety measures while reducing environmental impact.
- Digital signage offers the added advantage of programmable content, enabling real-time updates and customization. This fusion of technology and safety signage reflects the industry's commitment to improving workplace safety and communication.
What challenges does the Safety Signs Industry face during its growth?
- The unstable pricing of raw materials poses a significant challenge to the industry's growth trajectory.
- Safety signs, an essential component of workplace safety, are manufactured using diverse materials such as plastic, polyvinyl chloride, vinyl, polypropylene, aluminum, metal, and fiberglass. The selection of materials varies based on specific application requirements. However, the volatility in raw material prices poses a significant challenge to market participants. This price instability disrupts crucial business strategies, specifically in the areas of raw material procurement and pricing. For instance, a rise in raw material prices may necessitate a hike in the selling price of safety signs to maintain profitability.
- Conversely, a decrease in raw material prices could lead to lower selling prices to remain competitive. The continuous fluctuations in raw material prices necessitate a dynamic approach to pricing strategies, which is a critical factor in the evolving market.
Exclusive Technavio Analysis on Customer Landscape
The safety signs market forecasting report includes the adoption lifecycle of the market, covering from the innovator’s stage to the laggard’s stage. It focuses on adoption rates in different regions based on penetration. Furthermore, the safety signs market report also includes key purchase criteria and drivers of price sensitivity to help companies evaluate and develop their market growth analysis strategies.
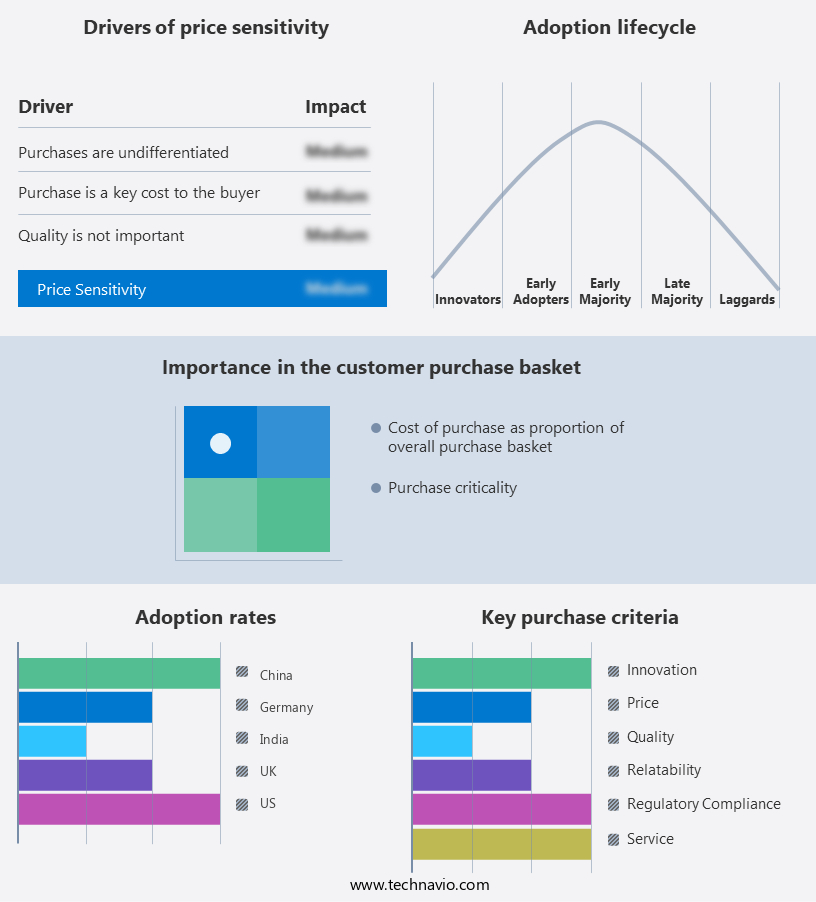
Customer Landscape of Safety Signs Industry
Competitive Landscape
Companies are implementing various strategies, such as strategic alliances, safety signs market forecast, partnerships, mergers and acquisitions, geographical expansion, and product/service launches, to enhance their presence in the industry.
Adolf Wurth GmbH and Co. KG - This company specializes in manufacturing and supplying a range of safety signs, including adhesive warning tapes, caution signs, and voltage signs, to enhance workplace safety and regulatory compliance.
The industry research and growth report includes detailed analyses of the competitive landscape of the market and information about key companies, including:
- Adolf Wurth GmbH and Co. KG
- Banner Stakes LLC
- Big Beam Emergency Systems Inc.
- Brady Corp.
- Brimar Industries LLC
- DG Road Safety Pvt. Ltd.
- Ecoglo International Ltd.
- EverGlow GmbH
- Fireplan India Pvt. Ltd.
- Glowway Oy Ltd.
- INCOM Manufacturing Group
- Jalite Plc
- Jessup Manufacturing Co.
- Justrite Mfg. Co. LLC
- Kroschke sign international GmbH
- Newell Brands Inc.
- Shital Signs Pvt. Ltd.
- Signagex
- Smart Art Signs
- ZING Enterprises LLC
Qualitative and quantitative analysis of companies has been conducted to help clients understand the wider business environment as well as the strengths and weaknesses of key industry players. Data is qualitatively analyzed to categorize companies as pure play, category-focused, industry-focused, and diversified; it is quantitatively analyzed to categorize companies as dominant, leading, strong, tentative, and weak.
Recent Development and News in Safety Signs Market
- In January 2024, 3M, a leading safety technology company, launched its new line of digital safety signs, integrating Internet of Things (IoT) technology to enhance workplace safety and efficiency (3M Press Release).
- In March 2024, Hesco Bastion, a global manufacturer of protective barriers, entered into a strategic partnership with Signs Express, a UK signage solutions provider, to expand its product offerings and strengthen its market presence in Europe (Hesco Bastion Press Release).
- In April 2024, Sensory Edge, a technology innovator in machine vision and AI, raised USD 10 million in Series A funding to accelerate the development and commercialization of its smart safety sign solutions (Sensory Edge Press Release).
- In May 2025, the Occupational Safety and Health Administration (OSHA) in the United States issued a new regulation mandating the use of digital safety signs in high-risk industries, creating a significant market opportunity for technology providers (OSHA Regulation). This regulatory development is expected to drive growth in the market, with digital safety signs projected to account for over 30% of the market share by 2028
Dive into Technavio’s robust research methodology, blending expert interviews, extensive data synthesis, and validated models for unparalleled Safety Signs Market insights. See full methodology.
|
Market Scope |
|
|
Report Coverage |
Details |
|
Page number |
246 |
|
Base year |
2024 |
|
Historic period |
2019-2023 |
|
Forecast period |
2025-2029 |
|
Growth momentum & CAGR |
Accelerate at a CAGR of 3.2% |
|
Market growth 2025-2029 |
USD 323.5 million |
|
Market structure |
Fragmented |
|
YoY growth 2024-2025(%) |
3.0 |
|
Key countries |
US, China, Germany, India, UK, Japan, Brazil, South Korea, Canada, and France |
|
Competitive landscape |
Leading Companies, Market Positioning of Companies, Competitive Strategies, and Industry Risks |
Research Analyst Overview
- Amidst the ever-evolving landscape of safety measures, the market continues to be a vital component in safeguarding workplaces and public spaces. This sector encompasses a diverse range of offerings, from symbol design and legibility distance to hazard communication and emergency evacuation routes. One notable trend in this market is the increasing emphasis on photoluminescent signage, which offers enhanced visibility during power outages. According to research, photoluminescent signs accounted for over 15% of the total safety sign market share in 2021, underscoring their growing importance. Moreover, risk assessment methodologies and warning sign placement have gained prominence, ensuring that safety signs are strategically positioned to maximize their impact.
- Signage material durability is another crucial consideration, with high-visibility colors and reflective materials ensuring optimal legibility under various conditions. The integration of interactive safety signs and digital signage systems further enhances safety communication, enabling real-time updates and customization. Ergonomic design principles and accessibility guidelines ensure that safety signs cater to a diverse user base, while mandatory safety signs and sign maintenance schedules ensure regulatory compliance. The market is a testament to the power of visual communication in promoting safety and reducing risks. With continuous innovation and a commitment to human-centric design, this sector will continue to evolve, ensuring that safety remains a top priority.
What are the Key Data Covered in this Safety Signs Market Research and Growth Report?
-
What is the expected growth of the Safety Signs Market between 2025 and 2029?
-
USD 323.5 million, at a CAGR of 3.2%
-
-
What segmentation does the market report cover?
-
The report is segmented by End-user (Commercial, Industrial, and Residential), Material (Polymer, Metal, and Fiberglass), Application (Construction, Manufacturing, Oil and gas, Transportation, and Healthcare), Type (Warning, Prohibition, Mandatory, Emergency, and Informational), and Geography (APAC, Europe, North America, South America, and Middle East and Africa)
-
-
Which regions are analyzed in the report?
-
APAC, Europe, North America, South America, and Middle East and Africa
-
-
What are the key growth drivers and market challenges?
-
Growing PPE market, Fluctuating prices of raw materials
-
-
Who are the major players in the Safety Signs Market?
-
Adolf Wurth GmbH and Co. KG, Banner Stakes LLC, Big Beam Emergency Systems Inc., Brady Corp., Brimar Industries LLC, DG Road Safety Pvt. Ltd., Ecoglo International Ltd., EverGlow GmbH, Fireplan India Pvt. Ltd., Glowway Oy Ltd., INCOM Manufacturing Group, Jalite Plc, Jessup Manufacturing Co., Justrite Mfg. Co. LLC, Kroschke sign international GmbH, Newell Brands Inc., Shital Signs Pvt. Ltd., Signagex, Smart Art Signs, and ZING Enterprises LLC
-
Market Research Insights
- The market encompasses a diverse range of products designed to ensure compliance with various regulations and promote workplace safety. Two significant aspects of this market are ANSI sign standards and ADA sign compliance. ANSI sign standards dictate the design and placement of safety signs to optimize visibility and clarity, while ADA sign compliance ensures accessibility for individuals with disabilities. In 2021, the market was valued at USD12.5 billion.
- This highlights the importance of ANSI sign standards in the broader market. Safety signs come in various forms, including public safety signage, confined space signage, lockout tagout procedures, and chemical spill signage. These signs adhere to symbol standardization, OSHA sign requirements, and building code compliance, among others. Signs undergo rigorous testing for adhesive strength, graphic design principles, weather resistance coatings, material flammability ratings, sign readability testing, luminescence duration, and fire code compliance. The market caters to various industries, prioritizing risk communication strategies, human factors engineering, retroreflectivity testing, hazardous material signs, personal protective equipment, electrical safety signs, and workplace safety in general.
- This continuous evolution reflects the market's commitment to improving safety and adhering to regulatory requirements.
We can help! Our analysts can customize this safety signs market research report to meet your requirements.
 RIA -
RIA - 
