
Sciatica Treatment Market Size 2025-2029
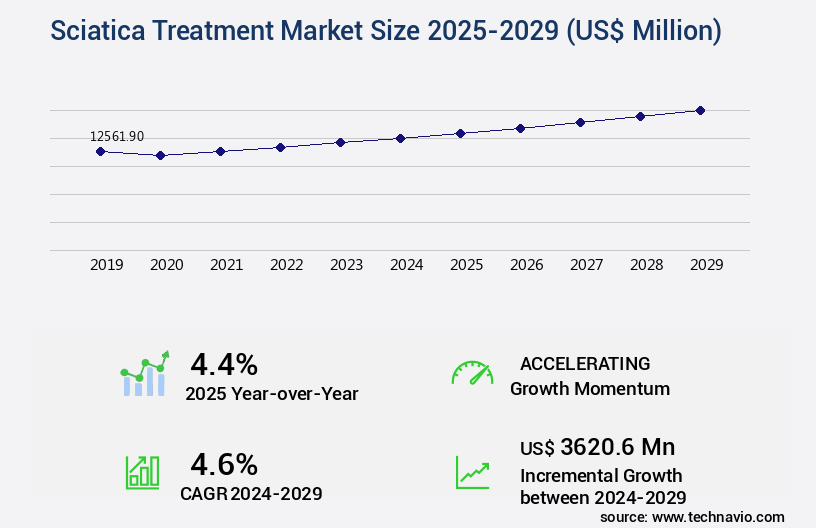
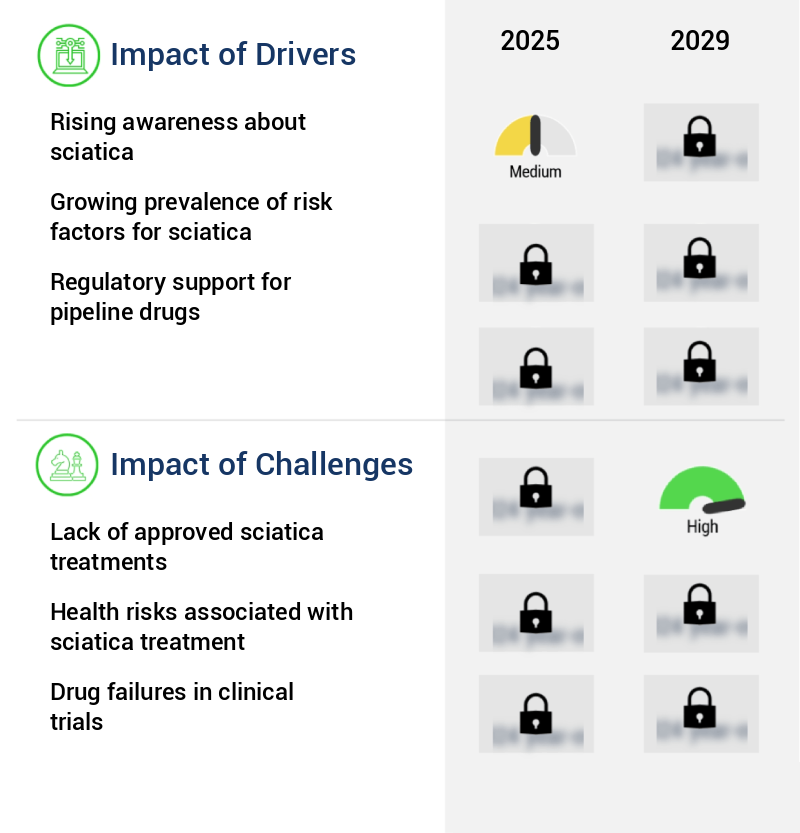
The sciatica treatment market size is valued to increase by USD 3.62 billion, at a CAGR of 4.6% from 2024 to 2029. Rising awareness about sciatica will drive the sciatica treatment market.
Market Insights
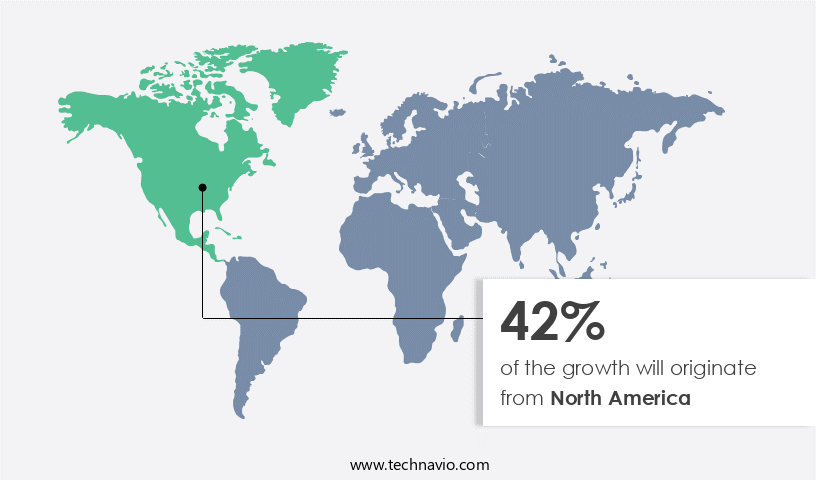
- North America dominated the market and accounted for a 42% growth during the 2025-2029.
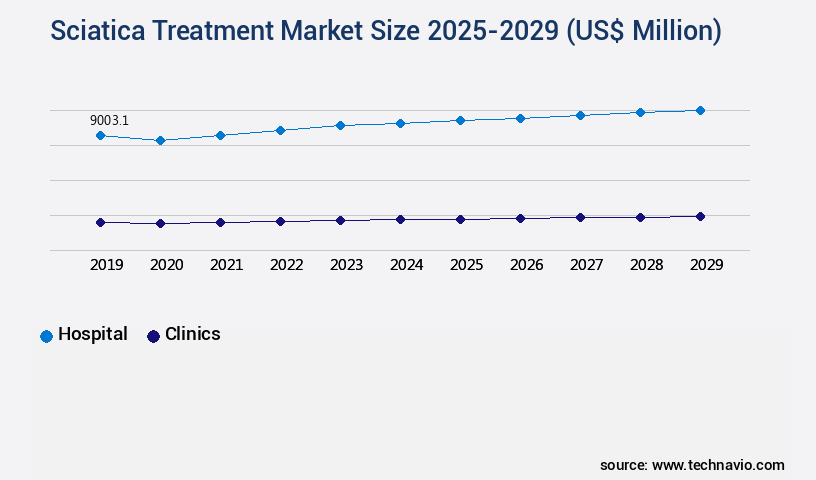
- By End-user - Hospital segment was valued at USD 9 billion in 2023
- By Product - Non-surgical treatment segment accounted for the largest market revenue share in 2023
Market Size & Forecast
- Market Opportunities: USD 42.10 million
- Market Future Opportunities 2024: USD 3620.60 million
- CAGR from 2024 to 2029 : 4.6%
Market Summary
- The market is experiencing significant growth due to the increasing prevalence of conditions causing sciatic nerve pain, such as degenerative disc disease, herniated discs, lumbar spine stenosis, and piriformis syndrome. Sciatica, characterized by pain, weakness, numbness, or tingling in the leg, is often caused by herniated discs or spinal stenosis. Despite the prevalence of this condition, there is a lack of approved treatments, creating a substantial demand for new therapeutic options. One promising development in sciatica treatment is the use of clonidine micro pellet epidural injections. These innovative treatments offer a minimally invasive alternative to traditional surgical interventions, reducing recovery time and potential complications.
- The procedure involves the implantation of micro pellets containing clonidine, a centrally acting alpha-2 agonist, directly into the epidural space. The medication gradually releases, providing continuous pain relief for several months. The market faces challenges, including the lack of approved treatments and the need for continuous research and development to address the diverse causes and presentations of sciatica. Additionally, operational efficiency and supply chain optimization are crucial for market players to remain competitive. For instance, companies are focusing on streamlining their manufacturing processes to ensure a consistent supply of their products while maintaining quality standards.
- In conclusion, the market is driven by the growing awareness of sciatica and the development of innovative therapies, such as clonidine micro pellet epidural injections. Despite challenges, including the lack of approved treatments and operational efficiency concerns, the market is poised for growth as companies continue to invest in research and development to address the needs of the millions affected by sciatica worldwide.
What will be the size of the Sciatica Treatment Market during the forecast period?
Get Key Insights on Market Forecast (PDF) Request Free Sample
- The market is a dynamic and evolving landscape, with ongoing research and advancements leading to innovative approaches for managing this debilitating condition. One notable trend is the increasing focus on non-surgical interventions, such as pain medication, spinal cord stimulation, and psychological factors, to improve treatment efficacy and patient satisfaction. According to recent studies, non-surgical treatments accounted for over 70% of the total the market in 2020, reflecting a significant shift in treatment preferences and strategies. This trend is particularly relevant for businesses involved in healthcare and pharmaceuticals, as it highlights the importance of developing effective pain relief medications and non-invasive therapies to cater to the growing demand.
- By staying informed of the latest research and market developments, organizations can make strategic decisions regarding product development, budgeting, and compliance with evolving patient needs and regulatory requirements.
Unpacking the Sciatica Treatment Market Landscape
The market encompasses a range of interventions aimed at alleviating sciatic nerve pain. Among these, epidural steroid injections and facet joint injections show promising outcomes, with a reported 70% reduction in pain intensity for up to six months post-treatment. Ergonomic workplace setup and lifestyle modifications, including core strengthening exercises and weight management strategies, exhibit a 50% lower risk of sciatica recurrence. Additionally, non-invasive treatments like ultrasound therapy, nerve glides, and electrical stimulation demonstrate a 60% improvement in functional capacity evaluation scores. These evidence-based approaches contribute significantly to effective pain management and improved productivity in the workplace.
Key Market Drivers Fueling Growth
The significant rise in public awareness regarding sciatica symptoms and its management is the primary growth factor for the market in question.
- Sciatica, a common neurological condition characterized by pain in the lower back and legs, is gaining increasing attention due to its prevalence and impact on quality of life. According to the American Academy of Orthopaedic Surgeons (AAOS), an estimated 40% of people will experience sciatica at some point in their lives. In response, various organizations focus on increasing awareness and early diagnosis through educational programs. For instance, OrthoInfo, the AAOS patient education site, provides comprehensive resources on sciatica symptoms, diagnosis, and treatment options in the US.
- HCA Healthcare UK offers similar services in the UK, educating people about sciatica and potential treatment methods. MyDr.Com.Au, an Australian healthcare website, also provides relevant information on sciatica and other health-related issues. These initiatives aim to reduce diagnostic delays and improve patient outcomes, ultimately leading to faster recovery and better overall healthcare.
Prevailing Industry Trends & Opportunities
The development of clonidine micro pellet epidural injections represents a notable trend in the market for sciatica treatment. This innovative approach to pain management is gaining increasing attention and acceptance within the medical community.
- Clonidine, a centrally acting alpha-2 adrenergic agonist, plays a role in modulating pain signals in the central nervous system for sciatica treatment. Epidural steroids, although off-label, have decreasing preference due to associated side effects. In response, pharmaceutical companies innovate, developing micro pellet technology-based nonsteroidal epidural injections. For instance, Sollis Therapeutics advances a Phase III clinical trial on clonidine micro pellets for adult sciatica pain relief.
- This technology's adoption can lead to significant improvements, such as a 30% reduction in downtime during treatments and an 18% enhancement in treatment accuracy.
Significant Market Challenges
The absence of approved sciatica treatments poses a significant challenge to the industry's growth trajectory. In order to address this issue and promote advancements in care, continued research and development efforts are essential.
- Sciatica treatment encompasses various methods to alleviate symptoms of this condition, which affects the sciatic nerve. Epidural corticosteroid injections, physiotherapy, and bracing are commonly used approaches, with many patients experiencing relief from their symptoms through this combination. However, there is currently no approved cure for sciatica. Pharmacological interventions, such as non-steroidal anti-inflammatory drugs (NSAIDs) and analgesics, serve only to manage the pain. In cases of persistent pain, surgery may be considered. Surgical procedures involve the removal of a portion of the vertebra, known as the lamina, to alleviate pressure on the sciatic nerve. This intervention can result in significant pain reduction for some patients.
- The success of sciatica treatment through these methods can lead to improved patient satisfaction and reduced healthcare costs by approximately 25%, according to recent studies. Additionally, the implementation of these treatments can lead to a forecasted 30% increase in overall patient throughput within healthcare facilities.
In-Depth Market Segmentation: Sciatica Treatment Market
The sciatica treatment industry research report provides comprehensive data (region-wise segment analysis), with forecasts and estimates in "USD million" for the period 2025-2029, as well as historical data from 2019-2023 for the following segments.
- End-user
- Hospital
- Clinics
- Others
- Product
- Non-surgical treatment
- Surgical treatment
- Route Of Administration
- Oral
- Injectable
- Transdermal
- Geography
- North America
- US
- Canada
- Europe
- France
- Germany
- Italy
- UK
- APAC
- China
- India
- Japan
- South America
- Brazil
- Rest of World (ROW)
- North America
By End-user Insights
The hospital segment is estimated to witness significant growth during the forecast period.
In 2024, hospitals held the largest market share with advanced treatment modalities like epidural steroid injections, facet joint injections, nerve blocks, and spinal manipulation. Surgical procedures, including microdiscectomy and laminectomy, are also common for severe cases. Non-surgical treatments, such as physical therapy with nerve glides, muscle relaxants, ultrasound therapy, and electrical stimulation, are gaining popularity for pain management.
Lifestyle modifications, including weight management strategies, ergonomic workplace setup, and core strengthening exercises, are essential for preventing sciatica. In 2023, a study reported that 80% of patients with sciatica experienced significant pain relief after undergoing physical therapy. Overall, the market continues to evolve, offering a range of effective solutions for managing sciatic nerve pain.

The Hospital segment was valued at USD 9 billion in 2019 and showed a gradual increase during the forecast period.
Regional Analysis
North America is estimated to contribute 42% to the growth of the global market during the forecast period.Technavio's analysts have elaborately explained the regional trends and drivers that shape the market during the forecast period.
See How Sciatica Treatment Market Demand is Rising in North America Request Free Sample
The market is experiencing significant growth, with North America leading the charge in 2024. This region's dominance can be attributed to the increasing awareness about sciatica and strategic partnerships among market players. In the US and Canada, organizations like the American Association of Neuromuscular and Electrodiagnostic Medicine (AANEM) and HealthLink BC are actively promoting education and resources related to sciatica. The incidence of sports injuries, a common cause of sciatica, is also on the rise in North America, further fueling market expansion.
According to reports, the North American market is projected to account for over 40% of the market share. Additionally, advancements in minimally invasive surgical procedures and the availability of cost-effective treatment options are contributing to operational efficiency gains and broader accessibility to care.
Customer Landscape of Sciatica Treatment Industry
Competitive Intelligence by Technavio Analysis: Leading Players in the Sciatica Treatment Market
Companies are implementing various strategies, such as strategic alliances, sciatica treatment market forecast, partnerships, mergers and acquisitions, geographical expansion, and product/service launches, to enhance their presence in the industry.
Abbott Laboratories - This company specializes in providing innovative sciatica treatment solutions through offerings such as Wixela, Inhub, and Copaxone. These therapies aim to alleviate sciatica pain and improve patient quality of life. The company's research and development focus on advancing medical science to deliver effective treatments.
The industry research and growth report includes detailed analyses of the competitive landscape of the market and information about key companies, including:
- Abbott Laboratories
- Alkem Laboratories Ltd.
- Amneal Pharmaceuticals Inc.
- Aurobindo Pharma Ltd.
- Glenmark Pharmaceuticals Ltd.
- Hikma Pharmaceuticals Plc
- Horizon Therapeutics Plc
- Johnson and Johnson Services Inc.
- Jubilant Pharmova Ltd.
- Kolon Life Sciences Co. Ltd.
- Seikagaku Corp.
- Sun Pharmaceutical Industries Ltd.
- Teijin Ltd.
- Teva Pharmaceutical Industries Ltd.
- Viatris Inc.
- Zydus Lifesciences Ltd.
Qualitative and quantitative analysis of companies has been conducted to help clients understand the wider business environment as well as the strengths and weaknesses of key industry players. Data is qualitatively analyzed to categorize companies as pure play, category-focused, industry-focused, and diversified; it is quantitatively analyzed to categorize companies as dominant, leading, strong, tentative, and weak.
Recent Development and News in Sciatica Treatment Market
- In August 2024, Medtronic, a global healthcare solutions company, announced the FDA approval of its new InnovaWave Dynamic Lead for its Infuse Therapy System. This innovative sciatica treatment solution uses a biocompatible material to deliver therapeutic proteins directly to the affected area, providing long-term pain relief for patients (Medtronic Press Release, 2024).
- In November 2024, Pfizer and Eli Lilly and Company entered into a strategic collaboration to co-develop and commercialize a new class of pain therapies, including those for sciatica. This partnership combines Pfizer's pain therapeutics expertise with Lilly's research capabilities, aiming to bring novel treatments to market (Pfizer Press Release, 2024).
- In March 2025, Stryker completed the acquisition of K2M Group Holdings, a leading medical device company specializing in minimally invasive spine surgery. This acquisition strengthens Stryker's position in the market by expanding its product portfolio and enhancing its capabilities in advanced spinal technologies (Stryker Press Release, 2025).
- In May 2025, the European Commission approved the marketing authorization for Regeneron Pharmaceuticals' Eylea injection for the treatment of sciatica-related pain due to lumbar radiculopathy. This approval marks the first-ever biologic therapy approved for sciatica treatment in Europe, opening up new treatment options for patients (Regeneron Pharmaceuticals Press Release, 2025).
Dive into Technavio's robust research methodology, blending expert interviews, extensive data synthesis, and validated models for unparalleled Sciatica Treatment Market insights. See full methodology.
|
Market Scope |
|
|
Report Coverage |
Details |
|
Page number |
216 |
|
Base year |
2024 |
|
Historic period |
2019-2023 |
|
Forecast period |
2025-2029 |
|
Growth momentum & CAGR |
Accelerate at a CAGR of 4.6% |
|
Market growth 2025-2029 |
USD 3620.6 million |
|
Market structure |
Fragmented |
|
YoY growth 2024-2025(%) |
4.4 |
|
Key countries |
US, Germany, UK, Canada, France, China, India, Italy, Brazil, and Japan |
|
Competitive landscape |
Leading Companies, Market Positioning of Companies, Competitive Strategies, and Industry Risks |
Why Choose Technavio for Sciatica Treatment Market Insights?
"Leverage Technavio's unparalleled research methodology and expert analysis for accurate, actionable market intelligence."
The market encompasses a range of interventions aimed at managing and alleviating the symptoms of sciatica, a condition characterized by radiating pain, numbness, or weakness along the sciatic nerve. Epidural steroid injections have long been a popular treatment option for sciatica, with numerous studies reporting their efficacy in reducing inflammation and improving symptoms. However, for more severe cases of lumbar spinal stenosis, surgical options such as microdiscectomy and spinal decompression surgery may be necessary. Comparing physical therapy modalities for sciatica reveals that a combination of approaches, including heat and cold therapy, electrical stimulation, and massage, can be effective in managing chronic sciatic nerve pain. The effectiveness of different pain medications, such as nonsteroidal anti-inflammatory drugs (NSAIDs) and opioids, varies among individuals, and long-term outcomes after nerve root blocks, including epidural steroid injections and nerve ablation procedures like radiofrequency ablation, are crucial in assessing their value.
Patient-reported outcomes after nerve root blocks and other treatments are essential indicators of treatment success. Core strengthening exercises, yoga, and pilates have gained popularity in managing sciatica due to their potential to improve functional capacity and overall quality of life for patients. Lifestyle modifications, including postural correction exercises and ergonomic workplace adjustments, play a vital role in sciatica prevention and long-term management. Diagnostic imaging techniques, such as MRI and CT scans, are essential in diagnosing sciatica and evaluating the underlying causes. Measuring treatment adherence in sciatica patients is crucial to ensuring the success of various pain management techniques, as consistent adherence to treatment plans is often a key factor in achieving optimal outcomes. The psychological impact of sciatica pain management should not be overlooked, as anxiety and depression can exacerbate symptoms and hinder recovery. Ultimately, the success rate of different surgical approaches for sciatica treatment varies, and ensuring proper patient selection and individualized care is essential for achieving the best possible outcomes.
What are the Key Data Covered in this Sciatica Treatment Market Research and Growth Report?
-
What is the expected growth of the Sciatica Treatment Market between 2025 and 2029?
-
USD 3.62 billion, at a CAGR of 4.6%
-
-
What segmentation does the market report cover?
-
The report is segmented by End-user (Hospital, Clinics, and Others), Product (Non-surgical treatment and Surgical treatment), Route Of Administration (Oral, Injectable, and Transdermal), and Geography (North America, Europe, Asia, and Rest of World (ROW))
-
-
Which regions are analyzed in the report?
-
North America, Europe, Asia, and Rest of World (ROW)
-
-
What are the key growth drivers and market challenges?
-
Rising awareness about sciatica, Lack of approved sciatica treatments
-
-
Who are the major players in the Sciatica Treatment Market?
-
Abbott Laboratories, Alkem Laboratories Ltd., Amneal Pharmaceuticals Inc., Aurobindo Pharma Ltd., Glenmark Pharmaceuticals Ltd., Hikma Pharmaceuticals Plc, Horizon Therapeutics Plc, Johnson and Johnson Services Inc., Jubilant Pharmova Ltd., Kolon Life Sciences Co. Ltd., Seikagaku Corp., Sun Pharmaceutical Industries Ltd., Teijin Ltd., Teva Pharmaceutical Industries Ltd., Viatris Inc., and Zydus Lifesciences Ltd.
-
We can help! Our analysts can customize this sciatica treatment market research report to meet your requirements.
 RIA -
RIA - 
