Self-driving Truck Market Analysis, Size, and Forecast 2025-2029: North America (US, Canada, and Mexico), APAC (China, Japan, and India), Europe (Germany, UK, and France), South America (Brazil, Argentina, and Colombia), Middle East and Africa (Saudi Arabia, UAE, and South Africa), and Rest of World (ROW)

Self-driving Truck Market Analysis, Size, and Forecast 2025-2029:
North America (US, Canada, and Mexico), APAC (China, Japan, and India), Europe (Germany, UK, and France), South America (Brazil, Argentina, and Colombia), Middle East and Africa (Saudi Arabia, UAE, and South Africa), and Rest of World (ROW)

Published: Dec 2025 305 Pages SKU: IRTNTR73336

Market Overview at a Glance

$52.34 B
Market Opportunity
19.3%
CAGR 2024 - 2029
49%
North America Growth
$16.11 B
Logistics segment 2023

Self-driving Truck Market Size 2025-2029

The self-driving truck market size is valued to increase by USD 52.34 billion, at a CAGR of 19.3% from 2024 to 2029. Advancements in technology propelling market growth will drive the self-driving truck market.

Major Market Trends & Insights

  • North America dominated the market and accounted for a 49% growth during the forecast period.
  • By End-user - Logistics segment was valued at USD 16.11 billion in 2023
  • By Technology - Level 1 segment accounted for the largest market revenue share in 2023

Market Size & Forecast

  • Market Opportunities: USD 60.08 billion
  • Market Future Opportunities: USD 52.34 billion
  • CAGR from 2024 to 2029 : 19.3%

Market Summary

What will be the Size of the Self-driving Truck Market during the forecast period?

Get Key Insights on Market Forecast (PDF) Request Free Sample

How is the Self-driving Truck Market Segmented?

The self-driving truck industry research report provides comprehensive data (region-wise segment analysis), with forecasts and estimates in "USD million" for the period 2025-2029, as well as historical data from 2019-2023 for the following segments.
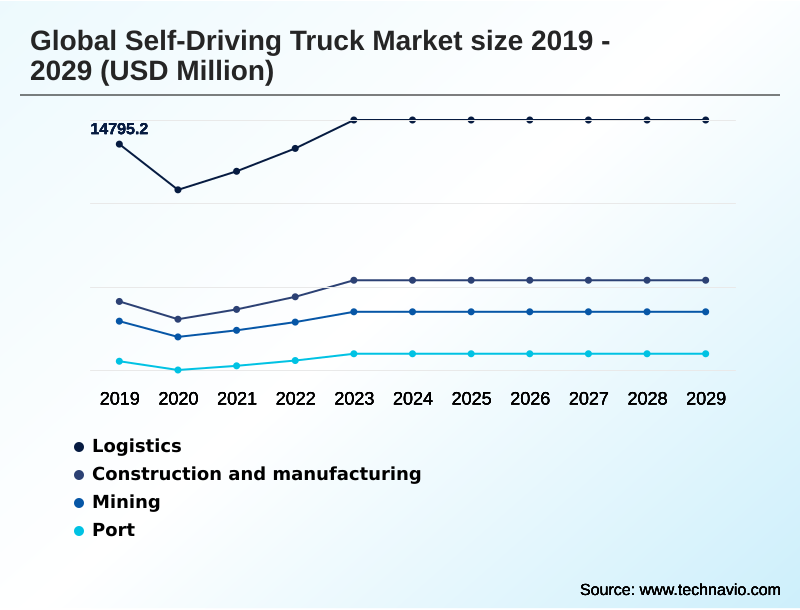
  • End-user
    • Logistics
    • Construction and manufacturing
    • Mining
    • Port
  • Technology
    • Level 1
    • Level 3
    • Level 4
    • Level 5
  • Propulsion
    • Internal combustion
    • Hybrid transmission
    • Electric transmission
  • Geography
    • North America
      • US
      • Canada
      • Mexico
    • APAC
      • China
      • Japan
      • India
    • Europe
      • Germany
      • UK
      • France
    • South America
      • Brazil
      • Argentina
      • Colombia
    • Middle East and Africa
      • Saudi Arabia
      • UAE
      • South Africa
    • Rest of World (ROW)

By End-user Insights

The logistics segment is estimated to witness significant growth during the forecast period.

Request Free Sample

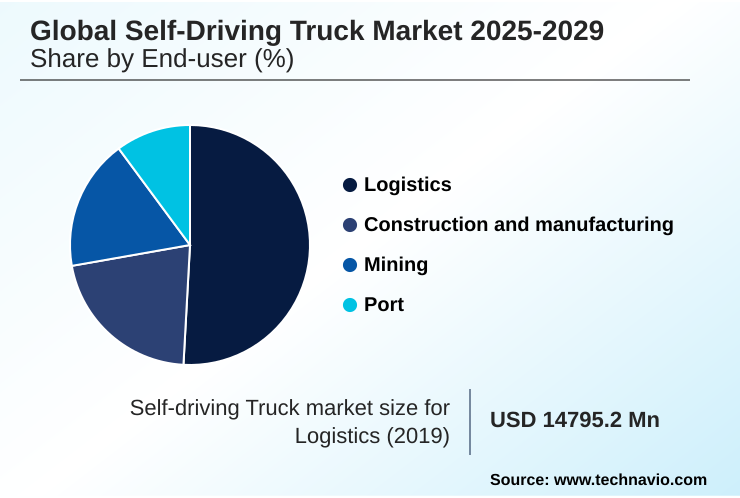
The Logistics segment was valued at USD 16.11 billion in 2023 and showed a gradual increase during the forecast period.

Request Free Sample

Regional Analysis

North America is estimated to contribute 49% to the growth of the global market during the forecast period.Technavio’s analysts have elaborately explained the regional trends and drivers that shape the market during the forecast period.

See How Self-driving Truck Market Demand is Rising in North America Request Free Sample

Market Dynamics

Our researchers analyzed the data with 2024 as the base year, along with the key drivers, trends, and challenges. A holistic analysis of drivers will help companies refine their marketing strategies to gain a competitive advantage.

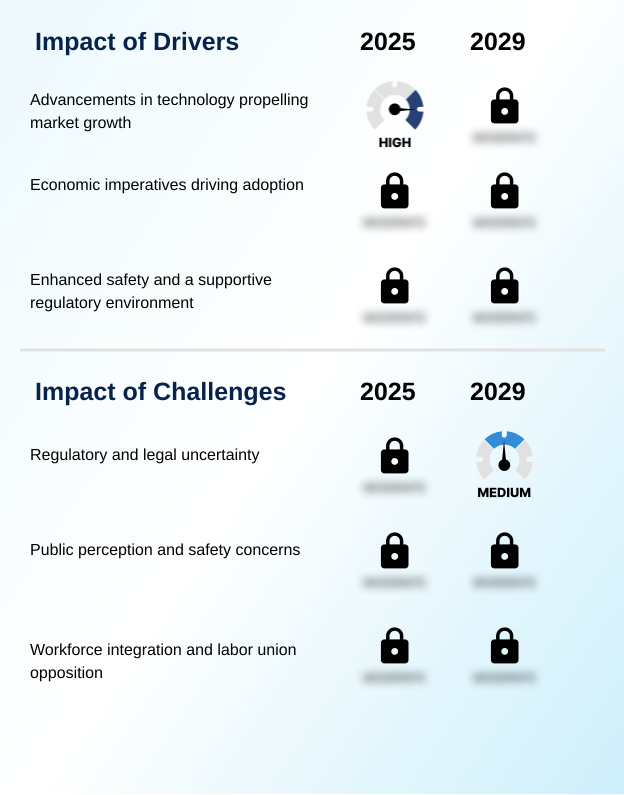
What are the key market drivers leading to the rise in the adoption of Self-driving Truck Industry?

What are the market trends shaping the Self-driving Truck Industry?

What challenges does the Self-driving Truck Industry face during its growth?

Exclusive Technavio Analysis on Customer Landscape

The self-driving truck market forecasting report includes the adoption lifecycle of the market, covering from the innovator’s stage to the laggard’s stage. It focuses on adoption rates in different regions based on penetration. Furthermore, the self-driving truck market report also includes key purchase criteria and drivers of price sensitivity to help companies evaluate and develop their market growth analysis strategies.

Customer Landscape of Self-driving Truck Industry

Competitive Landscape

Companies are implementing various strategies, such as strategic alliances, self-driving truck market forecast, partnerships, mergers and acquisitions, geographical expansion, and product/service launches, to enhance their presence in the industry.

AB Volvo -

The industry research and growth report includes detailed analyses of the competitive landscape of the market and information about key companies, including:

  • AB Volvo
  • Caterpillar Inc.
  • Continental AG
  • Daimler Truck AG
  • Einride AB
  • Ford Motor Co.
  • Inceptio Technology
  • Isuzu Motors Ltd.
  • Iveco Group N.V
  • Kodiak Robotics Inc.
  • PACCAR Inc.
  • PlusAI Inc.
  • Tesla Inc.
  • Torc Robotics Inc.
  • Traton SE
  • Volkswagen AG
  • Waymo LLC

Qualitative and quantitative analysis of companies has been conducted to help clients understand the wider business environment as well as the strengths and weaknesses of key industry players. Data is qualitatively analyzed to categorize companies as pure play, category-focused, industry-focused, and diversified; it is quantitatively analyzed to categorize companies as dominant, leading, strong, tentative, and weak.

Recent Development and News in Self-driving truck market

Dive into Technavio’s robust research methodology, blending expert interviews, extensive data synthesis, and validated models for unparalleled Self-driving Truck Market insights. See full methodology.

Market Scope
Page number 305
Base year 2024
Historic period 2019-2023
Forecast period 2025-2029
Growth momentum & CAGR Accelerate at a CAGR of 19.3%
Market growth 2025-2029 USD 52344.2 million
Market structure Fragmented
YoY growth 2024-2025(%) 14.8%
Key countries US, Canada, Mexico, China, Japan, India, South Korea, Australia, Indonesia, Germany, UK, France, Italy, The Netherlands, Spain, Brazil, Argentina, Colombia, Saudi Arabia, UAE, South Africa, Israel and Turkey
Competitive landscape Leading Companies, Market Positioning of Companies, Competitive Strategies, and Industry Risks

Request Free Sample

Research Analyst Overview

What are the Key Data Covered in this Self-driving Truck Market Research and Growth Report?

  • What is the expected growth of the Self-driving Truck Market between 2025 and 2029?

    • USD 52.34 billion, at a CAGR of 19.3%

  • What segmentation does the market report cover?

    • The report is segmented by End-user (Logistics, Construction and manufacturing, Mining, and Port), Technology (Level 1, Level 3, Level 4, and Level 5), Propulsion (Internal combustion, Hybrid transmission, and Electric transmission) and Geography (North America, APAC, Europe, South America, Middle East and Africa)

  • Which regions are analyzed in the report?

    • North America, APAC, Europe, South America and Middle East and Africa

  • What are the key growth drivers and market challenges?

    • Advancements in technology propelling market growth, Regulatory and legal uncertainty

  • Who are the major players in the Self-driving Truck Market?

    • AB Volvo, Caterpillar Inc., Continental AG, Daimler Truck AG, Einride AB, Ford Motor Co., Inceptio Technology, Isuzu Motors Ltd., Iveco Group N.V, Kodiak Robotics Inc., PACCAR Inc., PlusAI Inc., Tesla Inc., Torc Robotics Inc., Traton SE, Volkswagen AG and Waymo LLC

Market Research Insights

We can help! Our analysts can customize this self-driving truck market research report to meet your requirements.

Get in touch

1. Executive Summary

1.1 Market overview

Executive Summary - Chart on Market Overview
Executive Summary - Data Table on Market Overview
Executive Summary - Chart on Global Market Characteristics
Executive Summary - Chart on Market by Geography
Executive Summary - Chart on Market Segmentation by End-user
Executive Summary - Chart on Market Segmentation by Technology
Executive Summary - Chart on Market Segmentation by Propulsion
Executive Summary - Chart on Incremental Growth
Executive Summary - Data Table on Incremental Growth
Executive Summary - Chart on Company Market Positioning

2. Technavio Analysis

2.1 Analysis of price sensitivity, lifecycle, customer purchase basket, adoption rates, and purchase criteria

2.2 Criticality of inputs and Factors of differentiation

Chart on Overview on criticality of inputs and factors of differentiation

2.3 Factors of disruption

Chart on Overview on factors of disruption

2.4 Impact of drivers and challenges

Chart on Impact of drivers and challenges in 2024 and 2029

3. Market Landscape

3.1 Market ecosystem

Chart on Parent Market
Data Table on - Parent Market

3.2 Market characteristics

Chart on Market characteristics analysis

3.3 Value chain analysis

Chart on Value chain analysis

4. Market Sizing

4.1 Market definition

Data Table on Offerings of companies included in the market definition

4.2 Market segment analysis

Market segments

4.3 Market size 2024

4.4 Market outlook: Forecast for 2024-2029

Chart on Global - Market size and forecast 2024-2029 ($ million)
Data Table on Global - Market size and forecast 2024-2029 ($ million)
Chart on Global Market: Year-over-year growth 2024-2029 (%)
Data Table on Global Market: Year-over-year growth 2024-2029 (%)

5. Historic Market Size

5.1 Global Self-Driving Truck Market 2019 - 2023

Historic Market Size - Data Table on Global Self-Driving Truck Market 2019 - 2023 ($ million)

5.2 End-user segment analysis 2019 - 2023

Historic Market Size - End-user Segment 2019 - 2023 ($ million)

5.3 Technology segment analysis 2019 - 2023

Historic Market Size - Technology Segment 2019 - 2023 ($ million)

5.4 Propulsion segment analysis 2019 - 2023

Historic Market Size - Propulsion Segment 2019 - 2023 ($ million)

5.5 Geography segment analysis 2019 - 2023

Historic Market Size - Geography Segment 2019 - 2023 ($ million)

5.6 Country segment analysis 2019 - 2023

Historic Market Size - Country Segment 2019 - 2023 ($ million)

6. Qualitative Analysis

6.1 Impact of AI on Global Self-driving Truck Market

7. Five Forces Analysis

7.1 Five forces summary

Five forces analysis - Comparison between 2024 and 2029

7.2 Bargaining power of buyers

Bargaining power of buyers - Impact of key factors 2024 and 2029

7.3 Bargaining power of suppliers

Bargaining power of suppliers - Impact of key factors in 2024 and 2029

7.4 Threat of new entrants

Threat of new entrants - Impact of key factors in 2024 and 2029

7.5 Threat of substitutes

Threat of substitutes - Impact of key factors in 2024 and 2029

7.6 Threat of rivalry

Threat of rivalry - Impact of key factors in 2024 and 2029

7.7 Market condition

Chart on Market condition - Five forces 2024 and 2029

8. Market Segmentation by End-user

8.1 Market segments

Chart on End-user - Market share 2024-2029 (%)
Data Table on End-user - Market share 2024-2029 (%)

8.2 Comparison by End-user

Chart on Comparison by End-user
Data Table on Comparison by End-user

8.3 Logistics - Market size and forecast 2024-2029

Chart on Logistics - Market size and forecast 2024-2029 ($ million)
Data Table on Logistics - Market size and forecast 2024-2029 ($ million)
Chart on Logistics - Year-over-year growth 2024-2029 (%)
Data Table on Logistics - Year-over-year growth 2024-2029 (%)

8.4 Construction and manufacturing - Market size and forecast 2024-2029

Chart on Construction and manufacturing - Market size and forecast 2024-2029 ($ million)
Data Table on Construction and manufacturing - Market size and forecast 2024-2029 ($ million)
Chart on Construction and manufacturing - Year-over-year growth 2024-2029 (%)
Data Table on Construction and manufacturing - Year-over-year growth 2024-2029 (%)

8.5 Mining - Market size and forecast 2024-2029

Chart on Mining - Market size and forecast 2024-2029 ($ million)
Data Table on Mining - Market size and forecast 2024-2029 ($ million)
Chart on Mining - Year-over-year growth 2024-2029 (%)
Data Table on Mining - Year-over-year growth 2024-2029 (%)

8.6 Port - Market size and forecast 2024-2029

Chart on Port - Market size and forecast 2024-2029 ($ million)
Data Table on Port - Market size and forecast 2024-2029 ($ million)
Chart on Port - Year-over-year growth 2024-2029 (%)
Data Table on Port - Year-over-year growth 2024-2029 (%)

8.7 Market opportunity by End-user

Market opportunity by End-user ($ million)
Data Table on Market opportunity by End-user ($ million)

9. Market Segmentation by Technology

9.1 Market segments

Chart on Technology - Market share 2024-2029 (%)
Data Table on Technology - Market share 2024-2029 (%)

9.2 Comparison by Technology

Chart on Comparison by Technology
Data Table on Comparison by Technology

9.3 Level 1 - Market size and forecast 2024-2029

Chart on Level 1 - Market size and forecast 2024-2029 ($ million)
Data Table on Level 1 - Market size and forecast 2024-2029 ($ million)
Chart on Level 1 - Year-over-year growth 2024-2029 (%)
Data Table on Level 1 - Year-over-year growth 2024-2029 (%)

9.4 Level 3 - Market size and forecast 2024-2029

Chart on Level 3 - Market size and forecast 2024-2029 ($ million)
Data Table on Level 3 - Market size and forecast 2024-2029 ($ million)
Chart on Level 3 - Year-over-year growth 2024-2029 (%)
Data Table on Level 3 - Year-over-year growth 2024-2029 (%)

9.5 Level 4 - Market size and forecast 2024-2029

Chart on Level 4 - Market size and forecast 2024-2029 ($ million)
Data Table on Level 4 - Market size and forecast 2024-2029 ($ million)
Chart on Level 4 - Year-over-year growth 2024-2029 (%)
Data Table on Level 4 - Year-over-year growth 2024-2029 (%)

9.6 Level 5 - Market size and forecast 2024-2029

Chart on Level 5 - Market size and forecast 2024-2029 ($ million)
Data Table on Level 5 - Market size and forecast 2024-2029 ($ million)
Chart on Level 5 - Year-over-year growth 2024-2029 (%)
Data Table on Level 5 - Year-over-year growth 2024-2029 (%)

9.7 Market opportunity by Technology

Market opportunity by Technology ($ million)
Data Table on Market opportunity by Technology ($ million)

10. Market Segmentation by Propulsion

10.1 Market segments

Chart on Propulsion - Market share 2024-2029 (%)
Data Table on Propulsion - Market share 2024-2029 (%)

10.2 Comparison by Propulsion

Chart on Comparison by Propulsion
Data Table on Comparison by Propulsion

10.3 Internal combustion - Market size and forecast 2024-2029

Chart on Internal combustion - Market size and forecast 2024-2029 ($ million)
Data Table on Internal combustion - Market size and forecast 2024-2029 ($ million)
Chart on Internal combustion - Year-over-year growth 2024-2029 (%)
Data Table on Internal combustion - Year-over-year growth 2024-2029 (%)

10.4 Hybrid transmission - Market size and forecast 2024-2029

Chart on Hybrid transmission - Market size and forecast 2024-2029 ($ million)
Data Table on Hybrid transmission - Market size and forecast 2024-2029 ($ million)
Chart on Hybrid transmission - Year-over-year growth 2024-2029 (%)
Data Table on Hybrid transmission - Year-over-year growth 2024-2029 (%)

10.5 Electric transmission - Market size and forecast 2024-2029

Chart on Electric transmission - Market size and forecast 2024-2029 ($ million)
Data Table on Electric transmission - Market size and forecast 2024-2029 ($ million)
Chart on Electric transmission - Year-over-year growth 2024-2029 (%)
Data Table on Electric transmission - Year-over-year growth 2024-2029 (%)

10.6 Market opportunity by Propulsion

Market opportunity by Propulsion ($ million)
Data Table on Market opportunity by Propulsion ($ million)

11. Customer Landscape

11.1 Customer landscape overview

Analysis of price sensitivity, lifecycle, customer purchase basket, adoption rates, and purchase criteria

12. Geographic Landscape

12.1 Geographic segmentation

Chart on Market share by geography 2024-2029 (%)
Data Table on Market share by geography 2024-2029 (%)

12.2 Geographic comparison

Chart on Geographic comparison
Data Table on Geographic comparison

12.3 North America - Market size and forecast 2024-2029

Chart on North America - Market size and forecast 2024-2029 ($ million)
Data Table on North America - Market size and forecast 2024-2029 ($ million)
Chart on North America - Year-over-year growth 2024-2029 (%)
Data Table on North America - Year-over-year growth 2024-2029 (%)
Chart on Regional Comparison - North America
Data Table on Regional Comparison - North America

12.3.1 US - Market size and forecast 2024-2029

Chart on US - Market size and forecast 2024-2029 ($ million)
Data Table on US - Market size and forecast 2024-2029 ($ million)
Chart on US - Year-over-year growth 2024-2029 (%)
Data Table on US - Year-over-year growth 2024-2029 (%)

12.3.2 Canada - Market size and forecast 2024-2029

Chart on Canada - Market size and forecast 2024-2029 ($ million)
Data Table on Canada - Market size and forecast 2024-2029 ($ million)
Chart on Canada - Year-over-year growth 2024-2029 (%)
Data Table on Canada - Year-over-year growth 2024-2029 (%)

12.3.3 Mexico - Market size and forecast 2024-2029

Chart on Mexico - Market size and forecast 2024-2029 ($ million)
Data Table on Mexico - Market size and forecast 2024-2029 ($ million)
Chart on Mexico - Year-over-year growth 2024-2029 (%)
Data Table on Mexico - Year-over-year growth 2024-2029 (%)

12.4 APAC - Market size and forecast 2024-2029

Chart on APAC - Market size and forecast 2024-2029 ($ million)
Data Table on APAC - Market size and forecast 2024-2029 ($ million)
Chart on APAC - Year-over-year growth 2024-2029 (%)
Data Table on APAC - Year-over-year growth 2024-2029 (%)
Chart on Regional Comparison - APAC
Data Table on Regional Comparison - APAC

12.4.1 China - Market size and forecast 2024-2029

Chart on China - Market size and forecast 2024-2029 ($ million)
Data Table on China - Market size and forecast 2024-2029 ($ million)
Chart on China - Year-over-year growth 2024-2029 (%)
Data Table on China - Year-over-year growth 2024-2029 (%)

12.4.2 Japan - Market size and forecast 2024-2029

Chart on Japan - Market size and forecast 2024-2029 ($ million)
Data Table on Japan - Market size and forecast 2024-2029 ($ million)
Chart on Japan - Year-over-year growth 2024-2029 (%)
Data Table on Japan - Year-over-year growth 2024-2029 (%)

12.4.3 India - Market size and forecast 2024-2029

Chart on India - Market size and forecast 2024-2029 ($ million)
Data Table on India - Market size and forecast 2024-2029 ($ million)
Chart on India - Year-over-year growth 2024-2029 (%)
Data Table on India - Year-over-year growth 2024-2029 (%)

12.4.4 South Korea - Market size and forecast 2024-2029

Chart on South Korea - Market size and forecast 2024-2029 ($ million)
Data Table on South Korea - Market size and forecast 2024-2029 ($ million)
Chart on South Korea - Year-over-year growth 2024-2029 (%)
Data Table on South Korea - Year-over-year growth 2024-2029 (%)

12.4.5 Australia - Market size and forecast 2024-2029

Chart on Australia - Market size and forecast 2024-2029 ($ million)
Data Table on Australia - Market size and forecast 2024-2029 ($ million)
Chart on Australia - Year-over-year growth 2024-2029 (%)
Data Table on Australia - Year-over-year growth 2024-2029 (%)

12.4.6 Indonesia - Market size and forecast 2024-2029

Chart on Indonesia - Market size and forecast 2024-2029 ($ million)
Data Table on Indonesia - Market size and forecast 2024-2029 ($ million)
Chart on Indonesia - Year-over-year growth 2024-2029 (%)
Data Table on Indonesia - Year-over-year growth 2024-2029 (%)

12.5 Europe - Market size and forecast 2024-2029

Chart on Europe - Market size and forecast 2024-2029 ($ million)
Data Table on Europe - Market size and forecast 2024-2029 ($ million)
Chart on Europe - Year-over-year growth 2024-2029 (%)
Data Table on Europe - Year-over-year growth 2024-2029 (%)
Chart on Regional Comparison - Europe
Data Table on Regional Comparison - Europe

12.5.1 Germany - Market size and forecast 2024-2029

Chart on Germany - Market size and forecast 2024-2029 ($ million)
Data Table on Germany - Market size and forecast 2024-2029 ($ million)
Chart on Germany - Year-over-year growth 2024-2029 (%)
Data Table on Germany - Year-over-year growth 2024-2029 (%)

12.5.2 UK - Market size and forecast 2024-2029

Chart on UK - Market size and forecast 2024-2029 ($ million)
Data Table on UK - Market size and forecast 2024-2029 ($ million)
Chart on UK - Year-over-year growth 2024-2029 (%)
Data Table on UK - Year-over-year growth 2024-2029 (%)

12.5.3 France - Market size and forecast 2024-2029

Chart on France - Market size and forecast 2024-2029 ($ million)
Data Table on France - Market size and forecast 2024-2029 ($ million)
Chart on France - Year-over-year growth 2024-2029 (%)
Data Table on France - Year-over-year growth 2024-2029 (%)

12.5.4 Italy - Market size and forecast 2024-2029

Chart on Italy - Market size and forecast 2024-2029 ($ million)
Data Table on Italy - Market size and forecast 2024-2029 ($ million)
Chart on Italy - Year-over-year growth 2024-2029 (%)
Data Table on Italy - Year-over-year growth 2024-2029 (%)

12.5.5 The Netherlands - Market size and forecast 2024-2029

Chart on The Netherlands - Market size and forecast 2024-2029 ($ million)
Data Table on The Netherlands - Market size and forecast 2024-2029 ($ million)
Chart on The Netherlands - Year-over-year growth 2024-2029 (%)
Data Table on The Netherlands - Year-over-year growth 2024-2029 (%)

12.5.6 Spain - Market size and forecast 2024-2029

Chart on Spain - Market size and forecast 2024-2029 ($ million)
Data Table on Spain - Market size and forecast 2024-2029 ($ million)
Chart on Spain - Year-over-year growth 2024-2029 (%)
Data Table on Spain - Year-over-year growth 2024-2029 (%)

12.6 South America - Market size and forecast 2024-2029

Chart on South America - Market size and forecast 2024-2029 ($ million)
Data Table on South America - Market size and forecast 2024-2029 ($ million)
Chart on South America - Year-over-year growth 2024-2029 (%)
Data Table on South America - Year-over-year growth 2024-2029 (%)
Chart on Regional Comparison - South America
Data Table on Regional Comparison - South America

12.6.1 Brazil - Market size and forecast 2024-2029

Chart on Brazil - Market size and forecast 2024-2029 ($ million)
Data Table on Brazil - Market size and forecast 2024-2029 ($ million)
Chart on Brazil - Year-over-year growth 2024-2029 (%)
Data Table on Brazil - Year-over-year growth 2024-2029 (%)

12.6.2 Argentina - Market size and forecast 2024-2029

Chart on Argentina - Market size and forecast 2024-2029 ($ million)
Data Table on Argentina - Market size and forecast 2024-2029 ($ million)
Chart on Argentina - Year-over-year growth 2024-2029 (%)
Data Table on Argentina - Year-over-year growth 2024-2029 (%)

12.6.3 Colombia - Market size and forecast 2024-2029

Chart on Colombia - Market size and forecast 2024-2029 ($ million)
Data Table on Colombia - Market size and forecast 2024-2029 ($ million)
Chart on Colombia - Year-over-year growth 2024-2029 (%)
Data Table on Colombia - Year-over-year growth 2024-2029 (%)

12.7 Middle East and Africa - Market size and forecast 2024-2029

Chart on Middle East and Africa - Market size and forecast 2024-2029 ($ million)
Data Table on Middle East and Africa - Market size and forecast 2024-2029 ($ million)
Chart on Middle East and Africa - Year-over-year growth 2024-2029 (%)
Data Table on Middle East and Africa - Year-over-year growth 2024-2029 (%)
Chart on Regional Comparison - Middle East and Africa
Data Table on Regional Comparison - Middle East and Africa

12.7.1 Saudi Arabia - Market size and forecast 2024-2029

Chart on Saudi Arabia - Market size and forecast 2024-2029 ($ million)
Data Table on Saudi Arabia - Market size and forecast 2024-2029 ($ million)
Chart on Saudi Arabia - Year-over-year growth 2024-2029 (%)
Data Table on Saudi Arabia - Year-over-year growth 2024-2029 (%)

12.7.2 UAE - Market size and forecast 2024-2029

Chart on UAE - Market size and forecast 2024-2029 ($ million)
Data Table on UAE - Market size and forecast 2024-2029 ($ million)
Chart on UAE - Year-over-year growth 2024-2029 (%)
Data Table on UAE - Year-over-year growth 2024-2029 (%)

12.7.3 South Africa - Market size and forecast 2024-2029

Chart on South Africa - Market size and forecast 2024-2029 ($ million)
Data Table on South Africa - Market size and forecast 2024-2029 ($ million)
Chart on South Africa - Year-over-year growth 2024-2029 (%)
Data Table on South Africa - Year-over-year growth 2024-2029 (%)

12.7.4 Israel - Market size and forecast 2024-2029

Chart on Israel - Market size and forecast 2024-2029 ($ million)
Data Table on Israel - Market size and forecast 2024-2029 ($ million)
Chart on Israel - Year-over-year growth 2024-2029 (%)
Data Table on Israel - Year-over-year growth 2024-2029 (%)

12.7.5 Turkey - Market size and forecast 2024-2029

Chart on Turkey - Market size and forecast 2024-2029 ($ million)
Data Table on Turkey - Market size and forecast 2024-2029 ($ million)
Chart on Turkey - Year-over-year growth 2024-2029 (%)
Data Table on Turkey - Year-over-year growth 2024-2029 (%)

12.8 Market opportunity by geography

Market opportunity by geography ($ million)
Data Tables on Market opportunity by geography ($ million)

13. Drivers, Challenges, and Opportunity

13.1 Market drivers

Advancements in technology propelling market growth
Economic imperatives driving adoption
Enhanced safety and a supportive regulatory environment

13.2 Market challenges

Regulatory and legal uncertainty
Public perception and safety concerns
Workforce integration and labor union opposition

13.3 Impact of drivers and challenges

Impact of drivers and challenges in 2024 and 2029

13.4 Market opportunities

Advancements in AI and ML fueling autonomous truck development
Rise of platooning technology for enhanced efficiency and safety
Evolving regulatory frameworks and strategic collaborations shaping

14. Competitive Landscape

14.1 Overview

14.2

Overview on criticality of inputs and factors of differentiation

14.3 Landscape disruption

Overview on factors of disruption

14.4 Industry risks

Impact of key risks on business

15. Competitive Analysis

15.1 Companies profiled

Companies covered

15.2 Company ranking index

15.3 Market positioning of companies

Matrix on companies position and classification

15.4 AB Volvo

AB Volvo - Overview
AB Volvo - Business segments
AB Volvo - Key news
AB Volvo - Key offerings
AB Volvo - Segment focus
SWOT

15.5 Caterpillar Inc.

Caterpillar Inc. - Overview
Caterpillar Inc. - Business segments
Caterpillar Inc. - Key news
Caterpillar Inc. - Key offerings
Caterpillar Inc. - Segment focus
SWOT

15.6 Continental AG

Continental AG - Overview
Continental AG - Business segments
Continental AG - Key news
Continental AG - Key offerings
Continental AG - Segment focus
SWOT

15.7 Daimler Truck AG

Daimler Truck AG - Overview
Daimler Truck AG - Business segments
Daimler Truck AG - Key news
Daimler Truck AG - Key offerings
Daimler Truck AG - Segment focus
SWOT

15.8 Einride AB

Einride AB - Overview
Einride AB - Product / Service
Einride AB - Key offerings
SWOT

15.9 Ford Motor Co.

Ford Motor Co. - Overview
Ford Motor Co. - Business segments
Ford Motor Co. - Key offerings
Ford Motor Co. - Segment focus
SWOT

15.10 Inceptio Technology

Inceptio Technology - Overview
Inceptio Technology - Product / Service
Inceptio Technology - Key offerings
SWOT

15.11 Kodiak Robotics Inc.

Kodiak Robotics Inc. - Overview
Kodiak Robotics Inc. - Product / Service
Kodiak Robotics Inc. - Key offerings
SWOT

15.12 PACCAR Inc.

PACCAR Inc. - Overview
PACCAR Inc. - Business segments
PACCAR Inc. - Key news
PACCAR Inc. - Key offerings
PACCAR Inc. - Segment focus
SWOT

15.13 PlusAI Inc.

PlusAI Inc. - Overview
PlusAI Inc. - Product / Service
PlusAI Inc. - Key offerings
SWOT

15.14 Tesla Inc.

Tesla Inc. - Overview
Tesla Inc. - Business segments
Tesla Inc. - Key news
Tesla Inc. - Key offerings
Tesla Inc. - Segment focus
SWOT

15.15 Torc Robotics Inc.

Torc Robotics Inc. - Overview
Torc Robotics Inc. - Product / Service
Torc Robotics Inc. - Key offerings
SWOT

15.16 Traton SE

Traton SE - Overview
Traton SE - Business segments
Traton SE - Key offerings
Traton SE - Segment focus
SWOT

15.17 Volkswagen AG

Volkswagen AG - Overview
Volkswagen AG - Business segments
Volkswagen AG - Key news
Volkswagen AG - Key offerings
Volkswagen AG - Segment focus
SWOT

15.18 Waymo LLC

Waymo LLC - Overview
Waymo LLC - Product / Service
Waymo LLC - Key offerings
SWOT

16. Appendix

16.1 Scope of the report

Market definition
Objectives
Notes and caveats

16.2 Inclusions and exclusions checklist

Inclusions checklist
Exclusions checklist

16.3 Currency conversion rates for US$

16.4 Research methodology

16.5 Data procurement

Information sources

16.6 Data validation

16.7 Validation techniques employed for market sizing

16.8 Data synthesis

16.9 360 degree market analysis

16.10 List of abbreviations

Research Methodology

Technavio presents a detailed picture of the market by way of study, synthesis, and summation of data from multiple sources. The analysts have presented the various facets of the market with a particular focus on identifying the key industry influencers. The data thus presented is comprehensive, reliable, and the result of extensive research, both primary and secondary.

INFORMATION SOURCES

Primary sources

  • Manufacturers and suppliers
  • Channel partners
  • Industry experts
  • Strategic decision makers

Secondary sources

  • Industry journals and periodicals
  • Government data
  • Financial reports of key industry players
  • Historical data
  • Press releases

DATA ANALYSIS

Data Synthesis

  • Collation of data
  • Estimation of key figures
  • Analysis of derived insights

Data Validation

  • Triangulation with data models
  • Reference against proprietary databases
  • Corroboration with industry experts

REPORT WRITING

Qualitative

  • Market drivers
  • Market challenges
  • Market trends
  • Five forces analysis

Quantitative

  • Market size and forecast
  • Market segmentation
  • Geographical insights
  • Competitive landscape

Interested in this report?

Get your sample now to see our research methodology and insights!

Download Now

Frequently Asked Questions

Self-driving Truck market growth will increase by USD 52344.2 million during 2025-2029 .

The Self-driving Truck market is expected to grow at a CAGR of 19.3% during 2025-2029 .

Self-driving Truck market is segmented by End-user (Logistics, Construction and manufacturing, Mining, Port) Technology (Level 1, Level 3, Level 4, Level 5) Propulsion (Internal combustion, Hybrid transmission, Electric transmission)

AB Volvo, Caterpillar Inc., Continental AG, Daimler Truck AG, Einride AB, Ford Motor Co., Inceptio Technology, Isuzu Motors Ltd., Iveco Group N.V, Kodiak Robotics Inc., PACCAR Inc., PlusAI Inc., Tesla Inc., Torc Robotics Inc., Traton SE, Volkswagen AG, Waymo LLC are a few of the key vendors in the Self-driving Truck market.

North America will register the highest growth rate of 49% among the other regions. Therefore, the Self-driving Truck market in North America is expected to garner significant business opportunities for the vendors during the forecast period.

US, Canada, Mexico, China, Japan, India, South Korea, Australia, Indonesia, Germany, UK, France, Italy, The Netherlands, Spain, Brazil, Argentina, Colombia, Saudi Arabia, UAE, South Africa, Israel, Turkey

  • Advancements in technology propelling market growth is the driving factor this market.

The Self-driving Truck market vendors should focus on grabbing business opportunities from the End-user segment as it accounted for the largest market share in the base year.