Sheet Metal Processing Equipment Market Analysis, Size, and Forecast 2026-2030: APAC (China, Japan, and South Korea), Europe (Germany, France, and Italy), North America (US, Canada, and Mexico), Middle East and Africa (South Africa, UAE, and Saudi Arabia), South America (Brazil and Argentina), and Rest of World (ROW)

Sheet Metal Processing Equipment Market Analysis, Size, and Forecast 2026-2030:
APAC (China, Japan, and South Korea), Europe (Germany, France, and Italy), North America (US, Canada, and Mexico), Middle East and Africa (South Africa, UAE, and Saudi Arabia), South America (Brazil and Argentina), and Rest of World (ROW)

Published: Dec 2025 299 Pages SKU: IRTNTR70017

Market Overview at a Glance

$5.23 B
Market Opportunity
6.7%
CAGR 2025 - 2030
58.3%
APAC Growth
$8.28 B
Metal cutting segment 2024

Sheet Metal Processing Equipment Market Size 2026-2030

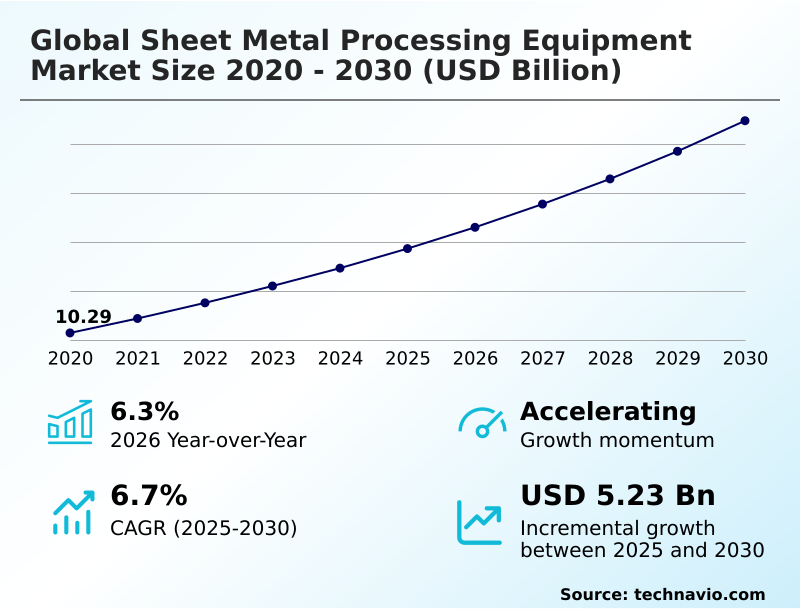
The sheet metal processing equipment market size is valued to increase by USD 5.23 billion, at a CAGR of 6.7% from 2025 to 2030. Increasing pace of technological innovation will drive the sheet metal processing equipment market.

Major Market Trends & Insights

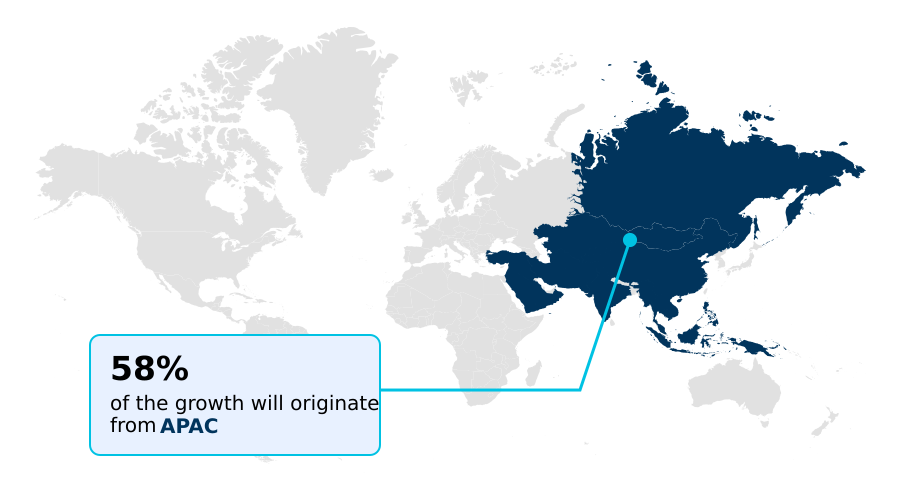
  • APAC dominated the market and accounted for a 58.3% growth during the forecast period.
  • By Application - Metal cutting segment was valued at USD 8.28 billion in 2024
  • By End-user - Automotive segment accounted for the largest market revenue share in 2024

Market Size & Forecast

  • Market Opportunities: USD 8.68 billion
  • Market Future Opportunities: USD 5.23 billion
  • CAGR from 2025 to 2030 : 6.7%

Market Summary

  • The sheet metal processing equipment market is undergoing a significant transformation, driven by the convergence of advanced automation and the demand for higher precision in manufacturing. Core drivers include the rapid pace of technological innovation, particularly in high-power fiber lasers and robotic systems, which enable fabricators to achieve greater efficiency and handle advanced materials.
  • Key end-use industries, such as automotive, aerospace, and electronics, are creating sustained demand for sophisticated machinery to support trends like electric vehicle production and lightweighting. For instance, an automotive supplier producing battery enclosures must invest in automated press brakes and robotic welding systems to meet stringent quality standards while managing high-volume output.
  • This shift toward smart factory solutions, which integrate CAD/CAM software and CNC controls, is a direct response to the persistent skilled labor shortage. However, the high capital investment required for such technology, coupled with supply chain volatility, presents considerable challenges for small and medium-sized enterprises seeking to upgrade their capabilities.

What will be the Size of the Sheet Metal Processing Equipment Market during the forecast period?

Get Key Insights on Market Forecast (PDF) Request Free Sample

How is the Sheet Metal Processing Equipment Market Segmented?

The sheet metal processing equipment industry research report provides comprehensive data (region-wise segment analysis), with forecasts and estimates in "USD million" for the period 2026-2030, as well as historical data from 2020-2024 for the following segments.
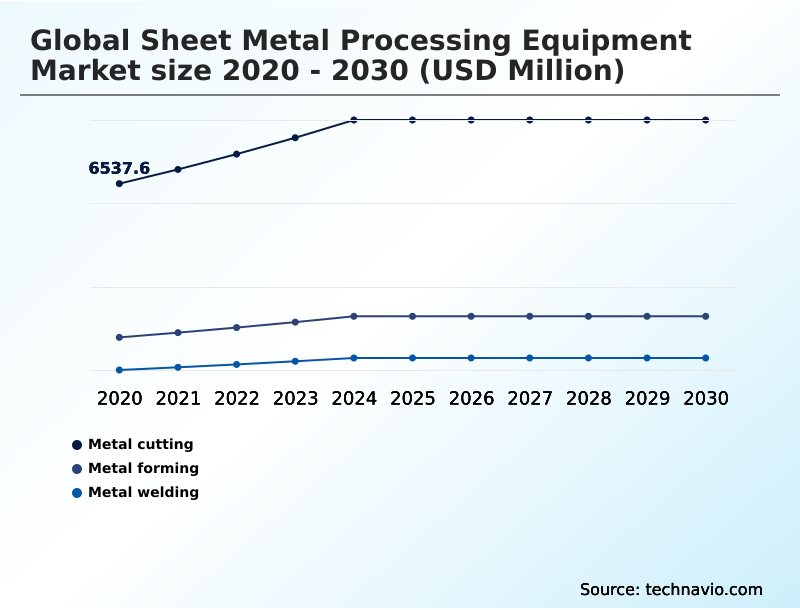
  • Application
    • Metal cutting
    • Metal forming
    • Metal welding
  • End-user
    • Automotive
    • Construction
    • Aerospace
    • Electronics
    • Others
  • Type
    • Manual
    • Automatic
  • Geography
    • APAC
      • China
      • Japan
      • South Korea
    • Europe
      • Germany
      • France
      • Italy
    • North America
      • US
      • Canada
      • Mexico
    • Middle East and Africa
      • South Africa
      • UAE
      • Saudi Arabia
    • South America
      • Brazil
      • Argentina
    • Rest of World (ROW)

By Application Insights

The metal cutting segment is estimated to witness significant growth during the forecast period.

The market is segmented by application, with metal cutting being a critical area defined by constant innovation. While plasma cutting systems and waterjet cutting technology serve specific niches, the segment is dominated by laser-based solutions that enhance precision component manufacturing.

The drive for efficiency in advanced material processing, particularly for electric vehicle component production, has led to systems that achieve cutting speeds up to 30% faster than previous generations. This pursuit of speed is also seen in high-speed punching machines.

Modern equipment increasingly incorporates real-time process monitoring and energy-saving servo-electric drives, supporting both high-volume production of HVAC system components and the sophisticated demands of lights-out production environments.

Request Free Sample

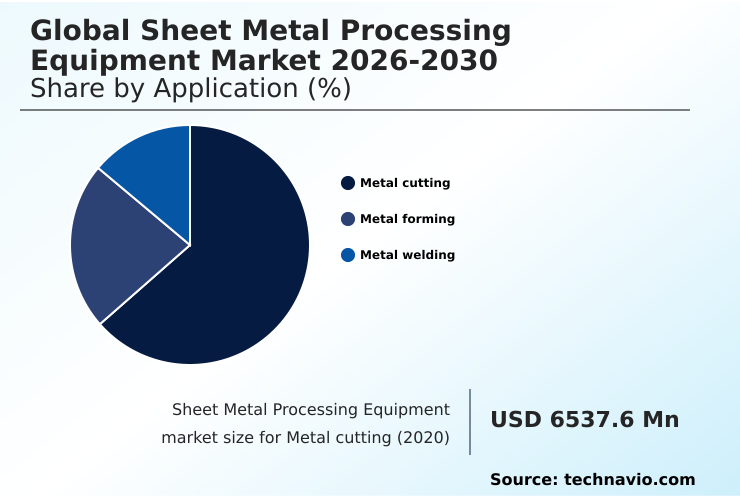
The Metal cutting segment was valued at USD 8.28 billion in 2024 and showed a gradual increase during the forecast period.

Request Free Sample

Regional Analysis

APAC is estimated to contribute 58.3% to the growth of the global market during the forecast period.Technavio’s analysts have elaborately explained the regional trends and drivers that shape the market during the forecast period.

See How Sheet Metal Processing Equipment Market Demand is Rising in APAC Request Free Sample

The geographic landscape is dominated by the APAC region, which is projected to contribute over 58% of the market's incremental growth, driven by its massive manufacturing base for data center infrastructure and structural steel fabrication.

This region is a hotbed for adopting integrated punching and bending systems.

Meanwhile, North America is seeing a surge in investment due to reshoring trends, with over 71% of manufacturers citing labor shortages as a primary challenge, fueling demand for automation in aerospace component manufacturing and architectural metalwork.

Europe remains a hub for advanced technologies like hot stamping technology and multi-axis laser processing. In contrast, emerging markets are investing in heavy-duty equipment, exploring hydroforming processes as cost-effective giga-casting alternatives for automotive and industrial applications.

Market Dynamics

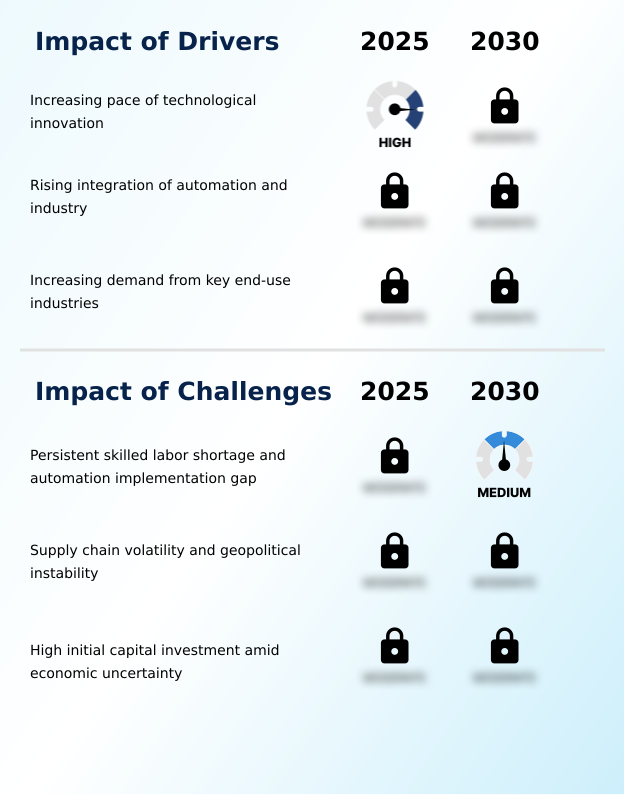
Our researchers analyzed the data with 2025 as the base year, along with the key drivers, trends, and challenges. A holistic analysis of drivers will help companies refine their marketing strategies to gain a competitive advantage.

  • Strategic decision-making in the industry now centers on specialized applications and process optimization. For instance, the selection of high power laser cutting for thick materials is driven by the need to increase throughput in heavy industry, while automating press brakes for small batches provides the flexibility required by job shops.
  • For complex assemblies, improving weld quality with robotic systems has become a standard for ensuring consistency. In automotive, the debate over automotive giga-casting vs sheet metal assembly is pushing innovation in hot stamping technology for automotive lightweighting and processing high-strength steel for electric vehicles.
  • Sustainability is also a key factor, with firms adopting servo-electric press brake energy savings and using advanced nesting software to reduce scrap. Integrated systems for lights-out production are transforming factory floors through automated material handling in fabrication and collaborative robots in metal fabrication. The use of digital twin simulation for press brakes allows for offline programming, significantly reducing setup times.
  • For quality assurance, real-time monitoring for quality control is indispensable, especially for precision fabrication for aerospace components and high-volume data center rack manufacturing. These targeted solutions collectively focus on reducing cycle times in metal forming and delivering sustainable and energy-efficient processing across all applications.
  • These integrated approaches have shown to improve on-time delivery rates by a notable margin compared to siloed operational structures.

What are the key market drivers leading to the rise in the adoption of Sheet Metal Processing Equipment Industry?

  • The increasing pace of technological innovation is a primary driver for the market, enabling unprecedented levels of productivity, precision, and efficiency.

  • The market is driven by industry 4.0 integration and the push for smart factory solutions. Advanced CAD/CAM software solutions and seamless CNC controls integration are fundamental to achieving the precision required for electric vehicle component production and lightweighting in automotive.
  • The use of digital twin simulations allows fabricators to optimize processes before production, with some achieving a 25% reduction in processing time for new parts.
  • Flexible manufacturing systems equipped with automated tool changing offer unparalleled agility, while enhanced predictive maintenance capabilities help improve forecast accuracy by 18% for scheduling downtime.
  • This technological drive is essential for manufacturers seeking to enhance their production ecosystems and operational effectiveness.

What are the market trends shaping the Sheet Metal Processing Equipment Industry?

  • The rapid proliferation of high-power fiber laser cutting machines is a dominant and accelerating trend. This development enhances productivity by enabling faster cutting speeds and processing of thicker materials.

  • Key trends in the sheet metal fabrication industry are pushing toward higher efficiency and sustainability. The proliferation of high-power fiber lasers and automated press brakes facilitates high-precision fabrication, while integrated robotic bending cells are enabling true lights-out manufacturing environments.
  • These systems are increasingly designed as energy-efficient equipment, with some companies reporting energy use lowered by 12% compared to older hydraulic systems. Furthermore, the adoption of advanced nesting software for material optimization directly supports sustainable manufacturing practices and contributes to reduced operational costs.
  • This focus on intelligent automation has been shown to reduce machine downtime by up to 30% in integrated setups.

What challenges does the Sheet Metal Processing Equipment Industry face during its growth?

  • A persistent skilled labor shortage and a gap in automation implementation represent a significant challenge confronting the industry's growth trajectory.

  • Addressing the skilled labor gap through automation remains a primary challenge, driving investment in automated sorting systems and robotic welding systems. The integration of collaborative robots (cobots) and advanced machine vision systems is becoming critical, especially as reshoring manufacturing initiatives increase demand for high-strength steel processing and aluminum alloy fabrication.
  • Implementing automated material handling can reduce labor costs by over 20% in high-volume settings. However, ensuring supply chain resilience for these sophisticated components is a persistent concern. These technologies directly combat workforce deficits by taking over repetitive tasks, with robotic systems capable of lowering error rates by up to 40% compared to manual operations.

Exclusive Technavio Analysis on Customer Landscape

The sheet metal processing equipment market forecasting report includes the adoption lifecycle of the market, covering from the innovator’s stage to the laggard’s stage. It focuses on adoption rates in different regions based on penetration. Furthermore, the sheet metal processing equipment market report also includes key purchase criteria and drivers of price sensitivity to help companies evaluate and develop their market growth analysis strategies.

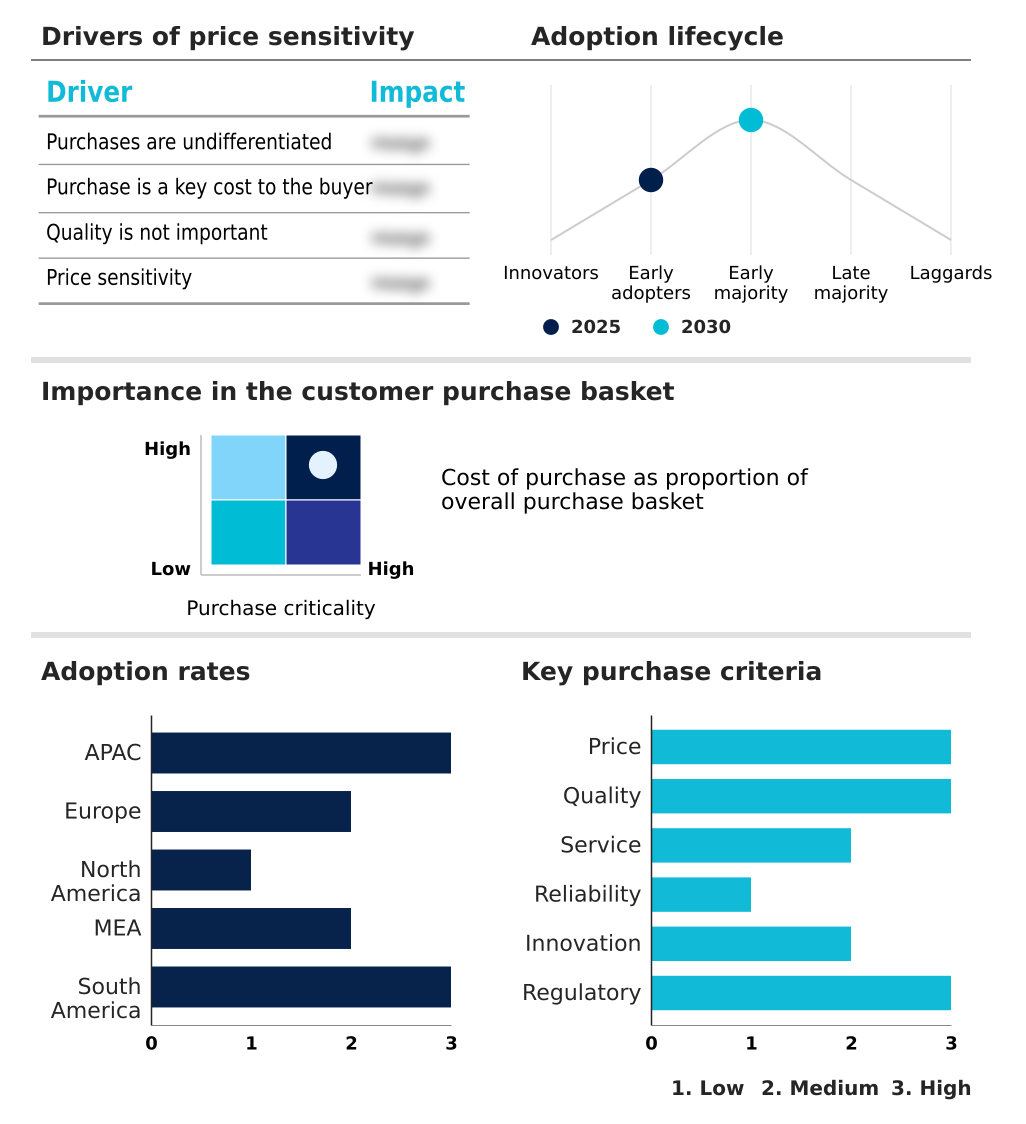
Customer Landscape of Sheet Metal Processing Equipment Industry

Competitive Landscape

Companies are implementing various strategies, such as strategic alliances, sheet metal processing equipment market forecast, partnerships, mergers and acquisitions, geographical expansion, and product/service launches, to enhance their presence in the industry.

Bodor Laser - Offerings center on high-precision laser cutting machines, providing advanced and automated solutions for complex metal cutting and fabrication requirements in the industrial sector.

The industry research and growth report includes detailed analyses of the competitive landscape of the market and information about key companies, including:

  • Bodor Laser
  • Bystronic Laser AG
  • Coherent Corp.
  • Dallan SpA
  • DANOBAT S. Coop.
  • Haas Automation Inc.
  • Haco NV
  • Jier North America Inc.
  • Komatsu India Pvt. Ltd.
  • LVD Co. nv
  • Maanshan Durmapress Co. Ltd
  • Mazak Optonics Corp.
  • Mitsubishi Electric Corp.
  • Murata Machinery Ltd.
  • Nukon Bulgaria ltd.
  • PRIMA POWER SEA CO LTD.
  • Salvagnini Italia SPA
  • SCM GROUP Spa
  • TRUMPF SE Co. KG
  • Wilson Tool International

Qualitative and quantitative analysis of companies has been conducted to help clients understand the wider business environment as well as the strengths and weaknesses of key industry players. Data is qualitatively analyzed to categorize companies as pure play, category-focused, industry-focused, and diversified; it is quantitatively analyzed to categorize companies as dominant, leading, strong, tentative, and weak.

Recent Development and News in Sheet metal processing equipment market

  • In August 2024, Bodor Laser launched its new L Series of large-format machines, designed to integrate more power for precision in cutting demanding materials like structural steel.
  • In November 2024, AMADA unveiled its next-generation Regius series fiber laser cutting machine, which incorporates artificial intelligence to optimize the cutting path and reduce processing time.
  • In December 2024, Prima Power acquired Sistec AM, a provider of robotic and customized industrial automation systems, to expand its automation capabilities and integrated technology portfolio.
  • In May 2025, Bodor Laser showcased its laser technology at the FEIMEC industrial exhibition in Sao Paulo, demonstrating its strategic focus on the expanding South American manufacturing market.

Dive into Technavio’s robust research methodology, blending expert interviews, extensive data synthesis, and validated models for unparalleled Sheet Metal Processing Equipment Market insights. See full methodology.

Market Scope
Page number 299
Base year 2025
Historic period 2020-2024
Forecast period 2026-2030
Growth momentum & CAGR Accelerate at a CAGR of 6.7%
Market growth 2026-2030 USD 5226.5 million
Market structure Fragmented
YoY growth 2025-2026(%) 6.3%
Key countries China, Japan, South Korea, India, Australia, Indonesia, Germany, France, Italy, UK, Spain, The Netherlands, US, Canada, Mexico, South Africa, UAE, Saudi Arabia, Egypt, Turkey, Brazil, Argentina and Chile
Competitive landscape Leading Companies, Market Positioning of Companies, Competitive Strategies, and Industry Risks

Request Free Sample

Research Analyst Overview

  • From a research perspective, the sheet metal processing equipment market’s evolution is defined by the integration of intelligent and automated technologies. The industry is rapidly moving beyond standalone machines toward flexible manufacturing systems that incorporate robotic bending cells and automated sorting systems for lights-out manufacturing.
  • The push for higher productivity is evident in the adoption of high-power fiber lasers and high-speed punching machines, which have demonstrated the ability to reduce cycle times by over 30%. Key technologies like hot stamping technology and hydroforming processes are becoming crucial, offering giga-casting alternatives in automotive applications.
  • Advanced systems feature CNC controls integration with CAD/CAM software solutions and digital twin simulations for process optimization. Innovations in automated tool changing, multi-axis laser processing, and integrated punching and bending are enhancing machine versatility. Meanwhile, servo-electric drives are replacing less efficient systems, and the use of collaborative robots (cobots), machine vision systems, and robotic welding systems is addressing labor gaps.
  • Advanced nesting software and real-time process monitoring are standard for maximizing material use, while plasma cutting systems and waterjet cutting technology serve specialized needs alongside automated material handling.

What are the Key Data Covered in this Sheet Metal Processing Equipment Market Research and Growth Report?

  • What is the expected growth of the Sheet Metal Processing Equipment Market between 2026 and 2030?

    • USD 5.23 billion, at a CAGR of 6.7%

  • What segmentation does the market report cover?

    • The report is segmented by Application (Metal cutting, Metal forming, and Metal welding), End-user (Automotive, Construction, Aerospace, Electronics, and Others), Type (Manual, and Automatic) and Geography (APAC, Europe, North America, Middle East and Africa, South America)

  • Which regions are analyzed in the report?

    • APAC, Europe, North America, Middle East and Africa and South America

  • What are the key growth drivers and market challenges?

    • Increasing pace of technological innovation, Persistent skilled labor shortage and automation implementation gap

  • Who are the major players in the Sheet Metal Processing Equipment Market?

    • Bodor Laser, Bystronic Laser AG, Coherent Corp., Dallan SpA, DANOBAT S. Coop., Haas Automation Inc., Haco NV, Jier North America Inc., Komatsu India Pvt. Ltd., LVD Co. nv, Maanshan Durmapress Co. Ltd, Mazak Optonics Corp., Mitsubishi Electric Corp., Murata Machinery Ltd., Nukon Bulgaria ltd., PRIMA POWER SEA CO LTD., Salvagnini Italia SPA, SCM GROUP Spa, TRUMPF SE Co. KG and Wilson Tool International

Market Research Insights

  • Market dynamics are shaped by the strategic shift toward smart factory solutions and advanced material processing to enhance supply chain resilience. The need for high-precision fabrication in sectors like aerospace component manufacturing and electric vehicle component production is driving investment in energy-efficient equipment. Companies adopting these technologies report a 15% improvement in operational efficiency.
  • Furthermore, the push for reshoring manufacturing and sustainable manufacturing practices is compelling businesses to adopt automation to address the skilled labor gap, which has led to a 20% reduction in labor-related costs in some automated facilities. This transition is critical for producing components for data center infrastructure and architectural metalwork while maintaining a competitive edge.

We can help! Our analysts can customize this sheet metal processing equipment market research report to meet your requirements.

Get in touch

1. Executive Summary

1.1 Market overview

Executive Summary - Chart on Market Overview
Executive Summary - Data Table on Market Overview
Executive Summary - Chart on Global Market Characteristics
Executive Summary - Chart on Market by Geography
Executive Summary - Chart on Market Segmentation by Application
Executive Summary - Chart on Market Segmentation by End-user
Executive Summary - Chart on Market Segmentation by Type
Executive Summary - Chart on Incremental Growth
Executive Summary - Data Table on Incremental Growth
Executive Summary - Chart on Company Market Positioning

2. Technavio Analysis

2.1 Analysis of price sensitivity, lifecycle, customer purchase basket, adoption rates, and purchase criteria

2.2 Criticality of inputs and Factors of differentiation

Chart on Overview on criticality of inputs and factors of differentiation

2.3 Factors of disruption

Chart on Overview on factors of disruption

2.4 Impact of drivers and challenges

Chart on Impact of drivers and challenges in 2025 and 2030

3. Market Landscape

3.1 Market ecosystem

Chart on Parent Market
Data Table on - Parent Market

3.2 Market characteristics

Chart on Market characteristics analysis

3.3 Value chain analysis

Chart on Value chain analysis

4. Market Sizing

4.1 Market definition

Data Table on Offerings of companies included in the market definition

4.2 Market segment analysis

Market segments

4.3 Market size 2025

4.4 Market outlook: Forecast for 2025-2030

Chart on Global - Market size and forecast 2025-2030 ($ million)
Data Table on Global - Market size and forecast 2025-2030 ($ million)
Chart on Global Market: Year-over-year growth 2025-2030 (%)
Data Table on Global Market: Year-over-year growth 2025-2030 (%)

5. Historic Market Size

5.1 Global Sheet Metal Processing Equipment Market 2020 - 2024

Historic Market Size - Data Table on Global Sheet Metal Processing Equipment Market 2020 - 2024 ($ million)

5.2 Application segment analysis 2020 - 2024

Historic Market Size - Application Segment 2020 - 2024 ($ million)

5.3 End-user segment analysis 2020 - 2024

Historic Market Size - End-user Segment 2020 - 2024 ($ million)

5.4 Type segment analysis 2020 - 2024

Historic Market Size - Type Segment 2020 - 2024 ($ million)

5.5 Geography segment analysis 2020 - 2024

Historic Market Size - Geography Segment 2020 - 2024 ($ million)

5.6 Country segment analysis 2020 - 2024

Historic Market Size - Country Segment 2020 - 2024 ($ million)

6. Qualitative Analysis

6.1 Impact of AI in the Global Sheet Metal Processing Equipment Market

7. Five Forces Analysis

7.1 Five forces summary

Five forces analysis - Comparison between 2025 and 2030

7.2 Bargaining power of buyers

Bargaining power of buyers - Impact of key factors 2025 and 2030

7.3 Bargaining power of suppliers

Bargaining power of suppliers - Impact of key factors in 2025 and 2030

7.4 Threat of new entrants

Threat of new entrants - Impact of key factors in 2025 and 2030

7.5 Threat of substitutes

Threat of substitutes - Impact of key factors in 2025 and 2030

7.6 Threat of rivalry

Threat of rivalry - Impact of key factors in 2025 and 2030

7.7 Market condition

Chart on Market condition - Five forces 2025 and 2030

8. Market Segmentation by Application

8.1 Market segments

Chart on Application - Market share 2025-2030 (%)
Data Table on Application - Market share 2025-2030 (%)

8.2 Comparison by Application

Chart on Comparison by Application
Data Table on Comparison by Application

8.3 Metal cutting - Market size and forecast 2025-2030

Chart on Metal cutting - Market size and forecast 2025-2030 ($ million)
Data Table on Metal cutting - Market size and forecast 2025-2030 ($ million)
Chart on Metal cutting - Year-over-year growth 2025-2030 (%)
Data Table on Metal cutting - Year-over-year growth 2025-2030 (%)

8.4 Metal forming - Market size and forecast 2025-2030

Chart on Metal forming - Market size and forecast 2025-2030 ($ million)
Data Table on Metal forming - Market size and forecast 2025-2030 ($ million)
Chart on Metal forming - Year-over-year growth 2025-2030 (%)
Data Table on Metal forming - Year-over-year growth 2025-2030 (%)

8.5 Metal welding - Market size and forecast 2025-2030

Chart on Metal welding - Market size and forecast 2025-2030 ($ million)
Data Table on Metal welding - Market size and forecast 2025-2030 ($ million)
Chart on Metal welding - Year-over-year growth 2025-2030 (%)
Data Table on Metal welding - Year-over-year growth 2025-2030 (%)

8.6 Market opportunity by Application

Market opportunity by Application ($ million)
Data Table on Market opportunity by Application ($ million)

9. Market Segmentation by End-user

9.1 Market segments

Chart on End-user - Market share 2025-2030 (%)
Data Table on End-user - Market share 2025-2030 (%)

9.2 Comparison by End-user

Chart on Comparison by End-user
Data Table on Comparison by End-user

9.3 Automotive - Market size and forecast 2025-2030

Chart on Automotive - Market size and forecast 2025-2030 ($ million)
Data Table on Automotive - Market size and forecast 2025-2030 ($ million)
Chart on Automotive - Year-over-year growth 2025-2030 (%)
Data Table on Automotive - Year-over-year growth 2025-2030 (%)

9.4 Construction - Market size and forecast 2025-2030

Chart on Construction - Market size and forecast 2025-2030 ($ million)
Data Table on Construction - Market size and forecast 2025-2030 ($ million)
Chart on Construction - Year-over-year growth 2025-2030 (%)
Data Table on Construction - Year-over-year growth 2025-2030 (%)

9.5 Aerospace - Market size and forecast 2025-2030

Chart on Aerospace - Market size and forecast 2025-2030 ($ million)
Data Table on Aerospace - Market size and forecast 2025-2030 ($ million)
Chart on Aerospace - Year-over-year growth 2025-2030 (%)
Data Table on Aerospace - Year-over-year growth 2025-2030 (%)

9.6 Electronics - Market size and forecast 2025-2030

Chart on Electronics - Market size and forecast 2025-2030 ($ million)
Data Table on Electronics - Market size and forecast 2025-2030 ($ million)
Chart on Electronics - Year-over-year growth 2025-2030 (%)
Data Table on Electronics - Year-over-year growth 2025-2030 (%)

9.7 Others - Market size and forecast 2025-2030

Chart on Others - Market size and forecast 2025-2030 ($ million)
Data Table on Others - Market size and forecast 2025-2030 ($ million)
Chart on Others - Year-over-year growth 2025-2030 (%)
Data Table on Others - Year-over-year growth 2025-2030 (%)

9.8 Market opportunity by End-user

Market opportunity by End-user ($ million)
Data Table on Market opportunity by End-user ($ million)

10. Market Segmentation by Type

10.1 Market segments

Chart on Type - Market share 2025-2030 (%)
Data Table on Type - Market share 2025-2030 (%)

10.2 Comparison by Type

Chart on Comparison by Type
Data Table on Comparison by Type

10.3 Manual - Market size and forecast 2025-2030

Chart on Manual - Market size and forecast 2025-2030 ($ million)
Data Table on Manual - Market size and forecast 2025-2030 ($ million)
Chart on Manual - Year-over-year growth 2025-2030 (%)
Data Table on Manual - Year-over-year growth 2025-2030 (%)

10.4 Automatic - Market size and forecast 2025-2030

Chart on Automatic - Market size and forecast 2025-2030 ($ million)
Data Table on Automatic - Market size and forecast 2025-2030 ($ million)
Chart on Automatic - Year-over-year growth 2025-2030 (%)
Data Table on Automatic - Year-over-year growth 2025-2030 (%)

10.5 Market opportunity by Type

Market opportunity by Type ($ million)
Data Table on Market opportunity by Type ($ million)

11. Customer Landscape

11.1 Customer landscape overview

Analysis of price sensitivity, lifecycle, customer purchase basket, adoption rates, and purchase criteria

12. Geographic Landscape

12.1 Geographic segmentation

Chart on Market share by geography 2025-2030 (%)
Data Table on Market share by geography 2025-2030 (%)

12.2 Geographic comparison

Chart on Geographic comparison
Data Table on Geographic comparison

12.3 APAC - Market size and forecast 2025-2030

Chart on APAC - Market size and forecast 2025-2030 ($ million)
Data Table on APAC - Market size and forecast 2025-2030 ($ million)
Chart on APAC - Year-over-year growth 2025-2030 (%)
Data Table on APAC - Year-over-year growth 2025-2030 (%)
Chart on Regional Comparison - APAC
Data Table on Regional Comparison - APAC

12.3.1 China - Market size and forecast 2025-2030

Chart on China - Market size and forecast 2025-2030 ($ million)
Data Table on China - Market size and forecast 2025-2030 ($ million)
Chart on China - Year-over-year growth 2025-2030 (%)
Data Table on China - Year-over-year growth 2025-2030 (%)

12.3.2 Japan - Market size and forecast 2025-2030

Chart on Japan - Market size and forecast 2025-2030 ($ million)
Data Table on Japan - Market size and forecast 2025-2030 ($ million)
Chart on Japan - Year-over-year growth 2025-2030 (%)
Data Table on Japan - Year-over-year growth 2025-2030 (%)

12.3.3 South Korea - Market size and forecast 2025-2030

Chart on South Korea - Market size and forecast 2025-2030 ($ million)
Data Table on South Korea - Market size and forecast 2025-2030 ($ million)
Chart on South Korea - Year-over-year growth 2025-2030 (%)
Data Table on South Korea - Year-over-year growth 2025-2030 (%)

12.3.4 India - Market size and forecast 2025-2030

Chart on India - Market size and forecast 2025-2030 ($ million)
Data Table on India - Market size and forecast 2025-2030 ($ million)
Chart on India - Year-over-year growth 2025-2030 (%)
Data Table on India - Year-over-year growth 2025-2030 (%)

12.3.5 Australia - Market size and forecast 2025-2030

Chart on Australia - Market size and forecast 2025-2030 ($ million)
Data Table on Australia - Market size and forecast 2025-2030 ($ million)
Chart on Australia - Year-over-year growth 2025-2030 (%)
Data Table on Australia - Year-over-year growth 2025-2030 (%)

12.3.6 Indonesia - Market size and forecast 2025-2030

Chart on Indonesia - Market size and forecast 2025-2030 ($ million)
Data Table on Indonesia - Market size and forecast 2025-2030 ($ million)
Chart on Indonesia - Year-over-year growth 2025-2030 (%)
Data Table on Indonesia - Year-over-year growth 2025-2030 (%)

12.4 Europe - Market size and forecast 2025-2030

Chart on Europe - Market size and forecast 2025-2030 ($ million)
Data Table on Europe - Market size and forecast 2025-2030 ($ million)
Chart on Europe - Year-over-year growth 2025-2030 (%)
Data Table on Europe - Year-over-year growth 2025-2030 (%)
Chart on Regional Comparison - Europe
Data Table on Regional Comparison - Europe

12.4.1 Germany - Market size and forecast 2025-2030

Chart on Germany - Market size and forecast 2025-2030 ($ million)
Data Table on Germany - Market size and forecast 2025-2030 ($ million)
Chart on Germany - Year-over-year growth 2025-2030 (%)
Data Table on Germany - Year-over-year growth 2025-2030 (%)

12.4.2 France - Market size and forecast 2025-2030

Chart on France - Market size and forecast 2025-2030 ($ million)
Data Table on France - Market size and forecast 2025-2030 ($ million)
Chart on France - Year-over-year growth 2025-2030 (%)
Data Table on France - Year-over-year growth 2025-2030 (%)

12.4.3 Italy - Market size and forecast 2025-2030

Chart on Italy - Market size and forecast 2025-2030 ($ million)
Data Table on Italy - Market size and forecast 2025-2030 ($ million)
Chart on Italy - Year-over-year growth 2025-2030 (%)
Data Table on Italy - Year-over-year growth 2025-2030 (%)

12.4.4 UK - Market size and forecast 2025-2030

Chart on UK - Market size and forecast 2025-2030 ($ million)
Data Table on UK - Market size and forecast 2025-2030 ($ million)
Chart on UK - Year-over-year growth 2025-2030 (%)
Data Table on UK - Year-over-year growth 2025-2030 (%)

12.4.5 Spain - Market size and forecast 2025-2030

Chart on Spain - Market size and forecast 2025-2030 ($ million)
Data Table on Spain - Market size and forecast 2025-2030 ($ million)
Chart on Spain - Year-over-year growth 2025-2030 (%)
Data Table on Spain - Year-over-year growth 2025-2030 (%)

12.4.6 The Netherlands - Market size and forecast 2025-2030

Chart on The Netherlands - Market size and forecast 2025-2030 ($ million)
Data Table on The Netherlands - Market size and forecast 2025-2030 ($ million)
Chart on The Netherlands - Year-over-year growth 2025-2030 (%)
Data Table on The Netherlands - Year-over-year growth 2025-2030 (%)

12.5 North America - Market size and forecast 2025-2030

Chart on North America - Market size and forecast 2025-2030 ($ million)
Data Table on North America - Market size and forecast 2025-2030 ($ million)
Chart on North America - Year-over-year growth 2025-2030 (%)
Data Table on North America - Year-over-year growth 2025-2030 (%)
Chart on Regional Comparison - North America
Data Table on Regional Comparison - North America

12.5.1 US - Market size and forecast 2025-2030

Chart on US - Market size and forecast 2025-2030 ($ million)
Data Table on US - Market size and forecast 2025-2030 ($ million)
Chart on US - Year-over-year growth 2025-2030 (%)
Data Table on US - Year-over-year growth 2025-2030 (%)

12.5.2 Canada - Market size and forecast 2025-2030

Chart on Canada - Market size and forecast 2025-2030 ($ million)
Data Table on Canada - Market size and forecast 2025-2030 ($ million)
Chart on Canada - Year-over-year growth 2025-2030 (%)
Data Table on Canada - Year-over-year growth 2025-2030 (%)

12.5.3 Mexico - Market size and forecast 2025-2030

Chart on Mexico - Market size and forecast 2025-2030 ($ million)
Data Table on Mexico - Market size and forecast 2025-2030 ($ million)
Chart on Mexico - Year-over-year growth 2025-2030 (%)
Data Table on Mexico - Year-over-year growth 2025-2030 (%)

12.6 Middle East and Africa - Market size and forecast 2025-2030

Chart on Middle East and Africa - Market size and forecast 2025-2030 ($ million)
Data Table on Middle East and Africa - Market size and forecast 2025-2030 ($ million)
Chart on Middle East and Africa - Year-over-year growth 2025-2030 (%)
Data Table on Middle East and Africa - Year-over-year growth 2025-2030 (%)
Chart on Regional Comparison - Middle East and Africa
Data Table on Regional Comparison - Middle East and Africa

12.6.1 South Africa - Market size and forecast 2025-2030

Chart on South Africa - Market size and forecast 2025-2030 ($ million)
Data Table on South Africa - Market size and forecast 2025-2030 ($ million)
Chart on South Africa - Year-over-year growth 2025-2030 (%)
Data Table on South Africa - Year-over-year growth 2025-2030 (%)

12.6.2 UAE - Market size and forecast 2025-2030

Chart on UAE - Market size and forecast 2025-2030 ($ million)
Data Table on UAE - Market size and forecast 2025-2030 ($ million)
Chart on UAE - Year-over-year growth 2025-2030 (%)
Data Table on UAE - Year-over-year growth 2025-2030 (%)

12.6.3 Saudi Arabia - Market size and forecast 2025-2030

Chart on Saudi Arabia - Market size and forecast 2025-2030 ($ million)
Data Table on Saudi Arabia - Market size and forecast 2025-2030 ($ million)
Chart on Saudi Arabia - Year-over-year growth 2025-2030 (%)
Data Table on Saudi Arabia - Year-over-year growth 2025-2030 (%)

12.6.4 Egypt - Market size and forecast 2025-2030

Chart on Egypt - Market size and forecast 2025-2030 ($ million)
Data Table on Egypt - Market size and forecast 2025-2030 ($ million)
Chart on Egypt - Year-over-year growth 2025-2030 (%)
Data Table on Egypt - Year-over-year growth 2025-2030 (%)

12.6.5 Turkey - Market size and forecast 2025-2030

Chart on Turkey - Market size and forecast 2025-2030 ($ million)
Data Table on Turkey - Market size and forecast 2025-2030 ($ million)
Chart on Turkey - Year-over-year growth 2025-2030 (%)
Data Table on Turkey - Year-over-year growth 2025-2030 (%)

12.7 South America - Market size and forecast 2025-2030

Chart on South America - Market size and forecast 2025-2030 ($ million)
Data Table on South America - Market size and forecast 2025-2030 ($ million)
Chart on South America - Year-over-year growth 2025-2030 (%)
Data Table on South America - Year-over-year growth 2025-2030 (%)
Chart on Regional Comparison - South America
Data Table on Regional Comparison - South America

12.7.1 Brazil - Market size and forecast 2025-2030

Chart on Brazil - Market size and forecast 2025-2030 ($ million)
Data Table on Brazil - Market size and forecast 2025-2030 ($ million)
Chart on Brazil - Year-over-year growth 2025-2030 (%)
Data Table on Brazil - Year-over-year growth 2025-2030 (%)

12.7.2 Argentina - Market size and forecast 2025-2030

Chart on Argentina - Market size and forecast 2025-2030 ($ million)
Data Table on Argentina - Market size and forecast 2025-2030 ($ million)
Chart on Argentina - Year-over-year growth 2025-2030 (%)
Data Table on Argentina - Year-over-year growth 2025-2030 (%)

12.7.3 Chile - Market size and forecast 2025-2030

Chart on Chile - Market size and forecast 2025-2030 ($ million)
Data Table on Chile - Market size and forecast 2025-2030 ($ million)
Chart on Chile - Year-over-year growth 2025-2030 (%)
Data Table on Chile - Year-over-year growth 2025-2030 (%)

12.8 Market opportunity by geography

Market opportunity by geography ($ million)
Data Tables on Market opportunity by geography ($ million)

13. Drivers, Challenges, and Opportunity

13.1 Market drivers

Increasing pace of technological innovation
Rising integration of automation and industry
Increasing demand from key end-use industries

13.2 Market challenges

Persistent skilled labor shortage and automation implementation gap
Supply chain volatility and geopolitical instability
High initial capital investment amid economic uncertainty

13.3 Impact of drivers and challenges

Impact of drivers and challenges in 2025 and 2030

13.4 Market opportunities

Proliferation of high-power fiber lasers
Shift towards integrated and automated systems
Growing emphasis on sustainability and energy efficiency

14. Competitive Landscape

14.1 Overview

14.2

Overview on criticality of inputs and factors of differentiation

14.3 Landscape disruption

Overview on factors of disruption

14.4 Industry risks

Impact of key risks on business

15. Competitive Analysis

15.1 Companies profiled

Companies covered

15.2 Company ranking index

15.3 Market positioning of companies

Matrix on companies position and classification

15.4 Bodor Laser

Bodor Laser - Overview
Bodor Laser - Product / Service
Bodor Laser - Key offerings
SWOT

15.5 Bystronic Laser AG

Bystronic Laser AG - Overview
Bystronic Laser AG - Product / Service
Bystronic Laser AG - Key offerings
SWOT

15.6 Coherent Corp.

Coherent Corp. - Overview
Coherent Corp. - Business segments
Coherent Corp. - Key news
Coherent Corp. - Key offerings
Coherent Corp. - Segment focus
SWOT

15.7 Dallan SpA

Dallan SpA - Overview
Dallan SpA - Product / Service
Dallan SpA - Key offerings
SWOT

15.8 DANOBAT S. Coop.

DANOBAT S. Coop. - Overview
DANOBAT S. Coop. - Product / Service
DANOBAT S. Coop. - Key offerings
SWOT

15.9 Haas Automation Inc.

Haas Automation Inc. - Overview
Haas Automation Inc. - Product / Service
Haas Automation Inc. - Key offerings
SWOT

15.10 Haco NV

Haco NV - Overview
Haco NV - Product / Service
Haco NV - Key offerings
SWOT

15.11 Jier North America Inc.

Jier North America Inc. - Overview
Jier North America Inc. - Product / Service
Jier North America Inc. - Key offerings
SWOT

15.12 Komatsu India Pvt. Ltd.

Komatsu India Pvt. Ltd. - Overview
Komatsu India Pvt. Ltd. - Product / Service
Komatsu India Pvt. Ltd. - Key offerings
SWOT

15.13 LVD Co. nv

LVD Co. nv - Overview
LVD Co. nv - Product / Service
LVD Co. nv - Key offerings
SWOT

15.14 Maanshan Durmapress Co. Ltd

Maanshan Durmapress Co. Ltd - Overview
Maanshan Durmapress Co. Ltd - Product / Service
Maanshan Durmapress Co. Ltd - Key offerings
SWOT

15.15 Mazak Optonics Corp.

Mazak Optonics Corp. - Overview
Mazak Optonics Corp. - Product / Service
Mazak Optonics Corp. - Key offerings
SWOT

15.16 Mitsubishi Electric Corp.

Mitsubishi Electric Corp. - Overview
Mitsubishi Electric Corp. - Business segments
Mitsubishi Electric Corp. - Key offerings
Mitsubishi Electric Corp. - Segment focus
SWOT

15.17 Murata Machinery Ltd.

Murata Machinery Ltd. - Overview
Murata Machinery Ltd. - Business segments
Murata Machinery Ltd. - Key news
Murata Machinery Ltd. - Key offerings
Murata Machinery Ltd. - Segment focus
SWOT

15.18 TRUMPF SE Co. KG

TRUMPF SE Co. KG - Overview
TRUMPF SE Co. KG - Product / Service
TRUMPF SE Co. KG - Key offerings
SWOT

16. Appendix

16.1 Scope of the report

Market definition
Objectives
Notes and caveats

16.2 Inclusions and exclusions checklist

Inclusions checklist
Exclusions checklist

16.3 Currency conversion rates for US$

16.4 Research methodology

16.5 Data procurement

Information sources

16.6 Data validation

16.7 Validation techniques employed for market sizing

16.8 Data synthesis

16.9 360 degree market analysis

16.10 List of abbreviations

Research Methodology

Technavio presents a detailed picture of the market by way of study, synthesis, and summation of data from multiple sources. The analysts have presented the various facets of the market with a particular focus on identifying the key industry influencers. The data thus presented is comprehensive, reliable, and the result of extensive research, both primary and secondary.

INFORMATION SOURCES

Primary sources

  • Manufacturers and suppliers
  • Channel partners
  • Industry experts
  • Strategic decision makers

Secondary sources

  • Industry journals and periodicals
  • Government data
  • Financial reports of key industry players
  • Historical data
  • Press releases

DATA ANALYSIS

Data Synthesis

  • Collation of data
  • Estimation of key figures
  • Analysis of derived insights

Data Validation

  • Triangulation with data models
  • Reference against proprietary databases
  • Corroboration with industry experts

REPORT WRITING

Qualitative

  • Market drivers
  • Market challenges
  • Market trends
  • Five forces analysis

Quantitative

  • Market size and forecast
  • Market segmentation
  • Geographical insights
  • Competitive landscape

Interested in this report?

Get your sample now to see our research methodology and insights!

Download Now

Frequently Asked Questions

Sheet Metal Processing Equipment market growth will increase by USD 5226.5 million during 2026-2030 .

The Sheet Metal Processing Equipment market is expected to grow at a CAGR of 6.7% during 2026-2030 .

Sheet Metal Processing Equipment market is segmented by Application (Metal cutting, Metal forming, Metal welding) End-user (Automotive, Construction, Aerospace, Electronics, Others) Type (Manual, Automatic)

Bodor Laser, Bystronic Laser AG, Coherent Corp., Dallan SpA, DANOBAT S. Coop., Haas Automation Inc., Haco NV, Jier North America Inc., Komatsu India Pvt. Ltd., LVD Co. nv, Maanshan Durmapress Co. Ltd, Mazak Optonics Corp., Mitsubishi Electric Corp., Murata Machinery Ltd., Nukon Bulgaria ltd., PRIMA POWER SEA CO LTD., Salvagnini Italia SPA, SCM GROUP Spa, TRUMPF SE Co. KG, Wilson Tool International are a few of the key vendors in the Sheet Metal Processing Equipment market.

APAC will register the highest growth rate of 58.3% among the other regions. Therefore, the Sheet Metal Processing Equipment market in APAC is expected to garner significant business opportunities for the vendors during the forecast period.

China, Japan, South Korea, India, Australia, Indonesia, Germany, France, Italy, UK, Spain, The Netherlands, US, Canada, Mexico, South Africa, UAE, Saudi Arabia, Egypt, Turkey, Brazil, Argentina, Chile

  • Increasing pace of technological innovation is the driving factor this market.

The Sheet Metal Processing Equipment market vendors should focus on grabbing business opportunities from the Application segment as it accounted for the largest market share in the base year.