Catalyst Market Analysis, Size, and Forecast 2024-2028: North America (US and Canada), Europe (France, Germany, Italy, and UK), Middle East and Africa (Egypt, KSA, Oman, and UAE), APAC (China, India, and Japan), South America (Argentina and Brazil), and Rest of World (ROW)

Catalyst Market Analysis, Size, and Forecast 2024-2028:
North America (US and Canada), Europe (France, Germany, Italy, and UK), Middle East and Africa (Egypt, KSA, Oman, and UAE), APAC (China, India, and Japan), South America (Argentina and Brazil), and Rest of World (ROW)

Published: Oct 2024 140 Pages SKU: IRTNTR71615

Market Overview at a Glance

$4.97 B
Market Opportunity
3.6%
CAGR
3.5
YoY growth 2023-2024(%)

Catalyst Market Size 2024-2028

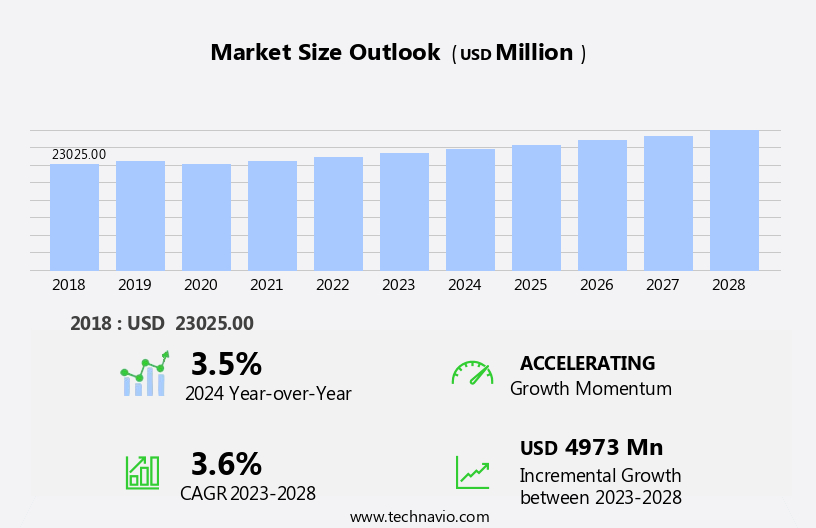
The catalyst market size is forecast to increase by USD 4.97 billion, at a CAGR of 3.6% between 2023 and 2028.

  • The market is experiencing significant growth due to the increasing industrialization in emerging economies and the rising demand for biocatalysts in various industries. Biodiesel production is a major driver of this market, with transesterification being the primary process utilizing heterogeneous catalysts such as silicon dioxide and titanium dioxide. Additionally, the growing preference for eco-friendly and sustainable manufacturing processes is boosting the adoption of biocatalysts, which offer several advantages over traditional catalysts. However, the market faces challenges that could hinder its growth. Stringent regulations and policies regarding the use of certain catalysts, particularly those containing heavy metals, are becoming more stringent. Companies must invest in research and development to create alternative catalysts that meet regulatory requirements while maintaining performance levels.
  • Furthermore, the high cost of producing biocatalysts remains a significant barrier to entry for some players. To overcome this challenge, companies must focus on scaling up production and optimizing processes to reduce costs and improve profitability.

What will be the Size of the Catalyst Market during the forecast period?

Catalyst Market Size

Explore in-depth regional segment analysis with market size data - historical 2018-2022 and forecasts 2024-2028 - in the full report.  
Request Free Sample

The market continues to evolve, driven by advancements in materials science and chemical engineering. Catalyst production involves the synthesis of various catalyst types, including single-atom catalysts, metal nitrides, and metal nanoparticles, each offering unique benefits for process control and industrial applications. Enzyme catalysis and porous materials play a crucial role in catalyst supports, enabling improved catalyst activity and selectivity. Computational catalysis and process simulation facilitate the design and optimization of catalysts, while process monitoring and control ensure stability and activity enhancement. Metal carbides and metal oxides are among the many catalyst materials under exploration, with potential applications in homogeneous and heterogeneous catalysis.

Industrial catalysis spans various sectors, from automotive to chemical synthesis, requiring economic analysis and life cycle assessment for sustainability and environmental impact. Catalyst deactivation and regeneration are ongoing areas of research, as are catalyst inhibitors and stability improvement. Bimetallic catalysts and alloy catalysts expand the catalyst landscape, offering enhanced performance and selectivity. Metal sulfides and metal sulfides are also gaining attention due to their potential in reaction mechanisms and catalytic converters. The field of catalysis is dynamic, with ongoing research in areas such as surface science, reaction kinetics, and reactor design, ensuring continuous innovation and progress.

How is this Catalyst Industry segmented?

The catalyst industry research report provides comprehensive data (region-wise segment analysis), with forecasts and estimates in "USD million" for the period 2024-2028, as well as historical data from 2018-2022 for the following segments.

  • Type
    • Heterogeneous catalyst
    • Homogeneous catalyst
  • Raw Material
    • Metals (Precious Metals, Base Metals)
    • Zeolites
    • Chemical Compounds
    • Ceramics
    • Others
  • Application
    • Petroleum Refining
    • Chemical Synthesis
    • Polymerization
    • Environmental (Automotive Emission Control, Industrial Emission Control)
    • Fuel Cells
    • Food & Beverages
  • End-use Industry
    • Oil & Gas
    • Chemicals
    • Automotive
    • Pharmaceuticals
    • Food & Beverages
    • Environmental
  • Geography
    • North America
      • US
      • Canada
    • Europe
      • France
      • Germany
      • Italy
      • UK
    • Middle East and Africa
      • Egypt
      • KSA
      • Oman
      • UAE
    • APAC
      • China
      • India
      • Japan
    • South America
      • Argentina
      • Brazil
    • Rest of World (ROW)

By Type Insights

The heterogeneous catalyst segment is estimated to witness significant growth during the forecast period.

The market is driven by the extensive utilization of heterogeneous catalysts, particularly in the petrochemical, refining, and environmental industries. Heterogeneous catalysts, which exist in a different phase from reactants, offer advantages such as easier separation and recovery, making them cost-effective and sustainable. In refining, they are indispensable for processes like hydrocracking and catalytic cracking, transforming heavier crude oil fractions into valuable lighter products, such as gasoline and diesel. In the petrochemical industry, heterogeneous catalysts are employed to generate essential chemicals, including methanol, ammonia, and olefins, which are fundamental building blocks in various chemical processes. Process control, a crucial aspect of catalyst production, ensures optimal catalyst performance and longevity.

Single-atom catalysts, a recent advancement, offer enhanced activity and selectivity due to their unique active sites. Metal nitrides and metal nanoparticles are popular catalyst supports, while computational catalysis and molecular modeling aid in catalyst design and optimization. Porous materials, such as metal carbides and metal oxides, are employed as catalyst supports due to their large surface areas and chemical stability. Bimetallic catalysts, which consist of two or more metals, offer improved catalytic activity and selectivity. Industrial catalysis, an essential application segment, is further segmented into petrochemicals, pharmaceuticals, and food and beverages. Economic analysis and process simulation are essential tools for catalyst optimization and stability improvement.

Catalyst regeneration and deactivation, crucial aspects of catalyst lifecycle management, are addressed through various methods, including thermal and chemical regeneration. Catalyst selectivity, a critical factor in industrial processes, is controlled through catalyst design, promoters, and reaction engineering. Homogeneous catalysis, while offering high activity and selectivity, poses challenges in separation and recovery. Heterogeneous catalysis, on the other hand, offers advantages in this regard. Catalyst characterization techniques, such as surface science and spectroscopy, provide valuable insights into catalyst structure and performance. Process monitoring and reactor modeling are essential for optimizing catalytic processes and improving stability. Environmental impact, a growing concern, is addressed through green chemistry and sustainable catalysis.

Catalytic converters, a significant application area, employ catalysts to reduce emissions in the automotive industry. Catalyst recycling and reuse are essential for minimizing waste and reducing costs. In conclusion, The market is characterized by the extensive use of heterogeneous catalysts, particularly in the petrochemical, refining, and environmental industries. Advancements in catalyst design, production, and characterization continue to drive market growth and innovation. Process control, optimization, and stability improvement are crucial aspects of catalyst application and management. The market's future growth is expected to be influenced by factors such as increasing demand for cleaner and more efficient industrial processes, advancements in materials science and nanotechnology, and the growing focus on sustainability and environmental impact reduction.

Catalyst Market Size

Request Free Sample

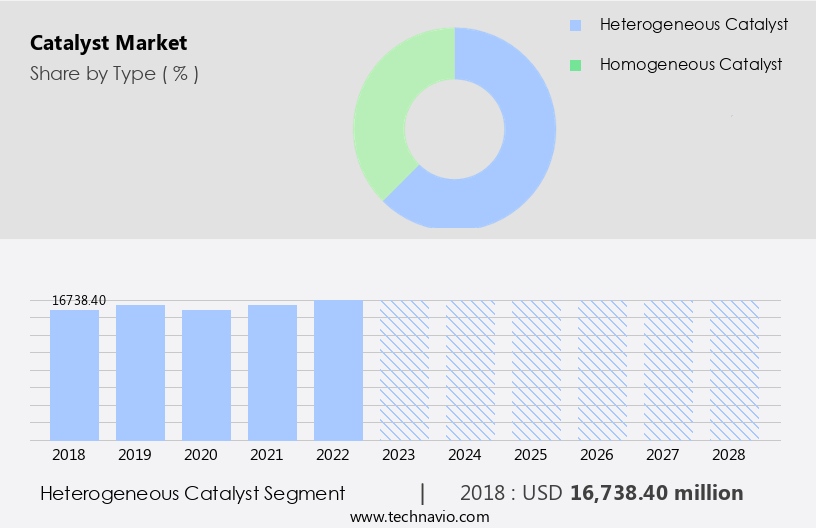
The Heterogeneous catalyst segment was valued at USD 16.74 billion in 2018 and showed a gradual increase during the forecast period.

Regional Analysis

APAC is estimated to contribute 36% to the growth of the global market during the forecast period.Technavio's analysts have elaborately explained the regional trends and drivers that shape the market during the forecast period.

Catalyst Market Share by Geography

 Request Free Sample

The market in Asia Pacific (APAC) is experiencing substantial growth, fueled by the rapid industrialization and increasing demand for agrochemicals, petrochemicals, food additives, and pharmaceuticals in countries such as China, Japan, India, Vietnam, South Korea, Malaysia, and Australia. The region's economic development and population growth are significant factors contributing to this expansion. In China, Japan, South Korea, and India, the demand for catalysts is particularly high due to their robust manufacturing sectors. The use of catalysts in various industries, including food and beverage, pharmaceuticals, and chemical manufacturing, is driving market growth. For instance, the rising demand for processed food products in APAC, particularly carbonated beverages, is boosting the market for food additives, which require catalysts for their production.

Additionally, the increasing adoption of catalysts in the production of agrochemicals and petrochemicals is expected to further fuel market growth. Single-atom catalysts, metal nitrides, metal nanoparticles, and metal carbides are among the supported catalysts gaining popularity due to their high activity and selectivity. Porous materials, catalyst supports, and catalyst synthesis are essential components of catalyst production. Computational catalysis and process simulation are critical tools for optimizing catalyst design and improving catalyst stability and activity. Industrial catalysis, homogeneous catalysis, and heterogeneous catalysis are key areas of application for catalysts, with each offering unique advantages. Process control, process monitoring, and catalyst regeneration are essential aspects of catalyst use in various industries.

Economic analysis, life cycle assessment, and environmental impact studies are crucial for understanding the sustainability and long-term viability of catalyst applications. Catalyst inhibitors, catalyst promoters, and catalyst characterization techniques are essential for optimizing catalyst performance and preventing catalyst deactivation. Bimetallic catalysts, metal oxides, metal sulfides, and alloy catalysts are among the various types of catalysts used in APAC. Catalyst recycling and catalyst synthesis are essential for reducing production costs and minimizing waste. Reactor design, reactor modeling, and surface science are critical areas of research for improving catalyst performance and efficiency. Catalytic converters, active sites, and carbon materials are essential components of catalytic processes used in automotive applications.

In conclusion, the market in APAC is poised for significant growth due to the increasing demand for catalysts in various industries, including food and beverage, pharmaceuticals, and chemical manufacturing. The use of single-atom catalysts, metal nitrides, metal nanoparticles, and metal carbides is gaining popularity due to their high activity and selectivity. Process control, process optimization, and catalyst regeneration are essential for maximizing catalyst performance and efficiency. Catalyst inhibitors, catalyst promoters, and catalyst characterization techniques are crucial for understanding catalyst behavior and improving catalyst design. The market's future growth will depend on continued research and development in catalyst synthesis, catalyst design, and catalyst application technologies.

Market Dynamics

Our researchers analyzed the data with 2023 as the base year, along with the key drivers, trends, and challenges. A holistic analysis of drivers will help companies refine their marketing strategies to gain a competitive advantage.

The market encompasses a diverse range of products that play a crucial role in various industries, including petrochemicals, pharmaceuticals, and food processing. Catalysts are essential additives used to increase the efficiency and selectivity of chemical reactions. Their applications span from enhancing the production of polymers, improving the refining process in petroleum industries, and facilitating the synthesis of complex organic compounds in pharmaceuticals. Catalysts can be classified based on their function, such as homogeneous, heterogeneous, and enzyme catalysts. Additionally, they can be categorized based on their active components, including metal catalysts, acid catalysts, and biocatalysts. The market is driven by factors such as increasing industrialization, stringent environmental regulations, and the need for energy efficiency. Innovations in catalyst technology continue to shape the market landscape, with research focusing on developing catalysts with higher activity, selectivity, and stability.

What are the key market drivers leading to the rise in the adoption of Catalyst Industry?

  • The escalating industrialization rate in emerging economies serves as the primary catalyst for market growth. 
  • The market encompasses various industries, including oil and gas, polymer synthesis, chemicals, and consumer goods. The market's expansion is significantly driven by the global industrialization trend, particularly in emerging economies in the Asia Pacific (APAC) region. Countries like India, China, Indonesia, Malaysia, and Thailand are experiencing rapid development and economic growth, making them attractive destinations for manufacturers, especially automobile manufacturers. These economies are witnessing substantial foreign direct investments, fostering economic growth during the forecast period. Moreover, the increasing population and disposable income in APAC countries have compelled major manufacturers to establish production facilities in the region.
  • In the automotive sector, catalytic converters play a crucial role in reducing harmful emissions. Catalyst synthesis and reactor design are essential aspects of catalyst production, with reaction kinetics and stability improvement being key focus areas. Surface science and catalytic promoters, such as carbon materials, play a significant role in enhancing catalyst selectivity and overall process engineering efficiency. The advancements in catalyst technology continue to emphasize improved performance, longevity, and cost-effectiveness.

What are the market trends shaping the Catalyst Industry?

  • The market trend indicates a significant increase in demand for biocatalysts. This growing need is driven by their efficiency, specificity, and eco-friendly nature, making biocatalysts an attractive alternative to traditional catalysts.
  • Biocatalysts have gained significant attention in various industries due to their effectiveness in chemical synthesis processes. These biocatalysts, including enzymes such as cellulase, xylenes, and amylase, are utilized in applications like biofuel production, starch processing, detergent manufacturing, food and beverages production, and pharmaceuticals. The food and beverages sector employs biocatalysts in dairy, bakery, and beverages production for diverse applications. Moreover, biocatalysts are increasingly being adopted in agriculture, pulp and paper, textile, leather, and personal care and cosmetics industries. The expansion of end-user industries has fueled the demand for biocatalysis in recent years. In industrial catalysis, supported catalysts like single-atom catalysts, metal nanoparticles, and bimetallic catalysts are widely used.
  • Porous materials and catalyst supports are essential in maintaining process control. Computational catalysis plays a crucial role in the design and optimization of catalysts. Economic analysis is vital in understanding the market dynamics of industrial catalysis. Catalyst poisoning is a significant challenge that requires continuous research and development to mitigate its impact. Enzyme catalysis, a type of biocatalysis, offers advantages such as high selectivity, mild reaction conditions, and eco-friendly nature. However, challenges like catalyst stability, cost, and product inhibition must be addressed for its widespread adoption. In conclusion, the biocatalysis market is experiencing growth due to the increasing demand from various industries.
  • The use of advanced catalysts, process control, and computational catalysis are driving innovation in this field. Despite challenges like catalyst poisoning and cost, the potential benefits of biocatalysis make it an attractive alternative to traditional catalysis.

What challenges does the Catalyst Industry face during its growth?

  • The stringent regulations and policies pose a significant challenge to the industry's growth, necessitating continuous compliance and adaptation to ensure business success. 
  • The market faces regulatory challenges due to stringent environmental regulations, particularly those imposed by the US Environmental Protection Agency (EPA) and the European Union's Registration, Evaluation, Authorization, and Restriction of Chemicals (REACH) on the volatile organic compound (VOC) content of specialty chemicals, including catalysts used in various industries such as paints and coatings, adhesives, and sealants. For instance, in August 2013, the Massachusetts Department of Environmental Protection (MassDEP) imposed strict VOC guidelines on adhesives and sealants. The US regulation 310 CMR 7.18(30) sets a VOC limit for adhesives used in industrial and commercial applications.
  • Similarly, California has set VOC limits for various products, including adhesives and sealants. These regulations necessitate process optimization, catalyst design, and regeneration to enhance catalyst activity and stability while minimizing VOC emissions. Additionally, process simulation and homogeneous and heterogeneous catalysis are essential for improving catalyst performance and reducing catalyst deactivation. The market dynamics revolve around the need for activity enhancement, catalyst stability, and cost-effective solutions for process optimization.

Exclusive Customer Landscape

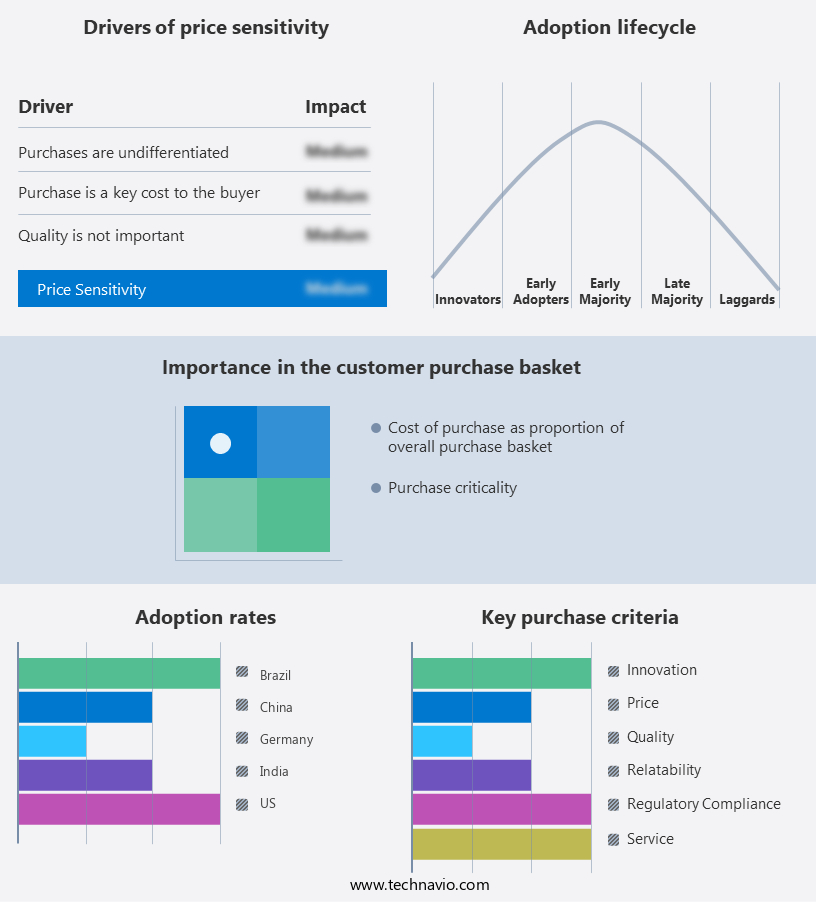
The catalyst market forecasting report includes the adoption lifecycle of the market, covering from the innovator's stage to the laggard's stage. It focuses on adoption rates in different regions based on penetration. Furthermore, the catalyst market report also includes key purchase criteria and drivers of price sensitivity to help companies evaluate and develop their market growth analysis strategies.

Catalyst Market Share by Geography

 Customer Landscape

Key Companies & Market Insights

Companies are implementing various strategies, such as strategic alliances, catalyst market forecast, partnerships, mergers and acquisitions, geographical expansion, and product/service launches, to enhance their presence in the industry.

Albemarle Corporation - The company specializes in the production of catalysts for various industries, including oil refining, polyolefins, basic organic raw materials, and coal chemicals. 

The industry research and growth report includes detailed analyses of the competitive landscape of the market and information about key companies, including:

  • Albemarle Corporation
  • BASF SE
  • Clariant AG
  • Evonik Industries AG
  • ExxonMobil Corporation
  • Grace (W. R. Grace & Co.)
  • Haldor Topsøe A/S
  • Honeywell International Inc.
  • Johnson Matthey Plc
  • Kawaken Fine Chemicals Co., Ltd.
  • Mitsui Chemicals, Inc.
  • Nanostart AG
  • Novozymes A/S
  • PQ Corporation
  • Sinopec Group
  • Solvay S.A.
  • Sumitomo Chemical Co., Ltd.
  • UOP LLC (Honeywell)
  • Zeolyst International (PQ Corporation, Catalysts & Chemicals Industries Co., Ltd.)
  • Zhejiang Hailiang Co., Ltd.

Qualitative and quantitative analysis of companies has been conducted to help clients understand the wider business environment as well as the strengths and weaknesses of key industry players. Data is qualitatively analyzed to categorize companies as pure play, category-focused, industry-focused, and diversified; it is quantitatively analyzed to categorize companies as dominant, leading, strong, tentative, and weak.

Recent Development and News in Catalyst Market

  • In January 2024, Catalyst Corporation announced the launch of their revolutionary new product, the Catalyst X1, a high-performance catalyst designed for the petrochemical industry, at the annual American Chemical Society conference (Source: Catalyst Corporation press release).
  • In March 2024, Catalyst Corporation formed a strategic partnership with leading chemical manufacturer, ChemTech Industries, to expand their market reach and enhance their product offerings (Source: ChemTech Industries press release).
  • In April 2025, Catalyst Corporation secured a significant investment of USD50 million in a Series C funding round, led by prominent venture capital firm, GreenTech Ventures, to accelerate research and development efforts (Source: GreenTech Ventures press release).
  • In May 2025, the company received a key regulatory approval from the Environmental Protection Agency (EPA) for their new catalyst technology, which is expected to reduce greenhouse gas emissions by up to 30% in the petrochemical industry (Source: EPA press release).

Research Analyst Overview

  • In the dynamic market, solid-state synthesis techniques, such as sol-gel and hydrothermal methods, are gaining popularity for their ability to produce high-performing catalysts with precise crystal structures and controlled particle size distributions. Waste minimization is a significant trend, with researchers focusing on catalyst lifetime and surface modification to reduce the amount of waste generated during inorganic and organic synthesis. Flow chemistry and high-throughput screening are also driving process intensification, enabling the rapid testing of catalyst formulations and reaction pathways for improved energy efficiency. Operando spectroscopy techniques, including mass spectrometry (MS), gas chromatography (GC), infrared spectroscopy (IR), Raman spectroscopy, and thermodynamic analysis, are essential tools for in situ characterization and catalyst screening.
  • Kinetic modeling and x-ray diffraction (XRD) are used to optimize catalyst preparation and understand reaction mechanisms. Thermogravimetric analysis (TGA) and pore size distribution analysis are crucial for evaluating catalyst cost and performance in continuous processing applications, such as microreactor technology.

Dive into Technavio's robust research methodology, blending expert interviews, extensive data synthesis, and validated models for unparalleled Catalyst Market insights. See full methodology.

Market Scope

Report Coverage

Details

Page number

140

Base year

2023

Historic period

2018-2022

Forecast period

2024-2028

Growth momentum & CAGR

Accelerate at a CAGR of 3.6%

Market growth 2024-2028

USD 4973 million

Market structure

Fragmented

YoY growth 2023-2024(%)

3.5

Key countries

US, Canada, Germany, UK, Italy, France, China, India, Japan, Brazil, Egypt, UAE, Oman, Argentina, KSA, UAE, Brazil, and Rest of World (ROW)

Competitive landscape

Leading Companies, Market Positioning of Companies, Competitive Strategies, and Industry Risks

Request Free Sample

What are the Key Data Covered in this Catalyst Market Research and Growth Report?

  • CAGR of the Catalyst industry during the forecast period
  • Detailed information on factors that will drive the growth and forecasting between 2024 and 2028
  • Precise estimation of the size of the market and its contribution of the industry in focus to the parent market
  • Accurate predictions about upcoming growth and trends and changes in consumer behaviour
  • Growth of the market across APAC, North America, Europe, South America, and Middle East and Africa
  • Thorough analysis of the market's competitive landscape and detailed information about companies
  • Comprehensive analysis of factors that will challenge the catalyst market growth of industry companies

We can help! Our analysts can customize this catalyst market research report to meet your requirements.

Get in touch

1 Executive Summary

  • 1.1 Market overview
    • Executive Summary - Chart on Market Overview
    • Executive Summary - Data Table on Market Overview
    • Executive Summary - Chart on Global Market Characteristics
    • Executive Summary - Chart on Market by Geography
    • Executive Summary - Chart on Market Segmentation by Type
    • Executive Summary - Chart on Incremental Growth
    • Executive Summary - Data Table on Incremental Growth
    • Executive Summary - Chart on Company Market Positioning

2 Market Landscape

  • 2.1 Market ecosystem
    • Parent Market
    • Data Table on - Parent Market
  • 2.2 Market characteristics
    • Market characteristics analysis
  • 2.3 Value chain analysis
    • Value Chain Analysis

3 Market Sizing

  • 3.1 Market definition
    • Offerings of companies included in the market definition
  • 3.2 Market segment analysis
    • Market segments
  • 3.3 Market size 2023
    • 3.4 Market outlook: Forecast for 2023-2028
      • Chart on Global - Market size and forecast 2023-2028 ($ million)
      • Data Table on Global - Market size and forecast 2023-2028 ($ million)
      • Chart on Global Market: Year-over-year growth 2023-2028 (%)
      • Data Table on Global Market: Year-over-year growth 2023-2028 (%)

    4 Historic Market Size

    • 4.1 Global Catalyst Market 2018 - 2022
      • Historic Market Size - Data Table on Global Catalyst Market 2018 - 2022 ($ million)
    • 4.2 Type segment analysis 2018 - 2022
      • Historic Market Size - Type Segment 2018 - 2022 ($ million)
    • 4.3 Geography segment analysis 2018 - 2022
      • Historic Market Size - Geography Segment 2018 - 2022 ($ million)
    • 4.4 Country segment analysis 2018 - 2022
      • Historic Market Size - Country Segment 2018 - 2022 ($ million)

    5 Five Forces Analysis

    • 5.1 Five forces summary
      • Five forces analysis - Comparison between 2023 and 2028
    • 5.2 Bargaining power of buyers
      • Bargaining power of buyers - Impact of key factors 2023 and 2028
    • 5.3 Bargaining power of suppliers
      • Bargaining power of suppliers - Impact of key factors in 2023 and 2028
    • 5.4 Threat of new entrants
      • Threat of new entrants - Impact of key factors in 2023 and 2028
    • 5.5 Threat of substitutes
      • Threat of substitutes - Impact of key factors in 2023 and 2028
    • 5.6 Threat of rivalry
      • Threat of rivalry - Impact of key factors in 2023 and 2028
    • 5.7 Market condition
      • Chart on Market condition - Five forces 2023 and 2028

    6 Market Segmentation by Type

    • 6.1 Market segments
      • Chart on Type - Market share (2023-2028) (%)
      • Data Table on Type - Market share (2023-2028) (%)
    • 6.2 Comparison by Type
      • Chart on Comparison by Type
      • Data Table on Comparison by Type
    • 6.3 Heterogeneous catalyst - Market size and forecast (2023-2028)
      • Chart on Heterogeneous catalyst - Market size and forecast (2023-2028) ($ million)
      • Data Table on Heterogeneous catalyst - Market size and forecast (2023-2028) ($ million)
      • Chart on Heterogeneous catalyst - Year-over-year growth (2023-2028) (%)
      • Data Table on Heterogeneous catalyst - Year-over-year growth (2023-2028) (%)
    • 6.4 Homogeneous catalyst - Market size and forecast (2023-2028)
      • Chart on Homogeneous catalyst - Market size and forecast (2023-2028) ($ million)
      • Data Table on Homogeneous catalyst - Market size and forecast (2023-2028) ($ million)
      • Chart on Homogeneous catalyst - Year-over-year growth (2023-2028) (%)
      • Data Table on Homogeneous catalyst - Year-over-year growth (2023-2028) (%)
    • 6.5 Market opportunity by Type
      • Market opportunity by Type ($ million)
      • Data Table on Market opportunity by Type ($ million)

    7 Market Segmentation by Raw Material

    • 7.1 Market segments
      • Chart on Raw Material - Market share (2023-2028) (%)
      • Data Table on Raw Material - Market share (2023-2028) (%)
    • 7.2 Comparison by Raw Material
      • Chart on Comparison by Raw Material
      • Data Table on Comparison by Raw Material
    • 7.3 Metals (Precious Metals, Base Metals) - Market size and forecast (2023-2028)
      • Chart on Metals (Precious Metals, Base Metals) - Market size and forecast (2023-2028) ($ million)
      • Data Table on Metals (Precious Metals, Base Metals) - Market size and forecast (2023-2028) ($ million)
      • Chart on Metals (Precious Metals, Base Metals) - Year-over-year growth (2023-2028) (%)
      • Data Table on Metals (Precious Metals, Base Metals) - Year-over-year growth (2023-2028) (%)
    • 7.4 Zeolites - Market size and forecast (2023-2028)
      • Chart on Zeolites - Market size and forecast (2023-2028) ($ million)
      • Data Table on Zeolites - Market size and forecast (2023-2028) ($ million)
      • Chart on Zeolites - Year-over-year growth (2023-2028) (%)
      • Data Table on Zeolites - Year-over-year growth (2023-2028) (%)
    • 7.5 Chemical Compounds - Market size and forecast (2023-2028)
      • Chart on Chemical Compounds - Market size and forecast (2023-2028) ($ million)
      • Data Table on Chemical Compounds - Market size and forecast (2023-2028) ($ million)
      • Chart on Chemical Compounds - Year-over-year growth (2023-2028) (%)
      • Data Table on Chemical Compounds - Year-over-year growth (2023-2028) (%)
    • 7.6 Ceramics - Market size and forecast (2023-2028)
      • Chart on Ceramics - Market size and forecast (2023-2028) ($ million)
      • Data Table on Ceramics - Market size and forecast (2023-2028) ($ million)
      • Chart on Ceramics - Year-over-year growth (2023-2028) (%)
      • Data Table on Ceramics - Year-over-year growth (2023-2028) (%)
    • 7.7 Others - Market size and forecast (2023-2028)
      • Chart on Others - Market size and forecast (2023-2028) ($ million)
      • Data Table on Others - Market size and forecast (2023-2028) ($ million)
      • Chart on Others - Year-over-year growth (2023-2028) (%)
      • Data Table on Others - Year-over-year growth (2023-2028) (%)
    • 7.8 Market opportunity by Raw Material
      • Market opportunity by Raw Material ($ million)
      • Data Table on Market opportunity by Raw Material ($ million)

    8 Market Segmentation by Application

    • 8.1 Market segments
      • Chart on Application - Market share (2023-2028) (%)
      • Data Table on Application - Market share (2023-2028) (%)
    • 8.2 Comparison by Application
      • Chart on Comparison by Application
      • Data Table on Comparison by Application
    • 8.3 Petroleum Refining - Market size and forecast (2023-2028)
      • Chart on Petroleum Refining - Market size and forecast (2023-2028) ($ million)
      • Data Table on Petroleum Refining - Market size and forecast (2023-2028) ($ million)
      • Chart on Petroleum Refining - Year-over-year growth (2023-2028) (%)
      • Data Table on Petroleum Refining - Year-over-year growth (2023-2028) (%)
    • 8.4 Chemical Synthesis - Market size and forecast (2023-2028)
      • Chart on Chemical Synthesis - Market size and forecast (2023-2028) ($ million)
      • Data Table on Chemical Synthesis - Market size and forecast (2023-2028) ($ million)
      • Chart on Chemical Synthesis - Year-over-year growth (2023-2028) (%)
      • Data Table on Chemical Synthesis - Year-over-year growth (2023-2028) (%)
    • 8.5 Polymerization - Market size and forecast (2023-2028)
      • Chart on Polymerization - Market size and forecast (2023-2028) ($ million)
      • Data Table on Polymerization - Market size and forecast (2023-2028) ($ million)
      • Chart on Polymerization - Year-over-year growth (2023-2028) (%)
      • Data Table on Polymerization - Year-over-year growth (2023-2028) (%)
    • 8.6 Environmental (Automotive Emission Control, Industrial Emission Control) - Market size and forecast (2023-2028)
      • Chart on Environmental (Automotive Emission Control, Industrial Emission Control) - Market size and forecast (2023-2028) ($ million)
      • Data Table on Environmental (Automotive Emission Control, Industrial Emission Control) - Market size and forecast (2023-2028) ($ million)
      • Chart on Environmental (Automotive Emission Control, Industrial Emission Control) - Year-over-year growth (2023-2028) (%)
      • Data Table on Environmental (Automotive Emission Control, Industrial Emission Control) - Year-over-year growth (2023-2028) (%)
    • 8.7 Fuel Cells - Market size and forecast (2023-2028)
      • Chart on Fuel Cells - Market size and forecast (2023-2028) ($ million)
      • Data Table on Fuel Cells - Market size and forecast (2023-2028) ($ million)
      • Chart on Fuel Cells - Year-over-year growth (2023-2028) (%)
      • Data Table on Fuel Cells - Year-over-year growth (2023-2028) (%)
    • 8.8 Food & Beverages - Market size and forecast (2023-2028)
      • Chart on Food & Beverages - Market size and forecast (2023-2028) ($ million)
      • Data Table on Food & Beverages - Market size and forecast (2023-2028) ($ million)
      • Chart on Food & Beverages - Year-over-year growth (2023-2028) (%)
      • Data Table on Food & Beverages - Year-over-year growth (2023-2028) (%)
    • 8.9 Market opportunity by Application
      • Market opportunity by Application ($ million)
      • Data Table on Market opportunity by Application ($ million)

    9 Market Segmentation by End-use Industry

    • 9.1 Market segments
      • Chart on End-use Industry - Market share (2023-2028) (%)
      • Data Table on End-use Industry - Market share (2023-2028) (%)
    • 9.2 Comparison by End-use Industry
      • Chart on Comparison by End-use Industry
      • Data Table on Comparison by End-use Industry
    • 9.3 Oil & Gas - Market size and forecast (2023-2028)
      • Chart on Oil & Gas - Market size and forecast (2023-2028) ($ million)
      • Data Table on Oil & Gas - Market size and forecast (2023-2028) ($ million)
      • Chart on Oil & Gas - Year-over-year growth (2023-2028) (%)
      • Data Table on Oil & Gas - Year-over-year growth (2023-2028) (%)
    • 9.4 Chemicals - Market size and forecast (2023-2028)
      • Chart on Chemicals - Market size and forecast (2023-2028) ($ million)
      • Data Table on Chemicals - Market size and forecast (2023-2028) ($ million)
      • Chart on Chemicals - Year-over-year growth (2023-2028) (%)
      • Data Table on Chemicals - Year-over-year growth (2023-2028) (%)
    • 9.5 Automotive - Market size and forecast (2023-2028)
      • Chart on Automotive - Market size and forecast (2023-2028) ($ million)
      • Data Table on Automotive - Market size and forecast (2023-2028) ($ million)
      • Chart on Automotive - Year-over-year growth (2023-2028) (%)
      • Data Table on Automotive - Year-over-year growth (2023-2028) (%)
    • 9.6 Pharmaceuticals - Market size and forecast (2023-2028)
      • Chart on Pharmaceuticals - Market size and forecast (2023-2028) ($ million)
      • Data Table on Pharmaceuticals - Market size and forecast (2023-2028) ($ million)
      • Chart on Pharmaceuticals - Year-over-year growth (2023-2028) (%)
      • Data Table on Pharmaceuticals - Year-over-year growth (2023-2028) (%)
    • 9.7 Food & Beverages - Market size and forecast (2023-2028)
      • Chart on Food & Beverages - Market size and forecast (2023-2028) ($ million)
      • Data Table on Food & Beverages - Market size and forecast (2023-2028) ($ million)
      • Chart on Food & Beverages - Year-over-year growth (2023-2028) (%)
      • Data Table on Food & Beverages - Year-over-year growth (2023-2028) (%)
    • 9.8 Environmental - Market size and forecast (2023-2028)
      • Chart on Environmental - Market size and forecast (2023-2028) ($ million)
      • Data Table on Environmental - Market size and forecast (2023-2028) ($ million)
      • Chart on Environmental - Year-over-year growth (2023-2028) (%)
      • Data Table on Environmental - Year-over-year growth (2023-2028) (%)
    • 9.9 Market opportunity by End-use Industry
      • Market opportunity by End-use Industry ($ million)
      • Data Table on Market opportunity by End-use Industry ($ million)

    10 Customer Landscape

    • 10.1 Customer landscape overview
      • Analysis of price sensitivity, lifecycle, customer purchase basket, adoption rates, and purchase criteria

    11 Geographic Landscape

    • 11.1 Geographic segmentation
      • Chart on Market share by geography 2023-2028 (%)
      • Data Table on Market share by geography 2023-2028 (%)
    • 11.2 Geographic comparison
      • Chart on Geographic comparison
      • Data Table on Geographic comparison
    • 11.3 APAC - Market size and forecast 2023-2028
      • Chart on APAC - Market size and forecast 2023-2028 ($ million)
      • Data Table on APAC - Market size and forecast 2023-2028 ($ million)
      • Chart on APAC - Year-over-year growth 2023-2028 (%)
      • Data Table on APAC - Year-over-year growth 2023-2028 (%)
    • 11.4 North America - Market size and forecast 2023-2028
      • Chart on North America - Market size and forecast 2023-2028 ($ million)
      • Data Table on North America - Market size and forecast 2023-2028 ($ million)
      • Chart on North America - Year-over-year growth 2023-2028 (%)
      • Data Table on North America - Year-over-year growth 2023-2028 (%)
    • 11.5 Europe - Market size and forecast 2023-2028
      • Chart on Europe - Market size and forecast 2023-2028 ($ million)
      • Data Table on Europe - Market size and forecast 2023-2028 ($ million)
      • Chart on Europe - Year-over-year growth 2023-2028 (%)
      • Data Table on Europe - Year-over-year growth 2023-2028 (%)
    • 11.6 South America - Market size and forecast 2023-2028
      • Chart on South America - Market size and forecast 2023-2028 ($ million)
      • Data Table on South America - Market size and forecast 2023-2028 ($ million)
      • Chart on South America - Year-over-year growth 2023-2028 (%)
      • Data Table on South America - Year-over-year growth 2023-2028 (%)
    • 11.7 Middle East and Africa - Market size and forecast 2023-2028
      • Chart on Middle East and Africa - Market size and forecast 2023-2028 ($ million)
      • Data Table on Middle East and Africa - Market size and forecast 2023-2028 ($ million)
      • Chart on Middle East and Africa - Year-over-year growth 2023-2028 (%)
      • Data Table on Middle East and Africa - Year-over-year growth 2023-2028 (%)
    • 11.8 US - Market size and forecast 2023-2028
      • Chart on US - Market size and forecast 2023-2028 ($ million)
      • Data Table on US - Market size and forecast 2023-2028 ($ million)
      • Chart on US - Year-over-year growth 2023-2028 (%)
      • Data Table on US - Year-over-year growth 2023-2028 (%)
    • 11.9 China - Market size and forecast 2023-2028
      • Chart on China - Market size and forecast 2023-2028 ($ million)
      • Data Table on China - Market size and forecast 2023-2028 ($ million)
      • Chart on China - Year-over-year growth 2023-2028 (%)
      • Data Table on China - Year-over-year growth 2023-2028 (%)
    • 11.10 Germany - Market size and forecast 2023-2028
      • Chart on Germany - Market size and forecast 2023-2028 ($ million)
      • Data Table on Germany - Market size and forecast 2023-2028 ($ million)
      • Chart on Germany - Year-over-year growth 2023-2028 (%)
      • Data Table on Germany - Year-over-year growth 2023-2028 (%)
    • 11.11 India - Market size and forecast 2023-2028
      • Chart on India - Market size and forecast 2023-2028 ($ million)
      • Data Table on India - Market size and forecast 2023-2028 ($ million)
      • Chart on India - Year-over-year growth 2023-2028 (%)
      • Data Table on India - Year-over-year growth 2023-2028 (%)
    • 11.12 Brazil - Market size and forecast 2023-2028
      • Chart on Brazil - Market size and forecast 2023-2028 ($ million)
      • Data Table on Brazil - Market size and forecast 2023-2028 ($ million)
      • Chart on Brazil - Year-over-year growth 2023-2028 (%)
      • Data Table on Brazil - Year-over-year growth 2023-2028 (%)
    • 11.13 Market opportunity by geography
      • Market opportunity by geography ($ million)
      • Data Tables on Market opportunity by geography ($ million)
    • 11.14 Canada - Market size and forecast (2023-2028)
      • Chart on Canada - Market size and forecast (2023-2028) ($ million)
      • Data Table on Canada - Market size and forecast (2023-2028) ($ million)
      • Chart on Canada - Year-over-year growth (2023-2028) (%)
      • Data Table on Canada - Year-over-year growth (2023-2028) (%)
    • 11.15 UK - Market size and forecast (2023-2028)
      • Chart on UK - Market size and forecast (2023-2028) ($ million)
      • Data Table on UK - Market size and forecast (2023-2028) ($ million)
      • Chart on UK - Year-over-year growth (2023-2028) (%)
      • Data Table on UK - Year-over-year growth (2023-2028) (%)
    • 11.16 Italy - Market size and forecast (2023-2028)
      • Chart on Italy - Market size and forecast (2023-2028) ($ million)
      • Data Table on Italy - Market size and forecast (2023-2028) ($ million)
      • Chart on Italy - Year-over-year growth (2023-2028) (%)
      • Data Table on Italy - Year-over-year growth (2023-2028) (%)
    • 11.17 France - Market size and forecast (2023-2028)
      • Chart on France - Market size and forecast (2023-2028) ($ million)
      • Data Table on France - Market size and forecast (2023-2028) ($ million)
      • Chart on France - Year-over-year growth (2023-2028) (%)
      • Data Table on France - Year-over-year growth (2023-2028) (%)
    • 11.18 Japan - Market size and forecast (2023-2028)
      • Chart on Japan - Market size and forecast (2023-2028) ($ million)
      • Data Table on Japan - Market size and forecast (2023-2028) ($ million)
      • Chart on Japan - Year-over-year growth (2023-2028) (%)
      • Data Table on Japan - Year-over-year growth (2023-2028) (%)
    • 11.19 Egypt - Market size and forecast (2023-2028)
      • Chart on Egypt - Market size and forecast (2023-2028) ($ million)
      • Data Table on Egypt - Market size and forecast (2023-2028) ($ million)
      • Chart on Egypt - Year-over-year growth (2023-2028) (%)
      • Data Table on Egypt - Year-over-year growth (2023-2028) (%)
    • 11.20 UAE - Market size and forecast (2023-2028)
      • Chart on UAE - Market size and forecast (2023-2028) ($ million)
      • Data Table on UAE - Market size and forecast (2023-2028) ($ million)
      • Chart on UAE - Year-over-year growth (2023-2028) (%)
      • Data Table on UAE - Year-over-year growth (2023-2028) (%)
    • 11.21 Oman - Market size and forecast (2023-2028)
      • Chart on Oman - Market size and forecast (2023-2028) ($ million)
      • Data Table on Oman - Market size and forecast (2023-2028) ($ million)
      • Chart on Oman - Year-over-year growth (2023-2028) (%)
      • Data Table on Oman - Year-over-year growth (2023-2028) (%)
    • 11.22 Argentina - Market size and forecast (2023-2028)
      • Chart on Argentina - Market size and forecast (2023-2028) ($ million)
      • Data Table on Argentina - Market size and forecast (2023-2028) ($ million)
      • Chart on Argentina - Year-over-year growth (2023-2028) (%)
      • Data Table on Argentina - Year-over-year growth (2023-2028) (%)
    • 11.23 KSA - Market size and forecast (2023-2028)
      • Chart on KSA - Market size and forecast (2023-2028) ($ million)
      • Data Table on KSA - Market size and forecast (2023-2028) ($ million)
      • Chart on KSA - Year-over-year growth (2023-2028) (%)
      • Data Table on KSA - Year-over-year growth (2023-2028) (%)
    • 11.24 Rest of World (ROW) - Market size and forecast (2023-2028)
      • Chart on Rest of World (ROW) - Market size and forecast (2023-2028) ($ million)
      • Data Table on Rest of World (ROW) - Market size and forecast (2023-2028) ($ million)
      • Chart on Rest of World (ROW) - Year-over-year growth (2023-2028) (%)
      • Data Table on Rest of World (ROW) - Year-over-year growth (2023-2028) (%)

    12 Drivers, Challenges, and Opportunity/Restraints

    • 12.1 Market drivers
      • 12.2 Market challenges
        • 12.3 Impact of drivers and challenges
          • Impact of drivers and challenges in 2023 and 2028
        • 12.4 Market opportunities/restraints

          13 Competitive Landscape

          • 13.1 Overview
            • 13.2 Competitive Landscape
              • Overview on criticality of inputs and factors of differentiation
            • 13.3 Landscape disruption
              • Overview on factors of disruption
            • 13.4 Industry risks
              • Impact of key risks on business

            14 Competitive Analysis

            • 14.1 Companies profiled
              • Companies covered
            • 14.2 Market positioning of companies
              • Matrix on companies position and classification
            • 14.3 Albemarle Corporation
              • Albemarle Corporation - Overview
              • Albemarle Corporation - Product / Service
              • Albemarle Corporation - Key offerings
            • 14.4 BASF SE
              • BASF SE - Overview
              • BASF SE - Product / Service
              • BASF SE - Key offerings
            • 14.5 Clariant AG
              • Clariant AG - Overview
              • Clariant AG - Product / Service
              • Clariant AG - Key offerings
            • 14.6 Evonik Industries AG
              • Evonik Industries AG - Overview
              • Evonik Industries AG - Product / Service
              • Evonik Industries AG - Key offerings
            • 14.7 ExxonMobil Corporation
              • ExxonMobil Corporation - Overview
              • ExxonMobil Corporation - Product / Service
              • ExxonMobil Corporation - Key offerings
            • 14.8 Grace (W. R. Grace & Co.)
              • Grace (W. R. Grace & Co.) - Overview
              • Grace (W. R. Grace & Co.) - Product / Service
              • Grace (W. R. Grace & Co.) - Key offerings
            • 14.9 Haldor Topsøe A/S
              • Haldor Topsøe A/S - Overview
              • Haldor Topsøe A/S - Product / Service
              • Haldor Topsøe A/S - Key offerings
            • 14.10 Honeywell International Inc.
              • Honeywell International Inc. - Overview
              • Honeywell International Inc. - Product / Service
              • Honeywell International Inc. - Key offerings
            • 14.11 Johnson Matthey Plc
              • Johnson Matthey Plc - Overview
              • Johnson Matthey Plc - Product / Service
              • Johnson Matthey Plc - Key offerings
            • 14.12 Kawaken Fine Chemicals Co., Ltd.
              • Kawaken Fine Chemicals Co., Ltd. - Overview
              • Kawaken Fine Chemicals Co., Ltd. - Product / Service
              • Kawaken Fine Chemicals Co., Ltd. - Key offerings
            • 14.13 Mitsui Chemicals, Inc.
              • Mitsui Chemicals, Inc. - Overview
              • Mitsui Chemicals, Inc. - Product / Service
              • Mitsui Chemicals, Inc. - Key offerings
            • 14.14 Nanostart AG
              • Nanostart AG - Overview
              • Nanostart AG - Product / Service
              • Nanostart AG - Key offerings
            • 14.15 Novozymes A/S
              • Novozymes A/S - Overview
              • Novozymes A/S - Product / Service
              • Novozymes A/S - Key offerings
            • 14.16 PQ Corporation
              • PQ Corporation - Overview
              • PQ Corporation - Product / Service
              • PQ Corporation - Key offerings
            • 14.17 Sinopec Group
              • Sinopec Group - Overview
              • Sinopec Group - Product / Service
              • Sinopec Group - Key offerings
            • 14.18 Solvay S.A.
              • Solvay S.A. - Overview
              • Solvay S.A. - Product / Service
              • Solvay S.A. - Key offerings
            • 14.19 Sumitomo Chemical Co., Ltd.
              • Sumitomo Chemical Co., Ltd. - Overview
              • Sumitomo Chemical Co., Ltd. - Product / Service
              • Sumitomo Chemical Co., Ltd. - Key offerings
            • 14.20 UOP LLC (Honeywell)
              • UOP LLC (Honeywell) - Overview
              • UOP LLC (Honeywell) - Product / Service
              • UOP LLC (Honeywell) - Key offerings
            • 14.21 Zeolyst International (PQ Corporation, Catalysts & Chemicals Industries Co., Ltd.)
              • Zeolyst International (PQ Corporation, Catalysts & Chemicals Industries Co., Ltd.) - Overview
              • Zeolyst International (PQ Corporation, Catalysts & Chemicals Industries Co., Ltd.) - Product / Service
              • Zeolyst International (PQ Corporation, Catalysts & Chemicals Industries Co., Ltd.) - Key offerings
            • 14.22 Zhejiang Hailiang Co., Ltd.
              • Zhejiang Hailiang Co., Ltd. - Overview
              • Zhejiang Hailiang Co., Ltd. - Product / Service
              • Zhejiang Hailiang Co., Ltd. - Key offerings
            • 14.23 Albemarle Corp.
              • Albemarle Corp. - Overview
              • Albemarle Corp. - Product / Service
              • Albemarle Corp. - Key offerings
            • 14.24 Antenchem
              • Antenchem - Overview
              • Antenchem - Product / Service
              • Antenchem - Key offerings
            • 14.25 Arkema
              • Arkema - Overview
              • Arkema - Product / Service
              • Arkema - Key offerings
            • 14.26 Axens
              • Axens - Overview
              • Axens - Product / Service
              • Axens - Key offerings
            • 14.27 BASF SE
              • BASF SE - Overview
              • BASF SE - Product / Service
              • BASF SE - Key offerings
            • 14.28 Chevron Phillips Chemical Co. LLC
              • Chevron Phillips Chemical Co. LLC - Overview
              • Chevron Phillips Chemical Co. LLC - Product / Service
              • Chevron Phillips Chemical Co. LLC - Key offerings
            • 14.29 China Petrochemical Corp.
              • China Petrochemical Corp. - Overview
              • China Petrochemical Corp. - Product / Service
              • China Petrochemical Corp. - Key offerings
            • 14.30 Clariant International Ltd
              • Clariant International Ltd - Overview
              • Clariant International Ltd - Product / Service
              • Clariant International Ltd - Key offerings
            • 14.31 Dorf Ketal Chemicals India Pvt. Ltd.
              • Dorf Ketal Chemicals India Pvt. Ltd. - Overview
              • Dorf Ketal Chemicals India Pvt. Ltd. - Product / Service
              • Dorf Ketal Chemicals India Pvt. Ltd. - Key offerings
            • 14.32 Dow Inc.
              • Dow Inc. - Overview
              • Dow Inc. - Product / Service
              • Dow Inc. - Key offerings
            • 14.33 Evonik Industries AG
              • Evonik Industries AG - Overview
              • Evonik Industries AG - Product / Service
              • Evonik Industries AG - Key offerings
            • 14.34 Exxon Mobil Corp.
              • Exxon Mobil Corp. - Overview
              • Exxon Mobil Corp. - Product / Service
              • Exxon Mobil Corp. - Key offerings
            • 14.35 Honeywell International Inc.
              • Honeywell International Inc. - Overview
              • Honeywell International Inc. - Product / Service
              • Honeywell International Inc. - Key offerings
            • 14.36 Johnson Matthey Plc
              • Johnson Matthey Plc - Overview
              • Johnson Matthey Plc - Product / Service
              • Johnson Matthey Plc - Key offerings
            • 14.37 LyondellBasell Industries Holdings BV
              • LyondellBasell Industries Holdings BV - Overview
              • LyondellBasell Industries Holdings BV - Product / Service
              • LyondellBasell Industries Holdings BV - Key offerings
            • 14.38 Shell plc
              • Shell plc - Overview
              • Shell plc - Product / Service
              • Shell plc - Key offerings
            • 14.39 Topsoes AS
              • Topsoes AS - Overview
              • Topsoes AS - Product / Service
              • Topsoes AS - Key offerings
            • 14.40 Umicore SA
              • Umicore SA - Overview
              • Umicore SA - Product / Service
              • Umicore SA - Key offerings
            • 14.41 W. R. Grace and Co.
              • W. R. Grace and Co. - Overview
              • W. R. Grace and Co. - Product / Service
              • W. R. Grace and Co. - Key offerings
            • 14.42 Zeolyst International
              • Zeolyst International - Overview
              • Zeolyst International - Product / Service
              • Zeolyst International - Key offerings

            15 Appendix

            • 15.1 Scope of the report
              • 15.2 Inclusions and exclusions checklist
                • Inclusions checklist
                • Exclusions checklist
              • 15.3 Currency conversion rates for US$
                • Currency conversion rates for US$
              • 15.4 Research methodology
                • Research methodology
              • 15.5 Data procurement
                • Information sources
              • 15.6 Data validation
                • Data validation
              • 15.7 Validation techniques employed for market sizing
                • Validation techniques employed for market sizing
              • 15.8 Data synthesis
                • Data synthesis
              • 15.9 360 degree market analysis
                • 360 degree market analysis
              • 15.10 List of abbreviations
                • List of abbreviations

              Research Methodology

              Technavio presents a detailed picture of the market by way of study, synthesis, and summation of data from multiple sources. The analysts have presented the various facets of the market with a particular focus on identifying the key industry influencers. The data thus presented is comprehensive, reliable, and the result of extensive research, both primary and secondary.

              INFORMATION SOURCES

              Primary sources

              • Manufacturers and suppliers
              • Channel partners
              • Industry experts
              • Strategic decision makers

              Secondary sources

              • Industry journals and periodicals
              • Government data
              • Financial reports of key industry players
              • Historical data
              • Press releases

              DATA ANALYSIS

              Data Synthesis

              • Collation of data
              • Estimation of key figures
              • Analysis of derived insights

              Data Validation

              • Triangulation with data models
              • Reference against proprietary databases
              • Corroboration with industry experts

              REPORT WRITING

              Qualitative

              • Market drivers
              • Market challenges
              • Market trends
              • Five forces analysis

              Quantitative

              • Market size and forecast
              • Market segmentation
              • Geographical insights
              • Competitive landscape

              Interested in this report?

              Get your sample now to see our research methodology and insights!

              Download Now

              Frequently Asked Questions

              Catalyst market growth will increase by $ 4973 mn during 2024-2028 .

              The Catalyst market is expected to grow at a CAGR of 3.6% during 2024-2028 .

              Catalyst market is segmented by Type( Heterogeneous catalyst, Homogeneous catalyst) Raw Material( Metals (Precious Metals, Base Metals), Zeolites, Chemical Compounds, Ceramics, Others)

              Albemarle Corporation, BASF SE, Clariant AG, Evonik Industries AG, ExxonMobil Corporation, Grace (W. R. Grace & Co.), Haldor Topsøe A/S, Honeywell International Inc., Johnson Matthey Plc, Kawaken Fine Chemicals Co., Ltd., Mitsui Chemicals, Inc., Nanostart AG, Novozymes A/S, PQ Corporation, Sinopec Group, Solvay S.A., Sumitomo Chemical Co., Ltd., UOP LLC (Honeywell), Zeolyst International (PQ Corporation, Catalysts & Chemicals Industries Co., Ltd.), Zhejiang Hailiang Co., Ltd. are a few of the key vendors in the Catalyst market.

              APAC will register the highest growth rate of 36% among the other regions. Therefore, the Catalyst market in APAC is expected to garner significant business opportunities for the vendors during the forecast period.

              US, Canada, Germany, UK, Italy, France, China, India, Japan, Brazil, Egypt, UAE, Oman, Argentina, KSA, UAE, Brazil, Rest of World (ROW)

              • Rising rate of industrialization in emerging economiesCatalysts are used in various industries is the driving factor this market.
              • including oil and gas is the driving factor this market.
              • polymer synthesis is the driving factor this market.
              • chemicals is the driving factor this market.
              • and consumer goods. The growth of the market in focus is highly influenced by the growing rate of industrialization across the world is the driving factor this market.
              • especially in emerging economies.APAC comprises emerging economies such as India is the driving factor this market.
              • China is the driving factor this market.
              • Indonesia is the driving factor this market.
              • Malaysia is the driving factor this market.
              • and Thailand is the driving factor this market.
              • which are growing at a significant rate in terms of development and economic prosperity. China and India have become the most preferred hubs of many manufacturers is the driving factor this market.
              • especially automobile manufacturers. The economies of these countries are receiving enormous foreign direct investments is the driving factor this market.
              • which would positively trigger economic growth during the forecast period.The rising population of the economies in APAC is the driving factor this market.
              • such as India and China is the driving factor this market.
              • coupled with the increasing disposable income is the driving factor this market.
              • has compelled major manufacturers to set up their production facilities in the region. The automotive industry in the region is displaying remarkable growth due to the increasing demand for automobiles in India and China. The demand for catalysts is anticipated to grow during the forecast period is the driving factor this market.
              • especially in emerging economies is the driving factor this market.
              • because of the increasing production activities and outsourcing to low-cost countries by chemical manufacturers to decrease capital investment. The rising number of consumer goods companies and polymer production companies in APAC is another factor that will significantly trigger the demand for catalysts used in these industries during the forecast period. Therefore is the driving factor this market.
              • rapid industrialization in emerging economies is likely to drive the growth of the global catalyst market during the forecast period. is the driving factor this market.

              The Catalyst market vendors should focus on grabbing business opportunities from the Heterogeneous catalyst segment as it accounted for the largest market share in the base year.