Single Axis Solar PV Tracker Market Analysis, Size, and Forecast 2026-2030: North America (US, Canada, and Mexico), Europe (Spain, Germany, and Italy), APAC (China, India, and Australia), South America (Brazil, Chile, and Argentina), Middle East and Africa (Saudi Arabia, UAE, and South Africa), and Rest of World (ROW)

Single Axis Solar PV Tracker Market Analysis, Size, and Forecast 2026-2030:
North America (US, Canada, and Mexico), Europe (Spain, Germany, and Italy), APAC (China, India, and Australia), South America (Brazil, Chile, and Argentina), Middle East and Africa (Saudi Arabia, UAE, and South Africa), and Rest of World (ROW)

Published: Oct 2026 291 Pages SKU: IRTNTR41547

Market Overview at a Glance

$14.92 B
Market Opportunity
19.1%
CAGR 2025 - 2030
36.4%
North America Growth
$7.25 B
Utility segment 2024

Single Axis Solar Pv Tracker Market Size 2026-2030

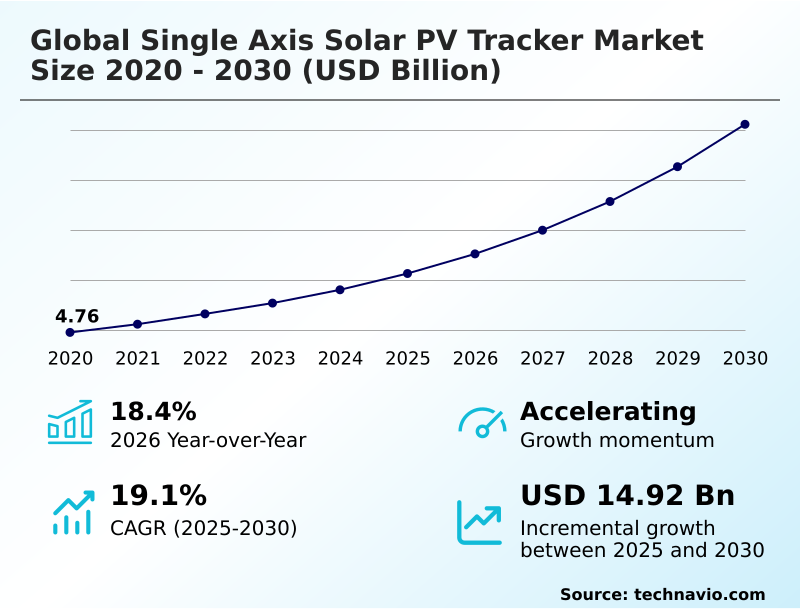
The single axis solar pv tracker market size is valued to increase by USD 14.92 billion, at a CAGR of 19.1% from 2025 to 2030. Accelerating expansion of utility scale projects will drive the single axis solar pv tracker market.

Major Market Trends & Insights

  • North America dominated the market and accounted for a 36.4% growth during the forecast period.
  • By Application - Utility segment was valued at USD 7.25 billion in 2024
  • By Type - Horizontal type segment accounted for the largest market revenue share in 2024

Market Size & Forecast

  • Market Opportunities: USD 20.81 billion
  • Market Future Opportunities: USD 14.92 billion
  • CAGR from 2025 to 2030 : 19.1%

Market Summary

  • The Single Axis Solar PV Tracker sector demonstrates aggressive operational expansion as independent power producers maximize clean energy generation. By continuously orienting photovoltaic modules toward the sun, these mechanical systems enhance energy capture efficiency by up to 25% over traditional fixed-tilt structures.
  • From an operational perspective, energy developers utilize ground mounted power plants equipped with intelligent backtracking algorithms to optimize land use and mitigate mutual row shading on irregular topographies. The primary market driver remains the rapid acceleration of utility-scale solar projects, which compels infrastructure funds to deploy advanced microclimatic sensor arrays to secure predictable, long-term power purchase agreements.
  • Conversely, structural vulnerabilities exposed by extreme weather present a significant operational challenge. High-velocity wind events necessitate rapid automated stowing mechanisms, as failure to execute these maneuvers can lead to catastrophic asset loss and elevated insurance premiums. As power markets transition to merchant structures, maximizing kilowatt-hour production per acre becomes mandatory for developers aiming to maintain financial viability.
  • By bridging advanced mechanical engineering with sophisticated weather monitoring, solar tracking platforms fundamentally elevate asset profitability across high-irradiance geographical zones.

What will be the Size of the Single Axis Solar Pv Tracker Market during the forecast period?
Get Key Insights on Market Forecast (PDF) Get Free Sample

How is the Single Axis Solar Pv Tracker Market Segmented?

The single axis solar pv tracker industry research report provides comprehensive data (region-wise segment analysis), with forecasts and estimates in "USD million" for the period 2026-2030, as well as historical data from 2020-2024 for the following segments.

  • Application
    • Utility
    • Distributed generation
  • Type
    • Horizontal type
    • Vertical type
  • Technology
    • Photovoltaic
    • Concentrated solar power
    • Concentrator photovoltaic
  • Geography
    • North America
      • US
      • Canada
      • Mexico
    • Europe
      • Spain
      • Germany
      • Italy
      • France
      • UK
      • The Netherlands
    • APAC
      • China
      • India
      • Australia
      • Japan
      • South Korea
      • Indonesia
    • South America
      • Brazil
      • Chile
      • Argentina
    • Middle East and Africa
      • Saudi Arabia
      • UAE
      • South Africa
      • Turkey
      • Israel

By Application Insights

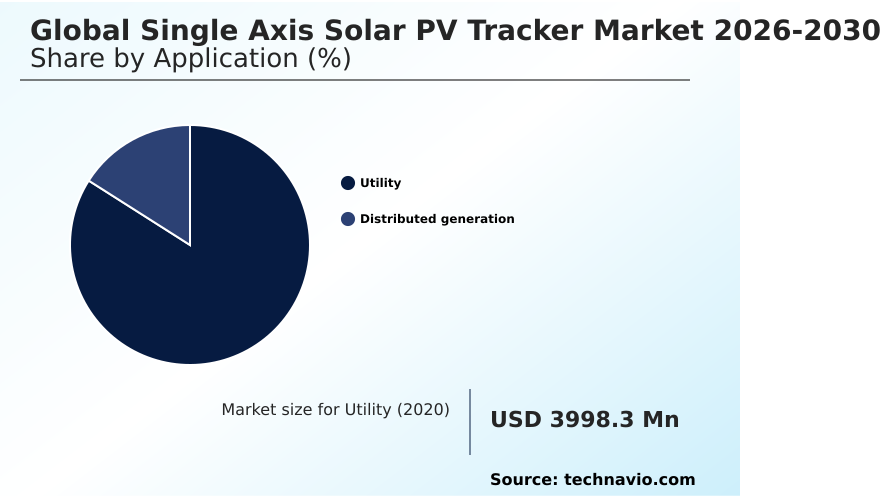
The utility segment is estimated to witness significant growth during the forecast period.

The utility application represents the largest operational segment, fundamentally reshaping large-scale energy generation. Utility operators prioritize these mechanical systems because they effectively maximize sunlight capture, yielding up to a 30% improvement in electricity generation compared to static tilt installations.

This significant efficiency boost directly lowers financial overhead for massive ground mounted power plants. Operations heavily integrate diffuse light optimization and inter row shading mitigation to guarantee consistent power delivery even under overcast conditions.

Additionally, robust mounting clamp engineering and independent row articulation empower tracking arrays to incorporate terrain following mechanisms, navigating undulating landscapes and eliminating expensive land grading. Through advanced concentrated solar power tracking, grid networks achieve a smoothed daily generation curve.

Ultimately, these structural risk management practices optimize power output, aggressively stabilizing regional power grids.
Get Free Sample

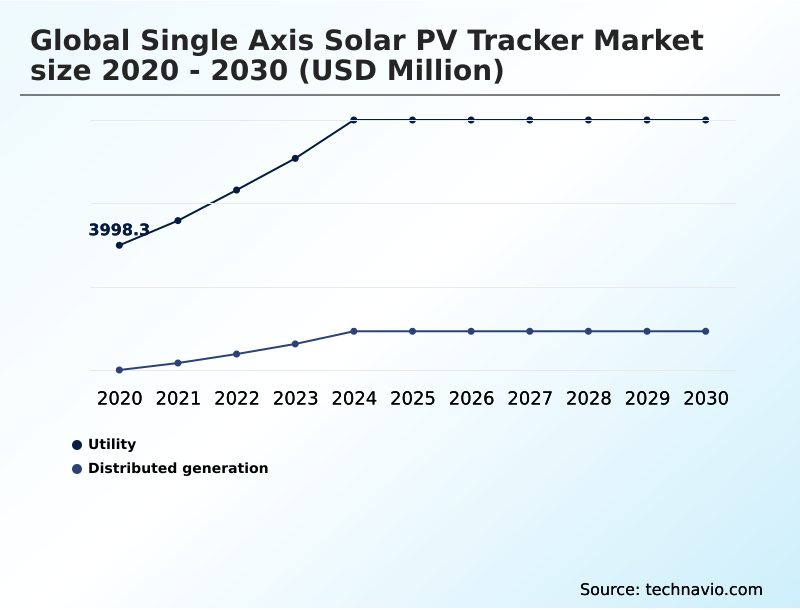
The Utility segment was valued at USD 7.25 billion in 2024 and showed a gradual increase during the forecast period.
Get Free Sample

Regional Analysis

North America is estimated to contribute 36.4% to the growth of the global market during the forecast period.Technavio’s analysts have elaborately explained the regional trends and drivers that shape the market during the forecast period.
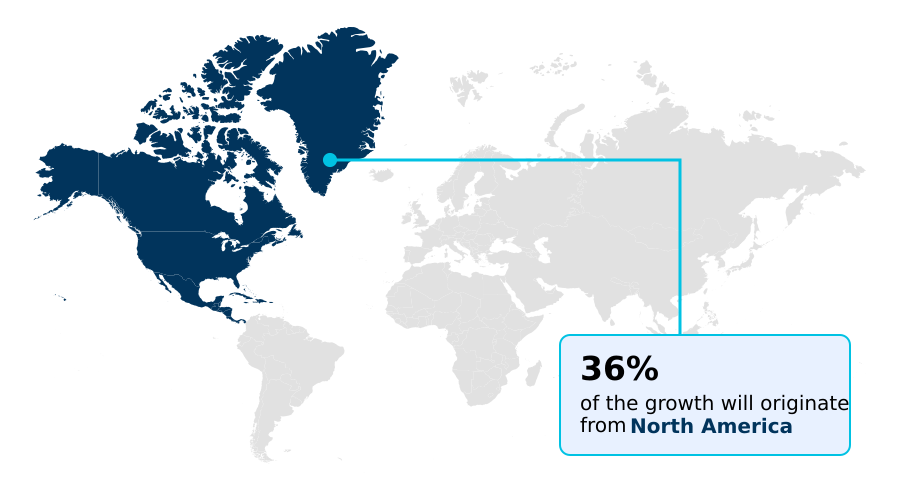
See How Single Axis Solar Pv Tracker Market Demand is Rising in North America Get Free Sample

The adoption landscape reveals distinct operational contrasts between North American and APAC deployment strategies.

North American developers heavily prioritize bifacial photovoltaic modules paired with real time weather tracking to absorb reflected albedo, achieving a 15% reduction in levelized cost of energy across extreme climates.

These expansive installations rely on high torque actuators and pile driven foundations targeting optimal ground coverage ratios, lowering installation overhead.

Conversely, APAC markets encounter intense land scarcity, prompting a strategic pivot toward elevated dual use agrivoltaic structures and localized distributed generation microgrids.

By integrating these systems, APAC agricultural sectors maintain crop yields while boosting site peak power density efficiency by over 20%.

Both regions heavily capitalize on high direct normal irradiance to justify tracking capital expenditures, utilizing highly customized structural geometries to maximize local power generation yields.

Market Dynamics

Our researchers analyzed the data with 2025 as the base year, along with the key drivers, trends, and challenges. A holistic analysis of drivers will help companies refine their marketing strategies to gain a competitive advantage.

  • The architectural evolution within the Single Axis Solar PV Tracker industry is increasingly defined by the necessity to maintain peak operational efficiency under variable atmospheric and environmental conditions. Facility operators are aggressively pursuing optimal tilt angle diffuse radiation capture to maximize power output during overcast periods, significantly lifting daily generation profiles.
  • As utility installations expand into high-wind coastal and desert regions, mitigating aeroelastic galloping tracker rows has become a critical engineering priority. By deploying heavy-duty dampers and reinforced drive mechanisms, asset managers can reduce wind-induced structural fatigue by roughly 30%, ensuring uninterrupted power generation during severe meteorological events.
  • Furthermore, the transition toward utility scale bifacial module tracking requires specialized mounting frameworks that minimize rear-side structural shading, thereby maximizing reflected ground albedo absorption. This optical synergy directly impacts compliance with strict corporate energy yield targets. To streamline civil engineering workflows and bypass labor-intensive site preparations, developers are heavily investing in self powered wireless tracker architectures.
  • Eliminating extensive underground communication trenching accelerates project execution speed and cuts balance-of-system labor hours compared to traditional hardwired configurations. When severe storms approach, integrating responsive automated wind stow protection systems provides an essential defensive posture. These predictive sensor networks rapidly command panel rows into a safe tilt, drastically lowering the probability of module microcracking or catastrophic detachment.
  • Through these sophisticated hardware and software integrations, energy providers effectively secure their capital assets while satisfying rigorous performance mandates.
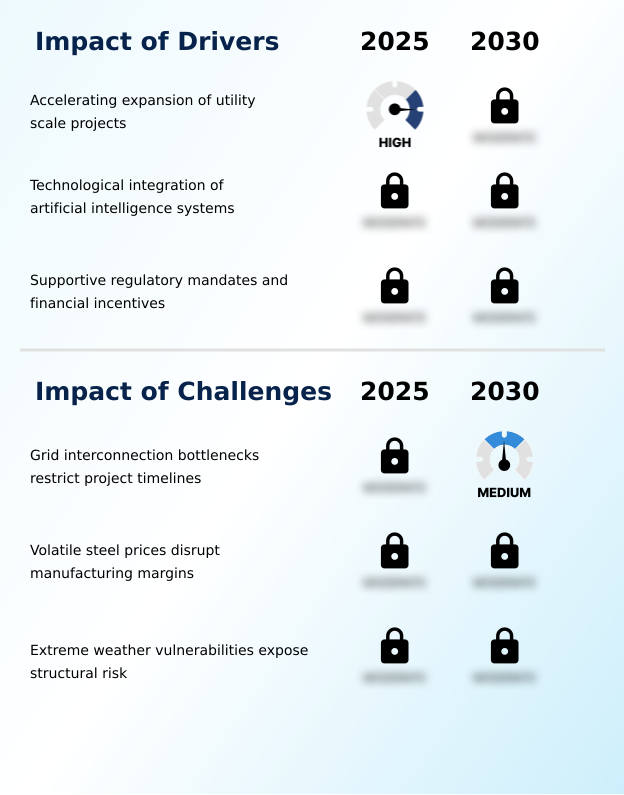
What are the key market drivers leading to the rise in the adoption of Single Axis Solar Pv Tracker Industry?

  • The accelerating expansion of utility-scale projects serves as the primary market driver, driven by the global mandate to meet rising electricity demand while achieving ambitious decarbonization targets.

  • The aggressive deployment of utility scale arrays serves as the principal catalyst for the mechanical mounting industry, driven by the mandate to maximize green energy harvest.
  • To guarantee optimal solar radiation optimization, asset owners are heavily embedding intelligent control units equipped with predictive smart algorithms.
  • This software integration facilitates substantial capacity factor enhancement, allowing facilities to increase total daily energy output by up to 20% compared to stationary frameworks.
  • Modern installations actively rely on high-grade balance of system components and advanced microclimatic sensor arrays to detect incoming weather hazards. This triggers rapid-response automated stow modes, proactively securing massive capital assets.
  • By minimizing catastrophic damage and enhancing extreme weather resilience, developers effectively lower insurance premiums, ensuring uninterrupted revenue generation required by long-term power purchase agreements.

What are the market trends shaping the Single Axis Solar Pv Tracker Industry?

  • Repowering legacy assets drives tracker upgrades, representing an upcoming market trend. Operators are systematically modernizing aging solar infrastructure to restore operational efficiency without requiring new land acquisitions.

  • The adoption of decentralized mechanical architectures is fundamentally transforming site construction methodologies. Traditional centralized tracking platforms are rapidly being replaced by self powered drive systems that integrate a localized lithium energy storage unit and wireless mesh communication nodes at every structurally independent row.
  • This architectural leap achieves complete underground trenching elimination, actively reducing civil engineering labor costs by nearly 25% and accelerating site preparation. By isolating the single horizontal axis control linkages, engineering contractors can easily execute brownfield solar modernization without digging new cable trenches.
  • Advanced backtracking algorithms seamlessly prevent shadow casting on adjacent rows, while heavily reinforced structural torque tubes mounted on galvanized support piles dramatically improve structural fatigue resistance. This modular approach preserves aggressive project execution schedules, allowing operators to navigate unstable terrains effortlessly.

What challenges does the Single Axis Solar Pv Tracker Industry face during its growth?

  • Grid interconnection bottlenecks restrict project timelines, acting as a critical challenge that creates financial friction and delays asset deployment across the renewable energy sector.

  • Severe logistical and mechanical bottlenecks restrict the seamless deployment of renewable tracking infrastructure. Prolonged grid interconnection timelines continually stall project completions, creating significant financial friction that strands capital and disrupts long-term merchant power structures. Simultaneously, the physical integrity of these installations is constantly threatened by extreme atmospheric forces, making aeroelastic galloping prevention and torsional flutter mitigation critical engineering mandates.
  • Without integrating heavy duty dampers, rapid response tracking controls, and reinforced drive gearboxes alongside durable slewing bearings, facilities risk up to a 40% increase in structural damage during high-wind events. Furthermore, increasing regulatory pressure regarding supply chain carbon intensity forces manufacturers to transition toward low carbon steel racking.
  • This mandatory material shift temporarily elevates procurement costs by nearly 15%, intensely squeezing profit margins for engineering contractors.

Exclusive Technavio Analysis on Customer Landscape

The single axis solar pv tracker market forecasting report includes the adoption lifecycle of the market, covering from the innovator’s stage to the laggard’s stage. It focuses on adoption rates in different regions based on penetration. Furthermore, the single axis solar pv tracker market report also includes key purchase criteria and drivers of price sensitivity to help companies evaluate and develop their market growth analysis strategies.
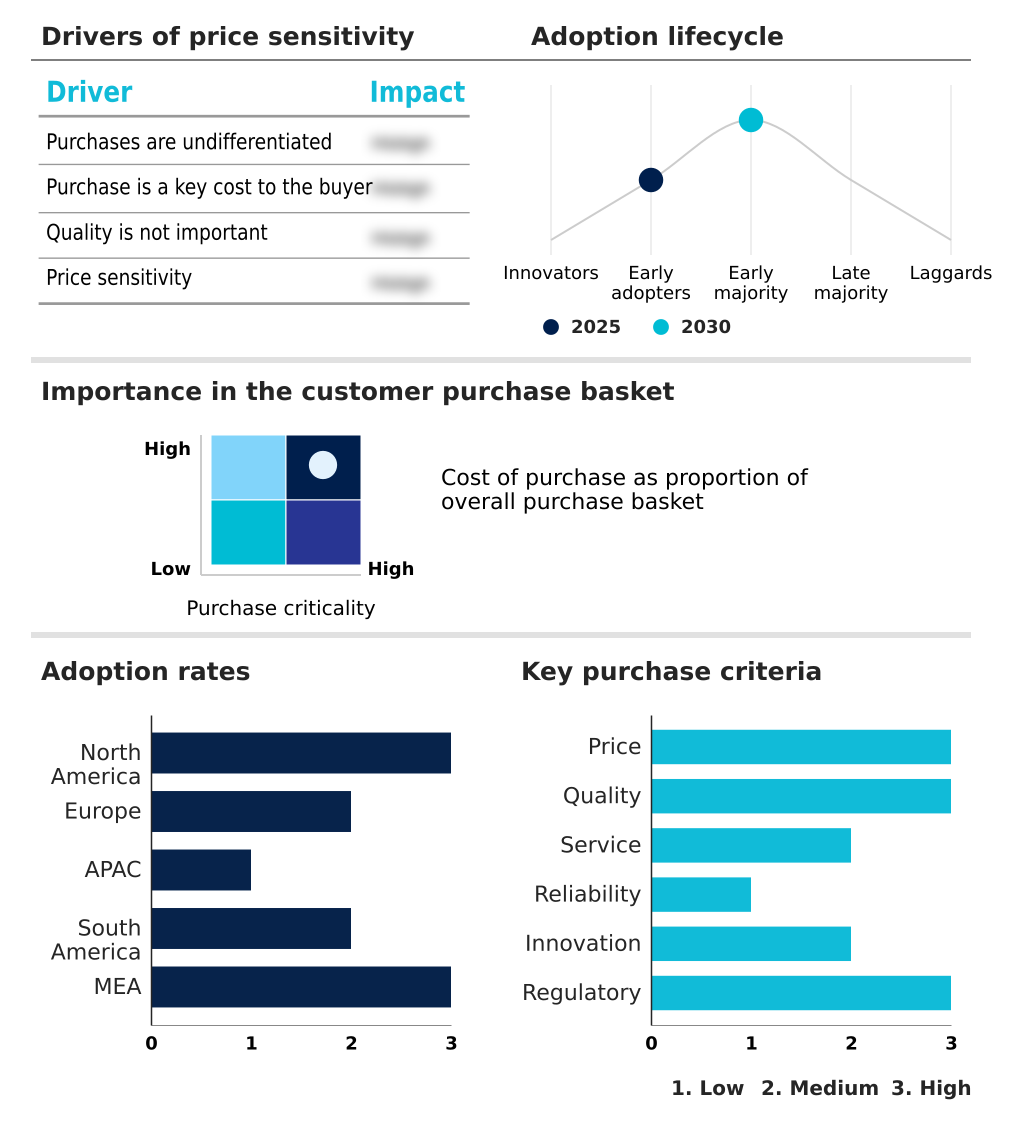
Customer Landscape of Single Axis Solar Pv Tracker Industry

Competitive Landscape

Companies are implementing various strategies, such as strategic alliances, single axis solar pv tracker market forecast, partnerships, mergers and acquisitions, geographical expansion, and product/service launches, to enhance their presence in the industry.

Antaisolar - The vendor delivers advanced single axis solar PV tracker solutions, featuring intelligent control software and terrain-following architecture to optimize energy yield and enhance structural resilience across utility-scale photovoltaic installations.

The industry research and growth report includes detailed analyses of the competitive landscape of the market and information about key companies, including:

  • Antaisolar
  • ArcelorMittal S.A.
  • Arctech Solar
  • Array Technologies Inc.
  • First Solar Inc.
  • GameChange Solar
  • IDEEMATEC Germany GmbH
  • Kinsend
  • Mahindra Susten Pvt. Ltd.
  • Nevados Engineering Inc.
  • NEXtracker Inc.
  • PI Berlin
  • PV Hardware Solutions SLU
  • Schletter Solar GmbH
  • Scorpius Trackers Pvt. Ltd.
  • Solar Steel
  • Soltec Power Holdings S.A.
  • Sun Action Trackers LLC
  • Sungrow Power Supply Co. Ltd.
  • TBEA Co. Ltd.
  • Trina Solar Co. Ltd.
  • Valmont Industries Inc.
  • Versolsolar

Qualitative and quantitative analysis of companies has been conducted to help clients understand the wider business environment as well as the strengths and weaknesses of key industry players. Data is qualitatively analyzed to categorize companies as pure play, category-focused, industry-focused, and diversified; it is quantitatively analyzed to categorize companies as dominant, leading, strong, tentative, and weak.

Recent Development and News in Single axis solar pv tracker market

  • In the Oil and Gas Equipment and Services industry, the strategic pivot toward decarbonizing field operations has accelerated investments in off-grid renewable microgrids, directly impacting Single Axis Solar PV Tracker demand by necessitating robust, standalone solar tracking systems to power remote extraction sites.
  • The widespread adoption of predictive maintenance software and industrial IoT sensors across oilfield equipment has established rigorous digital monitoring standards, compelling Single Axis Solar PV Tracker manufacturers to integrate advanced microclimatic sensor arrays and automated stow modes into their control architectures.
  • Stringent Scope 3 emissions regulations impacting the heavy industrial and energy sectors have forced equipment fabricators to source sustainably produced raw materials, increasing the adoption of low carbon steel racking within the Single Axis Solar PV Tracker supply chain.
  • Advances in high-torque actuators and severe-duty slewing bearings originally engineered for offshore drilling platforms have successfully crossed over into renewable infrastructure, enhancing the structural fatigue resistance and mechanical reliability of Single Axis Solar PV Tracker systems deployed in high-wind environments.

Dive into Technavio’s robust research methodology, blending expert interviews, extensive data synthesis, and validated models for unparalleled Single Axis Solar Pv Tracker Market insights. See full methodology.

Market Scope
Page number 291
Base year 2025
Historic period 2020-2024
Forecast period 2026-2030
Growth momentum & CAGR Accelerate at a CAGR of 19.1%
Market growth 2026-2030 USD 14919.9 million
Market structure Fragmented
YoY growth 2025-2026(%) 18.4%
Key countries US, Canada, Mexico, Spain, Germany, Italy, France, UK, The Netherlands, China, India, Australia, Japan, South Korea, Indonesia, Brazil, Chile, Argentina, Saudi Arabia, UAE, South Africa, Turkey and Israel
Competitive landscape Leading Companies, Market Positioning of Companies, Competitive Strategies, and Industry Risks

Request Free Sample

Research Analyst Overview

  • The structural architecture of the Single Axis Solar PV Tracker landscape is evolving as corporate boards integrate environmental resilience into their primary asset management strategies. Energy developers are moving beyond simple solar deployment, strategically mandating extreme weather resilience to secure favorable financing terms and protect long-term revenue streams.
  • By upgrading legacy systems with advanced drive gearboxes and high torque actuators, facility managers have reduced mechanical failure rates by 18%, significantly improving power plant uptime. Furthermore, the integration of severe-duty slewing bearings enables massive tracker rows to rotate smoothly under extreme dynamic loads, directly supporting advanced structural risk management protocols.
  • This technological modernization impacts boardroom-level budgeting, as proactive asset defense dramatically lowers reactive maintenance overhead. When severe meteorological events occur, reliable mechanical actuation ensures panels stow securely, preventing catastrophic losses that frequently plague older, static installations.
  • Ultimately, the deployment of intelligent, heavy-duty tracking mechanisms transforms vulnerable solar fields into highly predictable, bankable infrastructure, ensuring operators consistently meet stringent power generation quotas.

What are the Key Data Covered in this Single Axis Solar Pv Tracker Market Research and Growth Report?

  • What is the expected growth of the Single Axis Solar Pv Tracker Market between 2026 and 2030?

    • USD 14.92 billion, at a CAGR of 19.1%

  • What segmentation does the market report cover?

    • The report is segmented by Application (Utility, and Distributed generation), Type (Horizontal type, and Vertical type), Technology (Photovoltaic, Concentrated solar power, and Concentrator photovoltaic) and Geography (North America, Europe, APAC, South America, Middle East and Africa)

  • Which regions are analyzed in the report?

    • North America, Europe, APAC, South America and Middle East and Africa

  • What are the key growth drivers and market challenges?

    • Accelerating expansion of utility scale projects, Grid interconnection bottlenecks restrict project timelines

  • Who are the major players in the Single Axis Solar Pv Tracker Market?

    • Antaisolar, ArcelorMittal S.A., Arctech Solar, Array Technologies Inc., First Solar Inc., GameChange Solar, IDEEMATEC Germany GmbH, Kinsend, Mahindra Susten Pvt. Ltd., Nevados Engineering Inc., NEXtracker Inc., PI Berlin, PV Hardware Solutions SLU, Schletter Solar GmbH, Scorpius Trackers Pvt. Ltd., Solar Steel, Soltec Power Holdings S.A., Sun Action Trackers LLC, Sungrow Power Supply Co. Ltd., TBEA Co. Ltd., Trina Solar Co. Ltd., Valmont Industries Inc. and Versolsolar

Market Research Insights

  • The Single Axis Solar PV Tracker environment is rapidly advancing as project developers prioritize maximum volumetric energy efficiency and spatial optimization. Adopting these systems enhances solar radiation optimization, driving a 20% improvement in energy capture during early morning and late afternoon hours compared to fixed alternatives.
  • This sustained generation effectively lowers the levelized cost of energy, improving overall project return on investment by roughly 15%. Modern tracking architectures incorporate robust structural torque tubes and terrain following mechanisms, which reduce pre-construction land grading expenses by over 10%.
  • By actively adapting to undulating landscapes and securing panels against extreme wind loads, these integrated structural solutions empower utility operators to safeguard capital assets while fulfilling strict clean energy mandates.

We can help! Our analysts can customize this single axis solar pv tracker market research report to meet your requirements.

Get in touch

1. Executive Summary

1.1 Market overview

Executive Summary - Chart on Market Overview
Executive Summary - Data Table on Market Overview
Executive Summary - Chart on Global Market Characteristics
Executive Summary - Chart on Market by Geography
Executive Summary - Chart on Market Segmentation by Application
Executive Summary - Chart on Market Segmentation by Type
Executive Summary - Chart on Market Segmentation by Technology
Executive Summary - Chart on Incremental Growth
Executive Summary - Data Table on Incremental Growth
Executive Summary - Chart on Company Market Positioning

2. Technavio Analysis

2.1 Analysis of price sensitivity, lifecycle, customer purchase basket, adoption rates, and purchase criteria

2.2 Criticality of inputs and Factors of differentiation

Chart on Overview on criticality of inputs and factors of differentiation

2.3 Factors of disruption

Chart on Overview on factors of disruption

2.4 Impact of drivers and challenges

Chart on Impact of drivers and challenges in 2025 and 2030

3. Market Landscape

3.1 Market ecosystem

Chart on Parent Market
Data Table on - Parent Market

3.2 Market characteristics

Chart on Market characteristics analysis

3.3 Value chain analysis

Chart on Value chain analysis

4. Market Sizing

4.1 Market definition

Data Table on Offerings of companies included in the market definition

4.2 Market segment analysis

Market segments

4.3 Market size 2025

4.4 Market outlook: Forecast for 2025-2030

Chart on Global - Market size and forecast 2025-2030 ($ million)
Data Table on Global - Market size and forecast 2025-2030 ($ million)
Chart on Global Market: Year-over-year growth 2025-2030 (%)
Data Table on Global Market: Year-over-year growth 2025-2030 (%)

5. Historic Market Size

5.1 Global Single Axis Solar PV Tracker Market 2020 - 2024

Historic Market Size - Data Table on Global Single Axis Solar PV Tracker Market 2020 - 2024 ($ million)

5.2 Application segment analysis 2020 - 2024

Historic Market Size - Application Segment 2020 - 2024 ($ million)

5.3 Type segment analysis 2020 - 2024

Historic Market Size - Type Segment 2020 - 2024 ($ million)

5.4 Technology segment analysis 2020 - 2024

Historic Market Size - Technology Segment 2020 - 2024 ($ million)

5.5 Geography segment analysis 2020 - 2024

Historic Market Size - Geography Segment 2020 - 2024 ($ million)

5.6 Country segment analysis 2020 - 2024

Historic Market Size - Country Segment 2020 - 2024 ($ million)

6. Qualitative Analysis

6.1 Impact of AI on Global Single Axis Solar PV Tracker Market

6.2 Impact of geopolitical conflicts on Global Single Axis Solar PV Tracker Market

7. Five Forces Analysis

7.1 Five forces summary

Five forces analysis - Comparison between 2025 and 2030

7.2 Bargaining power of buyers

Bargaining power of buyers - Impact of key factors 2025 and 2030

7.3 Bargaining power of suppliers

Bargaining power of suppliers - Impact of key factors in 2025 and 2030

7.4 Threat of new entrants

Threat of new entrants - Impact of key factors in 2025 and 2030

7.5 Threat of substitutes

Threat of substitutes - Impact of key factors in 2025 and 2030

7.6 Threat of rivalry

Threat of rivalry - Impact of key factors in 2025 and 2030

7.7 Market condition

Chart on Market condition - Five forces 2025 and 2030

8. Market Segmentation by Application

8.1 Market segments

Chart on Application - Market share 2025-2030 (%)
Data Table on Application - Market share 2025-2030 (%)

8.2 Comparison by Application

Chart on Comparison by Application
Data Table on Comparison by Application

8.3 Utility - Market size and forecast 2025-2030

Chart on Utility - Market size and forecast 2025-2030 ($ million)
Data Table on Utility - Market size and forecast 2025-2030 ($ million)
Chart on Utility - Year-over-year growth 2025-2030 (%)
Data Table on Utility - Year-over-year growth 2025-2030 (%)

8.4 Distributed generation - Market size and forecast 2025-2030

Chart on Distributed generation - Market size and forecast 2025-2030 ($ million)
Data Table on Distributed generation - Market size and forecast 2025-2030 ($ million)
Chart on Distributed generation - Year-over-year growth 2025-2030 (%)
Data Table on Distributed generation - Year-over-year growth 2025-2030 (%)

8.5 Market opportunity by Application

Market opportunity by Application ($ million)
Data Table on Market opportunity by Application ($ million)

9. Market Segmentation by Type

9.1 Market segments

Chart on Type - Market share 2025-2030 (%)
Data Table on Type - Market share 2025-2030 (%)

9.2 Comparison by Type

Chart on Comparison by Type
Data Table on Comparison by Type

9.3 Horizontal type - Market size and forecast 2025-2030

Chart on Horizontal type - Market size and forecast 2025-2030 ($ million)
Data Table on Horizontal type - Market size and forecast 2025-2030 ($ million)
Chart on Horizontal type - Year-over-year growth 2025-2030 (%)
Data Table on Horizontal type - Year-over-year growth 2025-2030 (%)

9.4 Vertical type - Market size and forecast 2025-2030

Chart on Vertical type - Market size and forecast 2025-2030 ($ million)
Data Table on Vertical type - Market size and forecast 2025-2030 ($ million)
Chart on Vertical type - Year-over-year growth 2025-2030 (%)
Data Table on Vertical type - Year-over-year growth 2025-2030 (%)

9.5 Market opportunity by Type

Market opportunity by Type ($ million)
Data Table on Market opportunity by Type ($ million)

10. Market Segmentation by Technology

10.1 Market segments

Chart on Technology - Market share 2025-2030 (%)
Data Table on Technology - Market share 2025-2030 (%)

10.2 Comparison by Technology

Chart on Comparison by Technology
Data Table on Comparison by Technology

10.3 Photovoltaic - Market size and forecast 2025-2030

Chart on Photovoltaic - Market size and forecast 2025-2030 ($ million)
Data Table on Photovoltaic - Market size and forecast 2025-2030 ($ million)
Chart on Photovoltaic - Year-over-year growth 2025-2030 (%)
Data Table on Photovoltaic - Year-over-year growth 2025-2030 (%)

10.4 Concentrated solar power - Market size and forecast 2025-2030

Chart on Concentrated solar power - Market size and forecast 2025-2030 ($ million)
Data Table on Concentrated solar power - Market size and forecast 2025-2030 ($ million)
Chart on Concentrated solar power - Year-over-year growth 2025-2030 (%)
Data Table on Concentrated solar power - Year-over-year growth 2025-2030 (%)

10.5 Concentrator photovoltaic - Market size and forecast 2025-2030

Chart on Concentrator photovoltaic - Market size and forecast 2025-2030 ($ million)
Data Table on Concentrator photovoltaic - Market size and forecast 2025-2030 ($ million)
Chart on Concentrator photovoltaic - Year-over-year growth 2025-2030 (%)
Data Table on Concentrator photovoltaic - Year-over-year growth 2025-2030 (%)

10.6 Market opportunity by Technology

Market opportunity by Technology ($ million)
Data Table on Market opportunity by Technology ($ million)

11. Customer Landscape

11.1 Customer landscape overview

Analysis of price sensitivity, lifecycle, customer purchase basket, adoption rates, and purchase criteria

12. Geographic Landscape

12.1 Geographic segmentation

Chart on Market share by geography 2025-2030 (%)
Data Table on Market share by geography 2025-2030 (%)

12.2 Geographic comparison

Chart on Geographic comparison
Data Table on Geographic comparison

12.3 North America - Market size and forecast 2025-2030

Chart on North America - Market size and forecast 2025-2030 ($ million)
Data Table on North America - Market size and forecast 2025-2030 ($ million)
Chart on North America - Year-over-year growth 2025-2030 (%)
Data Table on North America - Year-over-year growth 2025-2030 (%)
Chart on Regional Comparison - North America
Data Table on Regional Comparison - North America

12.3.1 US - Market size and forecast 2025-2030

Chart on US - Market size and forecast 2025-2030 ($ million)
Data Table on US - Market size and forecast 2025-2030 ($ million)
Chart on US - Year-over-year growth 2025-2030 (%)
Data Table on US - Year-over-year growth 2025-2030 (%)

12.3.2 Canada - Market size and forecast 2025-2030

Chart on Canada - Market size and forecast 2025-2030 ($ million)
Data Table on Canada - Market size and forecast 2025-2030 ($ million)
Chart on Canada - Year-over-year growth 2025-2030 (%)
Data Table on Canada - Year-over-year growth 2025-2030 (%)

12.3.3 Mexico - Market size and forecast 2025-2030

Chart on Mexico - Market size and forecast 2025-2030 ($ million)
Data Table on Mexico - Market size and forecast 2025-2030 ($ million)
Chart on Mexico - Year-over-year growth 2025-2030 (%)
Data Table on Mexico - Year-over-year growth 2025-2030 (%)

12.4 Europe - Market size and forecast 2025-2030

Chart on Europe - Market size and forecast 2025-2030 ($ million)
Data Table on Europe - Market size and forecast 2025-2030 ($ million)
Chart on Europe - Year-over-year growth 2025-2030 (%)
Data Table on Europe - Year-over-year growth 2025-2030 (%)
Chart on Regional Comparison - Europe
Data Table on Regional Comparison - Europe

12.4.1 Spain - Market size and forecast 2025-2030

Chart on Spain - Market size and forecast 2025-2030 ($ million)
Data Table on Spain - Market size and forecast 2025-2030 ($ million)
Chart on Spain - Year-over-year growth 2025-2030 (%)
Data Table on Spain - Year-over-year growth 2025-2030 (%)

12.4.2 Germany - Market size and forecast 2025-2030

Chart on Germany - Market size and forecast 2025-2030 ($ million)
Data Table on Germany - Market size and forecast 2025-2030 ($ million)
Chart on Germany - Year-over-year growth 2025-2030 (%)
Data Table on Germany - Year-over-year growth 2025-2030 (%)

12.4.3 Italy - Market size and forecast 2025-2030

Chart on Italy - Market size and forecast 2025-2030 ($ million)
Data Table on Italy - Market size and forecast 2025-2030 ($ million)
Chart on Italy - Year-over-year growth 2025-2030 (%)
Data Table on Italy - Year-over-year growth 2025-2030 (%)

12.4.4 France - Market size and forecast 2025-2030

Chart on France - Market size and forecast 2025-2030 ($ million)
Data Table on France - Market size and forecast 2025-2030 ($ million)
Chart on France - Year-over-year growth 2025-2030 (%)
Data Table on France - Year-over-year growth 2025-2030 (%)

12.4.5 UK - Market size and forecast 2025-2030

Chart on UK - Market size and forecast 2025-2030 ($ million)
Data Table on UK - Market size and forecast 2025-2030 ($ million)
Chart on UK - Year-over-year growth 2025-2030 (%)
Data Table on UK - Year-over-year growth 2025-2030 (%)

12.4.6 The Netherlands - Market size and forecast 2025-2030

Chart on The Netherlands - Market size and forecast 2025-2030 ($ million)
Data Table on The Netherlands - Market size and forecast 2025-2030 ($ million)
Chart on The Netherlands - Year-over-year growth 2025-2030 (%)
Data Table on The Netherlands - Year-over-year growth 2025-2030 (%)

12.5 APAC - Market size and forecast 2025-2030

Chart on APAC - Market size and forecast 2025-2030 ($ million)
Data Table on APAC - Market size and forecast 2025-2030 ($ million)
Chart on APAC - Year-over-year growth 2025-2030 (%)
Data Table on APAC - Year-over-year growth 2025-2030 (%)
Chart on Regional Comparison - APAC
Data Table on Regional Comparison - APAC

12.5.1 China - Market size and forecast 2025-2030

Chart on China - Market size and forecast 2025-2030 ($ million)
Data Table on China - Market size and forecast 2025-2030 ($ million)
Chart on China - Year-over-year growth 2025-2030 (%)
Data Table on China - Year-over-year growth 2025-2030 (%)

12.5.2 India - Market size and forecast 2025-2030

Chart on India - Market size and forecast 2025-2030 ($ million)
Data Table on India - Market size and forecast 2025-2030 ($ million)
Chart on India - Year-over-year growth 2025-2030 (%)
Data Table on India - Year-over-year growth 2025-2030 (%)

12.5.3 Australia - Market size and forecast 2025-2030

Chart on Australia - Market size and forecast 2025-2030 ($ million)
Data Table on Australia - Market size and forecast 2025-2030 ($ million)
Chart on Australia - Year-over-year growth 2025-2030 (%)
Data Table on Australia - Year-over-year growth 2025-2030 (%)

12.5.4 Japan - Market size and forecast 2025-2030

Chart on Japan - Market size and forecast 2025-2030 ($ million)
Data Table on Japan - Market size and forecast 2025-2030 ($ million)
Chart on Japan - Year-over-year growth 2025-2030 (%)
Data Table on Japan - Year-over-year growth 2025-2030 (%)

12.5.5 South Korea - Market size and forecast 2025-2030

Chart on South Korea - Market size and forecast 2025-2030 ($ million)
Data Table on South Korea - Market size and forecast 2025-2030 ($ million)
Chart on South Korea - Year-over-year growth 2025-2030 (%)
Data Table on South Korea - Year-over-year growth 2025-2030 (%)

12.5.6 Indonesia - Market size and forecast 2025-2030

Chart on Indonesia - Market size and forecast 2025-2030 ($ million)
Data Table on Indonesia - Market size and forecast 2025-2030 ($ million)
Chart on Indonesia - Year-over-year growth 2025-2030 (%)
Data Table on Indonesia - Year-over-year growth 2025-2030 (%)

12.6 South America - Market size and forecast 2025-2030

Chart on South America - Market size and forecast 2025-2030 ($ million)
Data Table on South America - Market size and forecast 2025-2030 ($ million)
Chart on South America - Year-over-year growth 2025-2030 (%)
Data Table on South America - Year-over-year growth 2025-2030 (%)
Chart on Regional Comparison - South America
Data Table on Regional Comparison - South America

12.6.1 Brazil - Market size and forecast 2025-2030

Chart on Brazil - Market size and forecast 2025-2030 ($ million)
Data Table on Brazil - Market size and forecast 2025-2030 ($ million)
Chart on Brazil - Year-over-year growth 2025-2030 (%)
Data Table on Brazil - Year-over-year growth 2025-2030 (%)

12.6.2 Chile - Market size and forecast 2025-2030

Chart on Chile - Market size and forecast 2025-2030 ($ million)
Data Table on Chile - Market size and forecast 2025-2030 ($ million)
Chart on Chile - Year-over-year growth 2025-2030 (%)
Data Table on Chile - Year-over-year growth 2025-2030 (%)

12.6.3 Argentina - Market size and forecast 2025-2030

Chart on Argentina - Market size and forecast 2025-2030 ($ million)
Data Table on Argentina - Market size and forecast 2025-2030 ($ million)
Chart on Argentina - Year-over-year growth 2025-2030 (%)
Data Table on Argentina - Year-over-year growth 2025-2030 (%)

12.7 Middle East and Africa - Market size and forecast 2025-2030

Chart on Middle East and Africa - Market size and forecast 2025-2030 ($ million)
Data Table on Middle East and Africa - Market size and forecast 2025-2030 ($ million)
Chart on Middle East and Africa - Year-over-year growth 2025-2030 (%)
Data Table on Middle East and Africa - Year-over-year growth 2025-2030 (%)
Chart on Regional Comparison - Middle East and Africa
Data Table on Regional Comparison - Middle East and Africa

12.7.1 Saudi Arabia - Market size and forecast 2025-2030

Chart on Saudi Arabia - Market size and forecast 2025-2030 ($ million)
Data Table on Saudi Arabia - Market size and forecast 2025-2030 ($ million)
Chart on Saudi Arabia - Year-over-year growth 2025-2030 (%)
Data Table on Saudi Arabia - Year-over-year growth 2025-2030 (%)

12.7.2 UAE - Market size and forecast 2025-2030

Chart on UAE - Market size and forecast 2025-2030 ($ million)
Data Table on UAE - Market size and forecast 2025-2030 ($ million)
Chart on UAE - Year-over-year growth 2025-2030 (%)
Data Table on UAE - Year-over-year growth 2025-2030 (%)

12.7.3 South Africa - Market size and forecast 2025-2030

Chart on South Africa - Market size and forecast 2025-2030 ($ million)
Data Table on South Africa - Market size and forecast 2025-2030 ($ million)
Chart on South Africa - Year-over-year growth 2025-2030 (%)
Data Table on South Africa - Year-over-year growth 2025-2030 (%)

12.7.4 Turkey - Market size and forecast 2025-2030

Chart on Turkey - Market size and forecast 2025-2030 ($ million)
Data Table on Turkey - Market size and forecast 2025-2030 ($ million)
Chart on Turkey - Year-over-year growth 2025-2030 (%)
Data Table on Turkey - Year-over-year growth 2025-2030 (%)

12.7.5 Israel - Market size and forecast 2025-2030

Chart on Israel - Market size and forecast 2025-2030 ($ million)
Data Table on Israel - Market size and forecast 2025-2030 ($ million)
Chart on Israel - Year-over-year growth 2025-2030 (%)
Data Table on Israel - Year-over-year growth 2025-2030 (%)

12.8 Market opportunity by geography

Market opportunity by geography ($ million)
Data Tables on Market opportunity by geography ($ million)

13. Drivers, Challenges, and Opportunity

13.1 Market drivers

Accelerating expansion of utility scale projects
Technological integration of artificial intelligence systems
Supportive regulatory mandates and financial incentives

13.2 Market challenges

Grid interconnection bottlenecks restrict project timelines
Volatile steel prices disrupt manufacturing margins
Extreme weather vulnerabilities expose structural risk

13.3 Impact of drivers and challenges

Impact of drivers and challenges in 2025 and 2030

13.4 Market opportunities

Repowering legacy assets drives tracker upgrades
Low carbon steel transforming tracker manufacturing
Self-powered wireless systems enhancing reliability

14. Competitive Landscape

14.1 Overview

14.2

Overview on criticality of inputs and factors of differentiation

14.3 Landscape disruption

Overview on factors of disruption

14.4 Industry risks

Impact of key risks on business

15. Competitive Analysis

15.1 Companies profiled

Companies covered

15.2 Company ranking index

15.3 Market positioning of companies

Matrix on companies position and classification

15.4 Antaisolar

Antaisolar - Overview
Antaisolar - Product / Service
Antaisolar - Key offerings
SWOT

15.5 ArcelorMittal S.A.

ArcelorMittal S.A. - Overview
ArcelorMittal S.A. - Business segments
ArcelorMittal S.A. - Key offerings
ArcelorMittal S.A. - Segment focus
SWOT

15.6 Arctech Solar

Arctech Solar - Overview
Arctech Solar - Product / Service
Arctech Solar - Key offerings
SWOT

15.7 Array Technologies Inc.

Array Technologies Inc. - Overview
Array Technologies Inc. - Product / Service
Array Technologies Inc. - Key offerings
SWOT

15.8 First Solar Inc.

First Solar Inc. - Overview
First Solar Inc. - Product / Service
First Solar Inc. - Key offerings
SWOT

15.9 GameChange Solar

GameChange Solar - Overview
GameChange Solar - Product / Service
GameChange Solar - Key offerings
SWOT

15.10 IDEEMATEC Germany GmbH

IDEEMATEC Germany GmbH - Overview
IDEEMATEC Germany GmbH - Product / Service
IDEEMATEC Germany GmbH - Key offerings
SWOT

15.11 Kinsend

Kinsend - Overview
Kinsend - Product / Service
Kinsend - Key offerings
SWOT

15.12 Mahindra Susten Pvt. Ltd.

Mahindra Susten Pvt. Ltd. - Overview
Mahindra Susten Pvt. Ltd. - Product / Service
Mahindra Susten Pvt. Ltd. - Key offerings
SWOT

15.13 Soltec Power Holdings S.A.

Soltec Power Holdings S.A. - Overview
Soltec Power Holdings S.A. - Product / Service
Soltec Power Holdings S.A. - Key offerings
SWOT

15.14 Sun Action Trackers LLC

Sun Action Trackers LLC - Overview
Sun Action Trackers LLC - Product / Service
Sun Action Trackers LLC - Key offerings
SWOT

15.15 Sungrow Power Supply Co. Ltd.

Sungrow Power Supply Co. Ltd. - Overview
Sungrow Power Supply Co. Ltd. - Product / Service
Sungrow Power Supply Co. Ltd. - Key offerings
SWOT

15.16 TBEA Co. Ltd.

TBEA Co. Ltd. - Overview
TBEA Co. Ltd. - Product / Service
TBEA Co. Ltd. - Key offerings
SWOT

15.17 Trina Solar Co. Ltd.

Trina Solar Co. Ltd. - Overview
Trina Solar Co. Ltd. - Product / Service
Trina Solar Co. Ltd. - Key offerings
SWOT

15.18 Valmont Industries Inc.

Valmont Industries Inc. - Overview
Valmont Industries Inc. - Business segments
Valmont Industries Inc. - Key offerings
Valmont Industries Inc. - Segment focus
SWOT

16. Appendix

16.1 Scope of the report

Market definition
Objectives
Notes and caveats

16.2 Inclusions and exclusions checklist

Inclusions checklist
Exclusions checklist

16.3 Currency conversion rates for US$

16.4 Research methodology

16.5 Data procurement

Information sources

16.6 Data validation

16.7 Validation techniques employed for market sizing

16.8 Data synthesis

16.9 360 degree market analysis

16.10 List of abbreviations

Research Methodology

Technavio presents a detailed picture of the market by way of study, synthesis, and summation of data from multiple sources. The analysts have presented the various facets of the market with a particular focus on identifying the key industry influencers. The data thus presented is comprehensive, reliable, and the result of extensive research, both primary and secondary.

INFORMATION SOURCES

Primary sources

  • Manufacturers and suppliers
  • Channel partners
  • Industry experts
  • Strategic decision makers

Secondary sources

  • Industry journals and periodicals
  • Government data
  • Financial reports of key industry players
  • Historical data
  • Press releases

DATA ANALYSIS

Data Synthesis

  • Collation of data
  • Estimation of key figures
  • Analysis of derived insights

Data Validation

  • Triangulation with data models
  • Reference against proprietary databases
  • Corroboration with industry experts

REPORT WRITING

Qualitative

  • Market drivers
  • Market challenges
  • Market trends
  • Five forces analysis

Quantitative

  • Market size and forecast
  • Market segmentation
  • Geographical insights
  • Competitive landscape

Interested in this report?

Get your sample now to see our research methodology and insights!

Download Now

Frequently Asked Questions

Single Axis Solar Pv Tracker market growth will increase by USD 14919.9 million during 2026-2030.

The Single Axis Solar Pv Tracker market is expected to grow at a CAGR of 19.1% during 2026-2030.

Single Axis Solar Pv Tracker market is segmented by Application (Utility, Distributed generation) Type (Horizontal type, Vertical type) Technology (Photovoltaic, Concentrated solar power, Concentrator photovoltaic)

Antaisolar, ArcelorMittal S.A., Arctech Solar, Array Technologies Inc., First Solar Inc., GameChange Solar, IDEEMATEC Germany GmbH, Kinsend, Mahindra Susten Pvt. Ltd., Nevados Engineering Inc., NEXtracker Inc., PI Berlin, PV Hardware Solutions SLU, Schletter Solar GmbH, Scorpius Trackers Pvt. Ltd., Solar Steel, Soltec Power Holdings S.A., Sun Action Trackers LLC, Sungrow Power Supply Co. Ltd., TBEA Co. Ltd., Trina Solar Co. Ltd., Valmont Industries Inc., Versolsolar are a few of the key vendors in the Single Axis Solar Pv Tracker market.

North America will register the highest growth rate of 36.4% among the other regions. Therefore, the Single Axis Solar Pv Tracker market in North America is expected to garner significant business opportunities for the vendors during the forecast period.

US, Canada, Mexico, Spain, Germany, Italy, France, UK, The Netherlands, China, India, Australia, Japan, South Korea, Indonesia, Brazil, Chile, Argentina, Saudi Arabia, UAE, South Africa, Turkey, Israel

  • Accelerating expansion of utility scale projects is the driving factor this market.

The Single Axis Solar Pv Tracker market vendors should focus on grabbing business opportunities from the Application segment as it accounted for the largest market share in the base year.
RIA - Research AI Assistant
Ask RIA
