Skimmed Milk Market Analysis, Size, and Forecast 2025-2029: Europe (Germany, France, and Spain), APAC (China, India, and Japan), North America (US, Canada, and Mexico), South America (Brazil, Argentina, and Colombia), Middle East and Africa (Turkey, Saudi Arabia, and South Africa), and Rest of World (ROW)

Skimmed Milk Market Analysis, Size, and Forecast 2025-2029:
Europe (Germany, France, and Spain), APAC (China, India, and Japan), North America (US, Canada, and Mexico), South America (Brazil, Argentina, and Colombia), Middle East and Africa (Turkey, Saudi Arabia, and South Africa), and Rest of World (ROW)

Published: Dec 2025 293 Pages SKU: IRTNTR73676

Market Overview at a Glance

$4.82 B
Market Opportunity
7%
CAGR 2024 - 2029
37.3%
Europe Growth
$4.12 B
Bakery and confectionaries segment 2023

Skimmed Milk Market Size 2025-2029

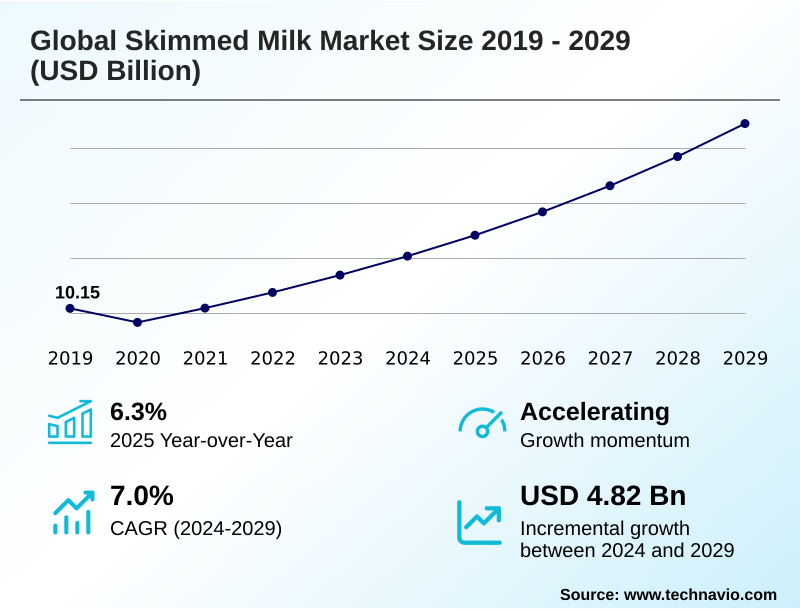
The skimmed milk market size is valued to increase by USD 4.82 billion, at a CAGR of 7% from 2024 to 2029. Heightened health and wellness consciousness driving demand for low-fat, high-protein diets will drive the skimmed milk market.

Major Market Trends & Insights

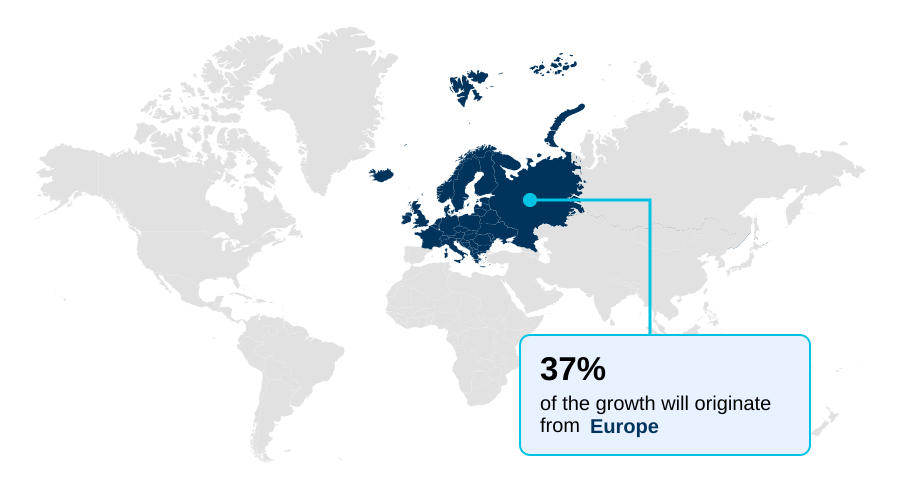
  • Europe dominated the market and accounted for a 37.3% growth during the forecast period.
  • By Application - Bakery and confectionaries segment was valued at USD 4.12 billion in 2023
  • By Packaging - Cartons segment accounted for the largest market revenue share in 2023

Market Size & Forecast

  • Market Opportunities: USD 6.71 billion
  • Market Future Opportunities: USD 4.82 billion
  • CAGR from 2024 to 2029 : 7%

Market Summary

  • The skimmed milk market is evolving beyond its traditional role as a low-fat beverage, driven by its versatility as a critical dairy ingredient in diverse food processing applications. A pronounced consumer shift towards health and wellness underpins demand, with an emphasis on high-protein, low-calorie food options.
  • This trend is compelling manufacturers to focus on dairy product innovation, such as developing fortified skimmed milk and lactose-free milk variants. The industry leverages advanced dairy processing technologies like membrane filtration and spray drying to produce high-quality skimmed milk powder with specific functional properties for food formulation.
  • In a key business scenario, food manufacturers are optimizing their supply chains by using instant skim milk powder to streamline production of recombined dairy products in regions with limited fresh milk supply. This strategy not only ensures product consistency but also reduces logistical costs.
  • However, the market faces challenges from the growing plant-based milk competition and skimmed milk price volatility, which necessitate continuous strategic adjustments in food ingredient sourcing and production planning to maintain profitability and market position.

What will be the Size of the Skimmed Milk Market during the forecast period?

Get Key Insights on Market Forecast (PDF) Request Free Sample

How is the Skimmed Milk Market Segmented?

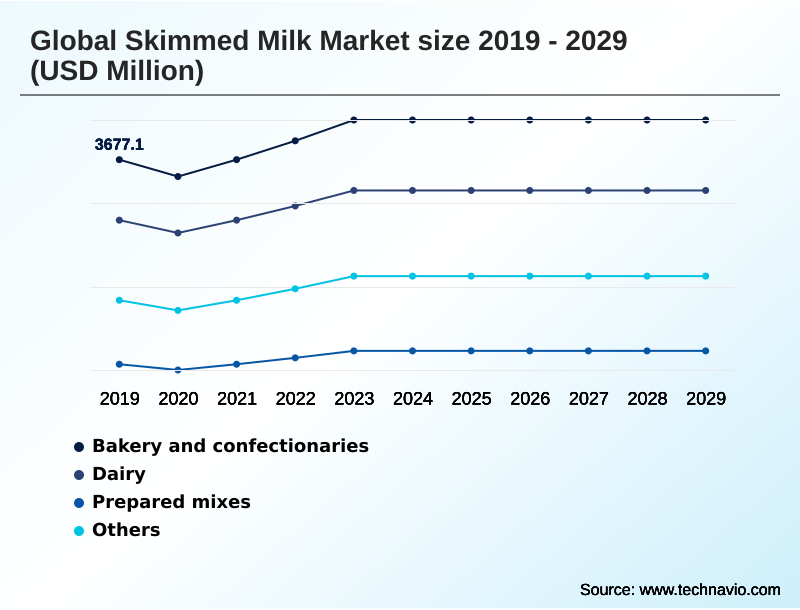
The skimmed milk industry research report provides comprehensive data (region-wise segment analysis), with forecasts and estimates in "USD million" for the period 2025-2029, as well as historical data from 2019-2023 for the following segments.

  • Application
    • Bakery and confectionaries
    • Dairy
    • Prepared mixes
    • Others
  • Packaging
    • Cartons
    • Pouches
    • Bags
    • Drums
  • Type
    • Spray dried
    • Roller dried
  • Geography
    • Europe
      • Germany
      • France
      • Spain
    • APAC
      • China
      • India
      • Japan
    • North America
      • US
      • Canada
      • Mexico
    • South America
      • Brazil
      • Argentina
      • Colombia
    • Middle East and Africa
      • Turkey
      • Saudi Arabia
      • South Africa
    • Rest of World (ROW)

By Application Insights

The bakery and confectionaries segment is estimated to witness significant growth during the forecast period.

The bakery and confectionaries segment represents a significant application area, where the functional properties of skimmed milk are integral.

The use of skimmed milk powder, particularly low-heat skim milk powder, in food formulation enhances texture, browning, and shelf life in a vast array of baked goods.

As consumer demand for healthier options rises, protein fortification of these products has become a key strategy, with dairy ingredients being a preferred choice for their clean label appeal.

This trend is driving innovation in bakery and confectionery ingredients, with manufacturers focusing on powder agglomeration techniques to improve solubility and consistency.

Efficient food ingredient sourcing for these value-added dairy products enables producers to achieve up to a 10% reduction in formulation costs while meeting demand in confectionery production and broader food processing applications.

Request Free Sample

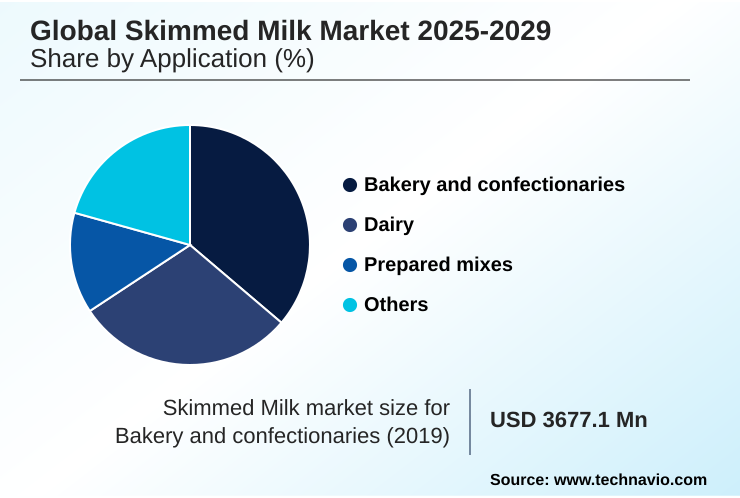
The Bakery and confectionaries segment was valued at USD 4.12 billion in 2023 and showed a gradual increase during the forecast period.

Request Free Sample

Regional Analysis

Europe is estimated to contribute 37.3% to the growth of the global market during the forecast period.Technavio’s analysts have elaborately explained the regional trends and drivers that shape the market during the forecast period.

See How Skimmed Milk Market Demand is Rising in Europe Request Free Sample

The geographic landscape of the market is characterized by varied regional dynamics and trade flows, heavily influenced by local production capabilities and consumer preferences.

Europe accounts for over 37% of the market's incremental growth, driven by its established dairy industry and strong export channels.

In contrast, the APAC region shows the highest growth trajectory, with its rate exceeding North America's by 1.6 percentage points, fueled by rising incomes and awareness of nutritional food and beverage ingredients.

Key technologies such as ultra-high temperature processing (UHT) and aseptic packaging are crucial for serving these diverse regions, enabling the distribution of shelf-stable milk.

The efficiency of spray drying facilities dictates the supply of instant skim milk powder for the global dairy trade, where milk powder solubility is a critical quality metric for beverage manufacturing and other industrial uses.

Market Dynamics

Our researchers analyzed the data with 2024 as the base year, along with the key drivers, trends, and challenges. A holistic analysis of drivers will help companies refine their marketing strategies to gain a competitive advantage.

  • The global skimmed milk market 2025-2029 continues to be shaped by a complex set of factors influencing both supply and demand. Understanding the benefits of spray dried skim milk powder is crucial for food manufacturers, as this ingredient is fundamental in a wide range of applications. Its use in prepared food mixes and for confectionery applications highlights its versatility.
  • The role of skimmed milk in infant nutrition remains a key demand driver, necessitating stringent quality controls. For instance, advancements in dairy processing technology have improved product safety, reducing contamination risks by over 30% compared to legacy systems. Processors are closely monitoring the impact of raw material costs on skim milk, which directly affects profitability.
  • Strategic decisions, such as using skimmed milk for yogurt production, are balanced against the challenges of plant-based milk alternatives. The shelf life of UHT skimmed milk cartons is a significant advantage, supported by innovations in skimmed milk packaging. As low-fat dairy product consumer preferences evolve, the market sees new developments in lactose-free skimmed milk market trends.
  • The functional properties of skimmed milk in food, particularly for protein-fortified foods and in recombined milk products, are a focus of R&D. Furthermore, the nutritional value of fortified skimmed milk and its use as a post-exercise beverage are prominent in marketing.
  • Effective supply chain logistics for skim milk powder are essential for managing global distribution, while the industry also addresses sustainability in skimmed milk production. The application of skimmed milk powder in chocolate manufacturing remains a specialized but important niche.

What are the key market drivers leading to the rise in the adoption of Skimmed Milk Industry?

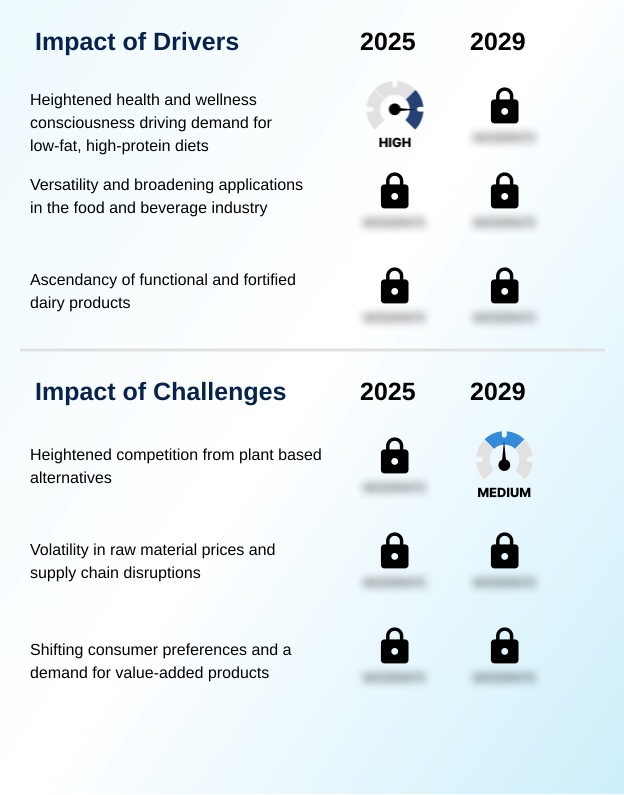
  • The primary market driver is the heightened health and wellness consciousness among consumers, which is significantly increasing the demand for low-fat, high-protein dietary options like skimmed milk.

  • A primary market driver is the escalating consumer focus on health, which has intensified the demand for low-fat dairy options.
  • The preference for skim milk vs whole milk nutrition is clear among health-conscious demographics, who seek low-calorie food options without sacrificing essential nutrients.
  • This shift has accelerated the adoption of advanced dairy processing technologies like membrane filtration and centrifugal separation to perfect milkfat removal while retaining protein content.
  • Innovations in the lactose-free milk category have expanded the consumer base, with new enzymatic processes improving taste and digestibility, thereby increasing market penetration by 20% in key demographics.
  • The rise of private label dairy products offering affordability and quality is also fueling market growth, alongside a broader industry push toward more sustainable dairy farming practices to meet evolving consumer expectations.

What are the market trends shaping the Skimmed Milk Industry?

  • A significant market trend is the rising demand for fortified skimmed milk, driven by increasing health awareness among consumers. This is prompting manufacturers to innovate with nutritionally enhanced products.

  • Market trends are increasingly shaped by consumer demand for functional and nutritionally enhanced products. The development of high-protein skim milk and other functional dairy products is a direct response to the growing interest in health and wellness. This has led to significant dairy product innovation, particularly in fortified skimmed milk for sports nutrition and infant formula.
  • Ingredients like whey protein isolate and caseinates are being integrated to boost the nutritional profile of fortified dairy beverages, with formulations now achieving protein levels 50% higher than standard milk. In the nutritional beverage formulation space, companies are leveraging these ingredients to create products that support specific health goals, appealing to a wider demographic.
  • The focus on consumer health trends is also driving the adoption of new processing methods to preserve the integrity of these dietary supplement ingredients, enhancing overall product value and market appeal.

What challenges does the Skimmed Milk Industry face during its growth?

  • A key challenge affecting industry growth is the heightened competition from a growing array of plant-based milk alternatives.

  • The market faces significant challenges, primarily from skimmed milk price volatility and intense plant-based milk competition. Fluctuations in global dairy solids trade create an unpredictable environment for producers of nonfat dry milk and reconstituted milk, impacting margins. To mitigate this, companies are focusing on dairy supply chain optimization, which has been shown to reduce logistical costs by up to 12%.
  • Furthermore, the rise of dairy alternatives requires the traditional industry to emphasize the superior dairy protein functionality of products like milk protein concentrate and recombined dairy products. Adherence to stringent dairy industry regulations and food safety in dairy protocols adds another layer of operational complexity.
  • Navigating these challenges requires strategic sourcing and production planning to ensure a stable supply of key ingredients like medium-heat skim milk powder.

Exclusive Technavio Analysis on Customer Landscape

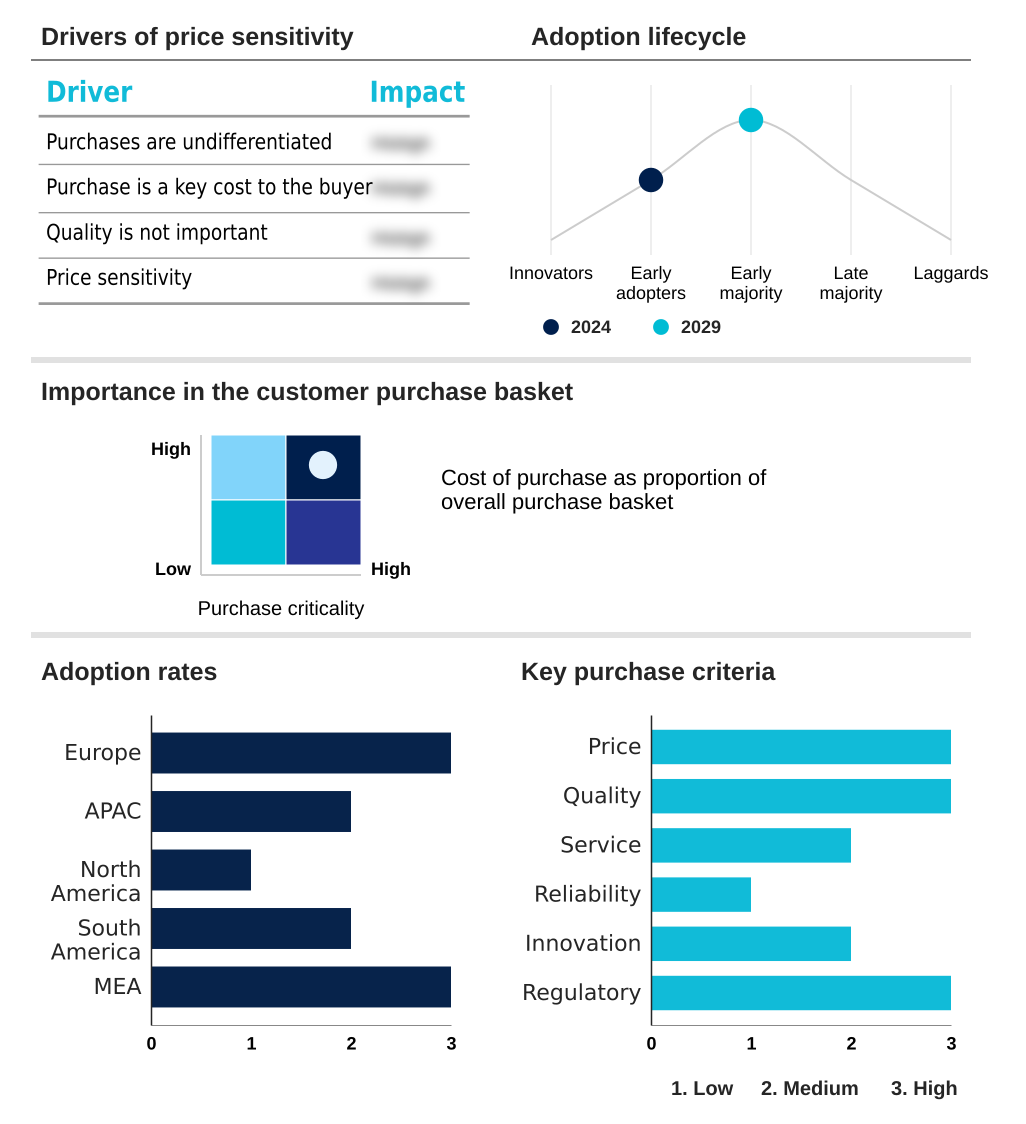
The skimmed milk market forecasting report includes the adoption lifecycle of the market, covering from the innovator’s stage to the laggard’s stage. It focuses on adoption rates in different regions based on penetration. Furthermore, the skimmed milk market report also includes key purchase criteria and drivers of price sensitivity to help companies evaluate and develop their market growth analysis strategies.

Customer Landscape of Skimmed Milk Industry

Competitive Landscape

Companies are implementing various strategies, such as strategic alliances, skimmed milk market forecast, partnerships, mergers and acquisitions, geographical expansion, and product/service launches, to enhance their presence in the industry.

Agri Mark Inc. - The vendor landscape offers a diverse portfolio of skimmed milk products, including specialized powders and liquids tailored for food manufacturing, nutritional applications, and direct consumption.

The industry research and growth report includes detailed analyses of the competitive landscape of the market and information about key companies, including:

  • Agri Mark Inc.
  • Agropur Dairy Cooperative
  • Alpen Food Group BV
  • Arla Foods amba
  • Dairy Farmers of America Inc.
  • Darigold Inc.
  • Fonterra Cooperative Group Ltd.
  • Grassland Dairy Products Inc.
  • Gujarat Co Milk Ltd.
  • Kruger GmbH and Co. KG
  • LACTALIS Ingredients
  • Nestle SA
  • Royal Friesland Campina NV
  • Saputo Inc.
  • Schreiber Foods Inc.
  • Sterling Agro Industries Ltd.
  • Synlait Ltd.

Qualitative and quantitative analysis of companies has been conducted to help clients understand the wider business environment as well as the strengths and weaknesses of key industry players. Data is qualitatively analyzed to categorize companies as pure play, category-focused, industry-focused, and diversified; it is quantitatively analyzed to categorize companies as dominant, leading, strong, tentative, and weak.

Recent Development and News in Skimmed milk market

  • In August, 2024, Germany's Deutsches Milchkontor GmbH entered into a collaboration with the Kazakhstan Milk dairy plant to establish a new cheese production facility, a strategic move impacting milk allocation for other dairy products.
  • In January, 2025, Tetra Pak and Lactalis announced the launch of an aseptic beverage carton incorporating certified recycled polymers, signaling a significant step toward circularity in milk packaging.
  • In January, 2025, Nissha Metallizing Solutions and Tetra Pak revealed a collaboration on an aseptic beverage carton featuring a paper-based barrier, increasing the renewable content to 90% and reducing reliance on aluminum.
  • In February, 2025, a leading food and beverage corporation announced a new line of ready-to-drink nutritional beverages featuring high-protein fortified skimmed milk, targeting the growing sports nutrition and wellness segments.

Dive into Technavio’s robust research methodology, blending expert interviews, extensive data synthesis, and validated models for unparalleled Skimmed Milk Market insights. See full methodology.

Market Scope
Page number 293
Base year 2024
Historic period 2019-2023
Forecast period 2025-2029
Growth momentum & CAGR Accelerate at a CAGR of 7%
Market growth 2025-2029 USD 4823.4 million
Market structure Fragmented
YoY growth 2024-2025(%) 6.3%
Key countries Germany, France, Russia, Poland, Spain, Italy, China, India, Japan, Indonesia, Australia, South Korea, US, Canada, Mexico, Brazil, Argentina, Colombia, Iran, Turkey, Egypt, Saudi Arabia and South Africa
Competitive landscape Leading Companies, Market Positioning of Companies, Competitive Strategies, and Industry Risks

Request Free Sample

Research Analyst Overview

  • The skimmed milk market is defined by its integral role as a foundational dairy ingredient and a staple low-fat dairy product. Advanced dairy processing techniques, including centrifugal separation for milkfat removal and subsequent evaporation process and spray drying, are central to producing various grades of skimmed milk powder, such as low-heat and medium-heat variants.
  • These powders, along with milk protein concentrate and whey protein isolate, are vital for food formulation across bakery, confectionery, and nutritional sectors. The trend toward nutritional fortification has spurred dairy product innovation, leading to the launch of high-protein and fortified skimmed milk products.
  • In the boardroom, the decision to invest in technologies like membrane filtration for milk fractionation is now directly linked to a product differentiation strategy. For example, such investments enable the creation of specialized ingredients, offering a 15% margin premium over standard nonfat dry milk.
  • The market also sees growth in shelf-stable UHT skimmed milk, facilitated by aseptic packaging, which meets demand for convenience without compromising quality.

What are the Key Data Covered in this Skimmed Milk Market Research and Growth Report?

  • What is the expected growth of the Skimmed Milk Market between 2025 and 2029?

    • USD 4.82 billion, at a CAGR of 7%

  • What segmentation does the market report cover?

    • The report is segmented by Application (Bakery and confectionaries, Dairy, Prepared mixes, and Others), Packaging (Cartons, Pouches, Bags, and Drums), Type (Spray dried, and Roller dried) and Geography (Europe, APAC, North America, South America, Middle East and Africa)

  • Which regions are analyzed in the report?

    • Europe, APAC, North America, South America and Middle East and Africa

  • What are the key growth drivers and market challenges?

    • Heightened health and wellness consciousness driving demand for low-fat, high-protein diets, Heightened competition from plant based alternatives

  • Who are the major players in the Skimmed Milk Market?

    • Agri Mark Inc., Agropur Dairy Cooperative, Alpen Food Group BV, Arla Foods amba, Dairy Farmers of America Inc., Darigold Inc., Fonterra Cooperative Group Ltd., Grassland Dairy Products Inc., Gujarat Co Milk Ltd., Kruger GmbH and Co. KG, LACTALIS Ingredients, Nestle SA, Royal Friesland Campina NV, Saputo Inc., Schreiber Foods Inc., Sterling Agro Industries Ltd. and Synlait Ltd.

Market Research Insights

  • The market is shaped by a dynamic interplay between consumer health trends and technological advancements in food processing applications. The demand for functional and fortified dairy beverages is expanding, with products now delivering enhanced nutritional profiles.
  • This push for innovation has led to measurable improvements in production; for instance, advanced aseptic carton technology has extended product shelf life by over 25% for UHT skimmed milk. Furthermore, optimizing dairy supply chain operations through better demand forecasting has reduced inventory holding costs by 15%.
  • As the plant-based milk competition intensifies, dairy manufacturers are focusing on value-added dairy propositions and leveraging clean label dairy ingredients to appeal to discerning consumers, highlighting the clear nutritional benefits of skim milk vs whole milk nutrition to maintain market relevance.

We can help! Our analysts can customize this skimmed milk market research report to meet your requirements.

Get in touch

1. Executive Summary

1.1 Market overview

Executive Summary - Chart on Market Overview
Executive Summary - Data Table on Market Overview
Executive Summary - Chart on Global Market Characteristics
Executive Summary - Chart on Market by Geography
Executive Summary - Chart on Market Segmentation by Application
Executive Summary - Chart on Market Segmentation by Packaging
Executive Summary - Chart on Market Segmentation by Type
Executive Summary - Chart on Incremental Growth
Executive Summary - Data Table on Incremental Growth
Executive Summary - Chart on Company Market Positioning

2. Technavio Analysis

2.1 Analysis of price sensitivity, lifecycle, customer purchase basket, adoption rates, and purchase criteria

2.2 Criticality of inputs and Factors of differentiation

Chart on Overview on criticality of inputs and factors of differentiation

2.3 Factors of disruption

Chart on Overview on factors of disruption

2.4 Impact of drivers and challenges

Chart on Impact of drivers and challenges in 2024 and 2029

3. Market Landscape

3.1 Market ecosystem

Chart on Parent Market
Data Table on - Parent Market

3.2 Market characteristics

Chart on Market characteristics analysis

3.3 Value chain analysis

Chart on Value chain analysis

4. Market Sizing

4.1 Market definition

Data Table on Offerings of companies included in the market definition

4.2 Market segment analysis

Market segments

4.3 Market size 2024

4.4 Market outlook: Forecast for 2024-2029

Chart on Global - Market size and forecast 2024-2029 ($ million)
Data Table on Global - Market size and forecast 2024-2029 ($ million)
Chart on Global Market: Year-over-year growth 2024-2029 (%)
Data Table on Global Market: Year-over-year growth 2024-2029 (%)

5. Historic Market Size

5.1 Global Skimmed Milk Market 2019 - 2023

Historic Market Size - Data Table on Global Skimmed Milk Market 2019 - 2023 ($ million)

5.2 Application segment analysis 2019 - 2023

Historic Market Size - Application Segment 2019 - 2023 ($ million)

5.3 Packaging segment analysis 2019 - 2023

Historic Market Size - Packaging Segment 2019 - 2023 ($ million)

5.4 Type segment analysis 2019 - 2023

Historic Market Size - Type Segment 2019 - 2023 ($ million)

5.5 Geography segment analysis 2019 - 2023

Historic Market Size - Geography Segment 2019 - 2023 ($ million)

5.6 Country segment analysis 2019 - 2023

Historic Market Size - Country Segment 2019 - 2023 ($ million)

6. Qualitative Analysis

6.1 The AI impact on Global Skimmed Milk Market

7. Five Forces Analysis

7.1 Five forces summary

Five forces analysis - Comparison between 2024 and 2029

7.2 Bargaining power of buyers

Bargaining power of buyers - Impact of key factors 2024 and 2029

7.3 Bargaining power of suppliers

Bargaining power of suppliers - Impact of key factors in 2024 and 2029

7.4 Threat of new entrants

Threat of new entrants - Impact of key factors in 2024 and 2029

7.5 Threat of substitutes

Threat of substitutes - Impact of key factors in 2024 and 2029

7.6 Threat of rivalry

Threat of rivalry - Impact of key factors in 2024 and 2029

7.7 Market condition

Chart on Market condition - Five forces 2024 and 2029

8. Market Segmentation by Application

8.1 Market segments

Chart on Application - Market share 2024-2029 (%)
Data Table on Application - Market share 2024-2029 (%)

8.2 Comparison by Application

Chart on Comparison by Application
Data Table on Comparison by Application

8.3 Bakery and confectionaries - Market size and forecast 2024-2029

Chart on Bakery and confectionaries - Market size and forecast 2024-2029 ($ million)
Data Table on Bakery and confectionaries - Market size and forecast 2024-2029 ($ million)
Chart on Bakery and confectionaries - Year-over-year growth 2024-2029 (%)
Data Table on Bakery and confectionaries - Year-over-year growth 2024-2029 (%)

8.4 Dairy - Market size and forecast 2024-2029

Chart on Dairy - Market size and forecast 2024-2029 ($ million)
Data Table on Dairy - Market size and forecast 2024-2029 ($ million)
Chart on Dairy - Year-over-year growth 2024-2029 (%)
Data Table on Dairy - Year-over-year growth 2024-2029 (%)

8.5 Prepared mixes - Market size and forecast 2024-2029

Chart on Prepared mixes - Market size and forecast 2024-2029 ($ million)
Data Table on Prepared mixes - Market size and forecast 2024-2029 ($ million)
Chart on Prepared mixes - Year-over-year growth 2024-2029 (%)
Data Table on Prepared mixes - Year-over-year growth 2024-2029 (%)

8.6 Others - Market size and forecast 2024-2029

Chart on Others - Market size and forecast 2024-2029 ($ million)
Data Table on Others - Market size and forecast 2024-2029 ($ million)
Chart on Others - Year-over-year growth 2024-2029 (%)
Data Table on Others - Year-over-year growth 2024-2029 (%)

8.7 Market opportunity by Application

Market opportunity by Application ($ million)
Data Table on Market opportunity by Application ($ million)

9. Market Segmentation by Packaging

9.1 Market segments

Chart on Packaging - Market share 2024-2029 (%)
Data Table on Packaging - Market share 2024-2029 (%)

9.2 Comparison by Packaging

Chart on Comparison by Packaging
Data Table on Comparison by Packaging

9.3 Cartons - Market size and forecast 2024-2029

Chart on Cartons - Market size and forecast 2024-2029 ($ million)
Data Table on Cartons - Market size and forecast 2024-2029 ($ million)
Chart on Cartons - Year-over-year growth 2024-2029 (%)
Data Table on Cartons - Year-over-year growth 2024-2029 (%)

9.4 Pouches - Market size and forecast 2024-2029

Chart on Pouches - Market size and forecast 2024-2029 ($ million)
Data Table on Pouches - Market size and forecast 2024-2029 ($ million)
Chart on Pouches - Year-over-year growth 2024-2029 (%)
Data Table on Pouches - Year-over-year growth 2024-2029 (%)

9.5 Bags - Market size and forecast 2024-2029

Chart on Bags - Market size and forecast 2024-2029 ($ million)
Data Table on Bags - Market size and forecast 2024-2029 ($ million)
Chart on Bags - Year-over-year growth 2024-2029 (%)
Data Table on Bags - Year-over-year growth 2024-2029 (%)

9.6 Drums - Market size and forecast 2024-2029

Chart on Drums - Market size and forecast 2024-2029 ($ million)
Data Table on Drums - Market size and forecast 2024-2029 ($ million)
Chart on Drums - Year-over-year growth 2024-2029 (%)
Data Table on Drums - Year-over-year growth 2024-2029 (%)

9.7 Market opportunity by Packaging

Market opportunity by Packaging ($ million)
Data Table on Market opportunity by Packaging ($ million)

10. Market Segmentation by Type

10.1 Market segments

Chart on Type - Market share 2024-2029 (%)
Data Table on Type - Market share 2024-2029 (%)

10.2 Comparison by Type

Chart on Comparison by Type
Data Table on Comparison by Type

10.3 Spray dried - Market size and forecast 2024-2029

Chart on Spray dried - Market size and forecast 2024-2029 ($ million)
Data Table on Spray dried - Market size and forecast 2024-2029 ($ million)
Chart on Spray dried - Year-over-year growth 2024-2029 (%)
Data Table on Spray dried - Year-over-year growth 2024-2029 (%)

10.4 Roller dried - Market size and forecast 2024-2029

Chart on Roller dried - Market size and forecast 2024-2029 ($ million)
Data Table on Roller dried - Market size and forecast 2024-2029 ($ million)
Chart on Roller dried - Year-over-year growth 2024-2029 (%)
Data Table on Roller dried - Year-over-year growth 2024-2029 (%)

10.5 Market opportunity by Type

Market opportunity by Type ($ million)
Data Table on Market opportunity by Type ($ million)

11. Customer Landscape

11.1 Customer landscape overview

Analysis of price sensitivity, lifecycle, customer purchase basket, adoption rates, and purchase criteria

12. Geographic Landscape

12.1 Geographic segmentation

Chart on Market share by geography 2024-2029 (%)
Data Table on Market share by geography 2024-2029 (%)

12.2 Geographic comparison

Chart on Geographic comparison
Data Table on Geographic comparison

12.3 Europe - Market size and forecast 2024-2029

Chart on Europe - Market size and forecast 2024-2029 ($ million)
Data Table on Europe - Market size and forecast 2024-2029 ($ million)
Chart on Europe - Year-over-year growth 2024-2029 (%)
Data Table on Europe - Year-over-year growth 2024-2029 (%)
Chart on Regional Comparison - Europe
Data Table on Regional Comparison - Europe

12.3.1 Germany - Market size and forecast 2024-2029

Chart on Germany - Market size and forecast 2024-2029 ($ million)
Data Table on Germany - Market size and forecast 2024-2029 ($ million)
Chart on Germany - Year-over-year growth 2024-2029 (%)
Data Table on Germany - Year-over-year growth 2024-2029 (%)

12.3.2 France - Market size and forecast 2024-2029

Chart on France - Market size and forecast 2024-2029 ($ million)
Data Table on France - Market size and forecast 2024-2029 ($ million)
Chart on France - Year-over-year growth 2024-2029 (%)
Data Table on France - Year-over-year growth 2024-2029 (%)

12.3.3 Russia - Market size and forecast 2024-2029

Chart on Russia - Market size and forecast 2024-2029 ($ million)
Data Table on Russia - Market size and forecast 2024-2029 ($ million)
Chart on Russia - Year-over-year growth 2024-2029 (%)
Data Table on Russia - Year-over-year growth 2024-2029 (%)

12.3.4 Poland - Market size and forecast 2024-2029

Chart on Poland - Market size and forecast 2024-2029 ($ million)
Data Table on Poland - Market size and forecast 2024-2029 ($ million)
Chart on Poland - Year-over-year growth 2024-2029 (%)
Data Table on Poland - Year-over-year growth 2024-2029 (%)

12.3.5 Spain - Market size and forecast 2024-2029

Chart on Spain - Market size and forecast 2024-2029 ($ million)
Data Table on Spain - Market size and forecast 2024-2029 ($ million)
Chart on Spain - Year-over-year growth 2024-2029 (%)
Data Table on Spain - Year-over-year growth 2024-2029 (%)

12.3.6 Italy - Market size and forecast 2024-2029

Chart on Italy - Market size and forecast 2024-2029 ($ million)
Data Table on Italy - Market size and forecast 2024-2029 ($ million)
Chart on Italy - Year-over-year growth 2024-2029 (%)
Data Table on Italy - Year-over-year growth 2024-2029 (%)

12.4 APAC - Market size and forecast 2024-2029

Chart on APAC - Market size and forecast 2024-2029 ($ million)
Data Table on APAC - Market size and forecast 2024-2029 ($ million)
Chart on APAC - Year-over-year growth 2024-2029 (%)
Data Table on APAC - Year-over-year growth 2024-2029 (%)
Chart on Regional Comparison - APAC
Data Table on Regional Comparison - APAC

12.4.1 China - Market size and forecast 2024-2029

Chart on China - Market size and forecast 2024-2029 ($ million)
Data Table on China - Market size and forecast 2024-2029 ($ million)
Chart on China - Year-over-year growth 2024-2029 (%)
Data Table on China - Year-over-year growth 2024-2029 (%)

12.4.2 India - Market size and forecast 2024-2029

Chart on India - Market size and forecast 2024-2029 ($ million)
Data Table on India - Market size and forecast 2024-2029 ($ million)
Chart on India - Year-over-year growth 2024-2029 (%)
Data Table on India - Year-over-year growth 2024-2029 (%)

12.4.3 Japan - Market size and forecast 2024-2029

Chart on Japan - Market size and forecast 2024-2029 ($ million)
Data Table on Japan - Market size and forecast 2024-2029 ($ million)
Chart on Japan - Year-over-year growth 2024-2029 (%)
Data Table on Japan - Year-over-year growth 2024-2029 (%)

12.4.4 Indonesia - Market size and forecast 2024-2029

Chart on Indonesia - Market size and forecast 2024-2029 ($ million)
Data Table on Indonesia - Market size and forecast 2024-2029 ($ million)
Chart on Indonesia - Year-over-year growth 2024-2029 (%)
Data Table on Indonesia - Year-over-year growth 2024-2029 (%)

12.4.5 Australia - Market size and forecast 2024-2029

Chart on Australia - Market size and forecast 2024-2029 ($ million)
Data Table on Australia - Market size and forecast 2024-2029 ($ million)
Chart on Australia - Year-over-year growth 2024-2029 (%)
Data Table on Australia - Year-over-year growth 2024-2029 (%)

12.4.6 South Korea - Market size and forecast 2024-2029

Chart on South Korea - Market size and forecast 2024-2029 ($ million)
Data Table on South Korea - Market size and forecast 2024-2029 ($ million)
Chart on South Korea - Year-over-year growth 2024-2029 (%)
Data Table on South Korea - Year-over-year growth 2024-2029 (%)

12.5 North America - Market size and forecast 2024-2029

Chart on North America - Market size and forecast 2024-2029 ($ million)
Data Table on North America - Market size and forecast 2024-2029 ($ million)
Chart on North America - Year-over-year growth 2024-2029 (%)
Data Table on North America - Year-over-year growth 2024-2029 (%)
Chart on Regional Comparison - North America
Data Table on Regional Comparison - North America

12.5.1 US - Market size and forecast 2024-2029

Chart on US - Market size and forecast 2024-2029 ($ million)
Data Table on US - Market size and forecast 2024-2029 ($ million)
Chart on US - Year-over-year growth 2024-2029 (%)
Data Table on US - Year-over-year growth 2024-2029 (%)

12.5.2 Canada - Market size and forecast 2024-2029

Chart on Canada - Market size and forecast 2024-2029 ($ million)
Data Table on Canada - Market size and forecast 2024-2029 ($ million)
Chart on Canada - Year-over-year growth 2024-2029 (%)
Data Table on Canada - Year-over-year growth 2024-2029 (%)

12.5.3 Mexico - Market size and forecast 2024-2029

Chart on Mexico - Market size and forecast 2024-2029 ($ million)
Data Table on Mexico - Market size and forecast 2024-2029 ($ million)
Chart on Mexico - Year-over-year growth 2024-2029 (%)
Data Table on Mexico - Year-over-year growth 2024-2029 (%)

12.6 South America - Market size and forecast 2024-2029

Chart on South America - Market size and forecast 2024-2029 ($ million)
Data Table on South America - Market size and forecast 2024-2029 ($ million)
Chart on South America - Year-over-year growth 2024-2029 (%)
Data Table on South America - Year-over-year growth 2024-2029 (%)
Chart on Regional Comparison - South America
Data Table on Regional Comparison - South America

12.6.1 Brazil - Market size and forecast 2024-2029

Chart on Brazil - Market size and forecast 2024-2029 ($ million)
Data Table on Brazil - Market size and forecast 2024-2029 ($ million)
Chart on Brazil - Year-over-year growth 2024-2029 (%)
Data Table on Brazil - Year-over-year growth 2024-2029 (%)

12.6.2 Argentina - Market size and forecast 2024-2029

Chart on Argentina - Market size and forecast 2024-2029 ($ million)
Data Table on Argentina - Market size and forecast 2024-2029 ($ million)
Chart on Argentina - Year-over-year growth 2024-2029 (%)
Data Table on Argentina - Year-over-year growth 2024-2029 (%)

12.6.3 Colombia - Market size and forecast 2024-2029

Chart on Colombia - Market size and forecast 2024-2029 ($ million)
Data Table on Colombia - Market size and forecast 2024-2029 ($ million)
Chart on Colombia - Year-over-year growth 2024-2029 (%)
Data Table on Colombia - Year-over-year growth 2024-2029 (%)

12.7 Middle East and Africa - Market size and forecast 2024-2029

Chart on Middle East and Africa - Market size and forecast 2024-2029 ($ million)
Data Table on Middle East and Africa - Market size and forecast 2024-2029 ($ million)
Chart on Middle East and Africa - Year-over-year growth 2024-2029 (%)
Data Table on Middle East and Africa - Year-over-year growth 2024-2029 (%)
Chart on Regional Comparison - Middle East and Africa
Data Table on Regional Comparison - Middle East and Africa

12.7.1 Iran - Market size and forecast 2024-2029

Chart on Iran - Market size and forecast 2024-2029 ($ million)
Data Table on Iran - Market size and forecast 2024-2029 ($ million)
Chart on Iran - Year-over-year growth 2024-2029 (%)
Data Table on Iran - Year-over-year growth 2024-2029 (%)

12.7.2 Turkey - Market size and forecast 2024-2029

Chart on Turkey - Market size and forecast 2024-2029 ($ million)
Data Table on Turkey - Market size and forecast 2024-2029 ($ million)
Chart on Turkey - Year-over-year growth 2024-2029 (%)
Data Table on Turkey - Year-over-year growth 2024-2029 (%)

12.7.3 Egypt - Market size and forecast 2024-2029

Chart on Egypt - Market size and forecast 2024-2029 ($ million)
Data Table on Egypt - Market size and forecast 2024-2029 ($ million)
Chart on Egypt - Year-over-year growth 2024-2029 (%)
Data Table on Egypt - Year-over-year growth 2024-2029 (%)

12.7.4 Saudi Arabia - Market size and forecast 2024-2029

Chart on Saudi Arabia - Market size and forecast 2024-2029 ($ million)
Data Table on Saudi Arabia - Market size and forecast 2024-2029 ($ million)
Chart on Saudi Arabia - Year-over-year growth 2024-2029 (%)
Data Table on Saudi Arabia - Year-over-year growth 2024-2029 (%)

12.7.5 South Africa - Market size and forecast 2024-2029

Chart on South Africa - Market size and forecast 2024-2029 ($ million)
Data Table on South Africa - Market size and forecast 2024-2029 ($ million)
Chart on South Africa - Year-over-year growth 2024-2029 (%)
Data Table on South Africa - Year-over-year growth 2024-2029 (%)

12.8 Market opportunity by geography

Market opportunity by geography ($ million)
Data Tables on Market opportunity by geography ($ million)

13. Drivers, Challenges, and Opportunity

13.1 Market drivers

Heightened health and wellness consciousness driving demand for low-fat, high-protein diets
Versatility and broadening applications in the food and beverage industry
Ascendancy of functional and fortified dairy products

13.2 Market challenges

Heightened competition from plant based alternatives
Volatility in raw material prices and supply chain disruptions
Shifting consumer preferences and a demand for value-added products

13.3 Impact of drivers and challenges

Impact of drivers and challenges in 2024 and 2029

13.4 Market opportunities

Rising health awareness boosts demand for fortified skimmed milk
Expanding applications of skimmed milk in the food processing sector
Dichotomy of plant-based competition and the rise of lactose-free

14. Competitive Landscape

14.1 Overview

14.2

Overview on criticality of inputs and factors of differentiation

14.3 Landscape disruption

Overview on factors of disruption

14.4 Industry risks

Impact of key risks on business

15. Competitive Analysis

15.1 Companies profiled

Companies covered

15.2 Company ranking index

15.3 Market positioning of companies

Matrix on companies position and classification

15.4 Agri Mark Inc.

Agri Mark Inc. - Overview
Agri Mark Inc. - Product / Service
Agri Mark Inc. - Key offerings
SWOT

15.5 Agropur Dairy Cooperative

Agropur Dairy Cooperative - Overview
Agropur Dairy Cooperative - Product / Service
Agropur Dairy Cooperative - Key offerings
SWOT

15.6 Arla Foods amba

Arla Foods amba - Overview
Arla Foods amba - Product / Service
Arla Foods amba - Key offerings
SWOT

15.7 Dairy Farmers of America Inc.

Dairy Farmers of America Inc. - Overview
Dairy Farmers of America Inc. - Product / Service
Dairy Farmers of America Inc. - Key offerings
SWOT

15.8 Darigold Inc.

Darigold Inc. - Overview
Darigold Inc. - Product / Service
Darigold Inc. - Key offerings
SWOT

15.9 Fonterra Cooperative Group Ltd.

Fonterra Cooperative Group Ltd. - Overview
Fonterra Cooperative Group Ltd. - Business segments
Fonterra Cooperative Group Ltd. - Key news
Fonterra Cooperative Group Ltd. - Key offerings
Fonterra Cooperative Group Ltd. - Segment focus
SWOT

15.10 Grassland Dairy Products Inc.

Grassland Dairy Products Inc. - Overview
Grassland Dairy Products Inc. - Product / Service
Grassland Dairy Products Inc. - Key offerings
SWOT

15.11 Gujarat Co Milk Ltd.

Gujarat Co Milk Ltd. - Overview
Gujarat Co Milk Ltd. - Product / Service
Gujarat Co Milk Ltd. - Key offerings
SWOT

15.12 LACTALIS Ingredients

LACTALIS Ingredients - Overview
LACTALIS Ingredients - Product / Service
LACTALIS Ingredients - Key offerings
SWOT

15.13 Nestle SA

Nestle SA - Overview
Nestle SA - Business segments
Nestle SA - Key news
Nestle SA - Key offerings
Nestle SA - Segment focus
SWOT

15.14 Royal Friesland Campina NV

Royal Friesland Campina NV - Overview
Royal Friesland Campina NV - Product / Service
Royal Friesland Campina NV - Key offerings
SWOT

15.15 Saputo Inc.

Saputo Inc. - Overview
Saputo Inc. - Business segments
Saputo Inc. - Key offerings
Saputo Inc. - Segment focus
SWOT

15.16 Schreiber Foods Inc.

Schreiber Foods Inc. - Overview
Schreiber Foods Inc. - Product / Service
Schreiber Foods Inc. - Key offerings
SWOT

15.17 Sterling Agro Industries Ltd.

Sterling Agro Industries Ltd. - Overview
Sterling Agro Industries Ltd. - Product / Service
Sterling Agro Industries Ltd. - Key offerings
SWOT

15.18 Synlait Ltd.

Synlait Ltd. - Overview
Synlait Ltd. - Business segments
Synlait Ltd. - Key offerings
Synlait Ltd. - Segment focus
SWOT

16. Appendix

16.1 Scope of the report

Market definition
Objectives
Notes and caveats

16.2 Inclusions and exclusions checklist

Inclusions checklist
Exclusions checklist

16.3 Currency conversion rates for US$

16.4 Research methodology

16.5 Data procurement

Information sources

16.6 Data validation

16.7 Validation techniques employed for market sizing

16.8 Data synthesis

16.9 360 degree market analysis

16.10 List of abbreviations

Research Methodology

Technavio presents a detailed picture of the market by way of study, synthesis, and summation of data from multiple sources. The analysts have presented the various facets of the market with a particular focus on identifying the key industry influencers. The data thus presented is comprehensive, reliable, and the result of extensive research, both primary and secondary.

INFORMATION SOURCES

Primary sources

  • Manufacturers and suppliers
  • Channel partners
  • Industry experts
  • Strategic decision makers

Secondary sources

  • Industry journals and periodicals
  • Government data
  • Financial reports of key industry players
  • Historical data
  • Press releases

DATA ANALYSIS

Data Synthesis

  • Collation of data
  • Estimation of key figures
  • Analysis of derived insights

Data Validation

  • Triangulation with data models
  • Reference against proprietary databases
  • Corroboration with industry experts

REPORT WRITING

Qualitative

  • Market drivers
  • Market challenges
  • Market trends
  • Five forces analysis

Quantitative

  • Market size and forecast
  • Market segmentation
  • Geographical insights
  • Competitive landscape

Interested in this report?

Get your sample now to see our research methodology and insights!

Download Now

Frequently Asked Questions

Skimmed Milk market growth will increase by USD 4823.4 million during 2025-2029.

The Skimmed Milk market is expected to grow at a CAGR of 7% during 2025-2029.

Skimmed Milk market is segmented by Application (Bakery and confectionaries, Dairy, Prepared mixes, Others) Packaging (Cartons, Pouches, Bags, Drums) Type (Spray dried, Roller dried)

Agri Mark Inc., Agropur Dairy Cooperative, Alpen Food Group BV, Arla Foods amba, Dairy Farmers of America Inc., Darigold Inc., Fonterra Cooperative Group Ltd., Grassland Dairy Products Inc., Gujarat Co Milk Ltd., Kruger GmbH and Co. KG, LACTALIS Ingredients, Nestle SA, Royal Friesland Campina NV, Saputo Inc., Schreiber Foods Inc., Sterling Agro Industries Ltd., Synlait Ltd. are a few of the key vendors in the Skimmed Milk market.

Europe will register the highest growth rate of 37.3% among the other regions. Therefore, the Skimmed Milk market in Europe is expected to garner significant business opportunities for the vendors during the forecast period.

Germany, France, Russia, Poland, Spain, Italy, China, India, Japan, Indonesia, Australia, South Korea, US, Canada, Mexico, Brazil, Argentina, Colombia, Iran, Turkey, Egypt, Saudi Arabia, South Africa

  • Heightened health and wellness consciousness driving demand for low-fat, high-protein diets is the driving factor this market.

The Skimmed Milk market vendors should focus on grabbing business opportunities from the Application segment as it accounted for the largest market share in the base year.