Automatic Milking Machines Market Analysis, Size, and Forecast 2026-2030: Europe (Germany, The Netherlands, and France), North America (US, Canada, and Mexico), APAC (China, India, and Japan), South America (Brazil and Argentina), Middle East and Africa (Saudi Arabia, UAE, and South Africa), and Rest of World (ROW)

Automatic Milking Machines Market Analysis, Size, and Forecast 2026-2030:
Europe (Germany, The Netherlands, and France), North America (US, Canada, and Mexico), APAC (China, India, and Japan), South America (Brazil and Argentina), Middle East and Africa (Saudi Arabia, UAE, and South Africa), and Rest of World (ROW)

Published: Mar 2026 283 Pages SKU: IRTNTR73006

Market Overview at a Glance

$2.05 B
Market Opportunity
7.3%
CAGR 2025 - 2030
43.1%
Europe Growth
$2.46 B
Semi-automatic segment 2024

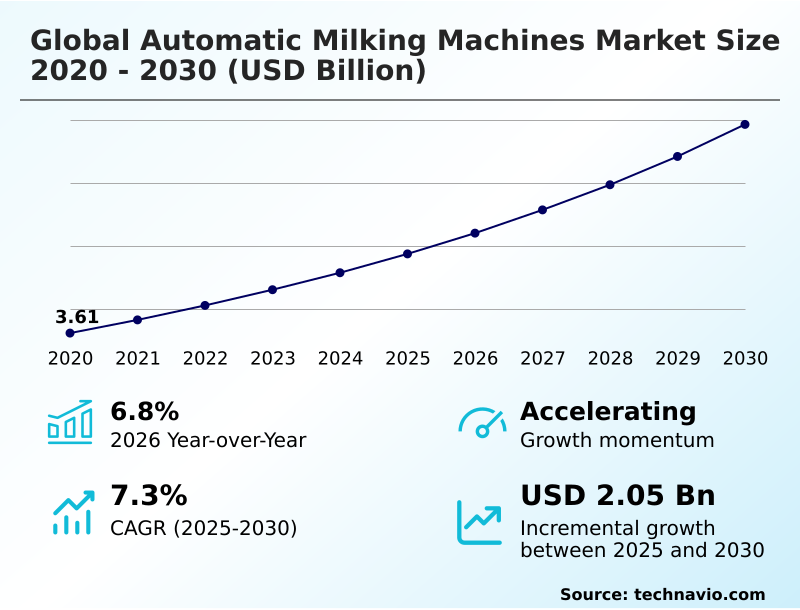
Automatic Milking Machines Market Size 2026-2030

The automatic milking machines market size is valued to increase by USD 2.05 billion, at a CAGR of 7.3% from 2025 to 2030. Increased demand for dairy products will drive the automatic milking machines market.

Major Market Trends & Insights

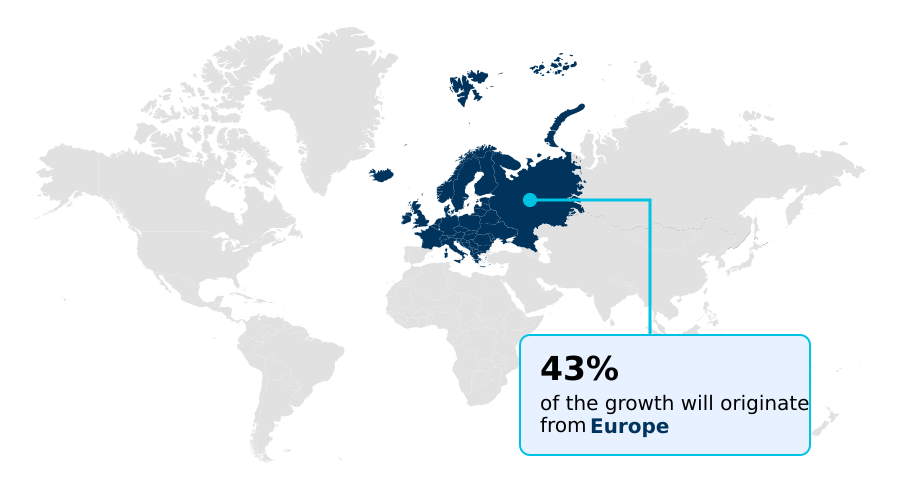
  • Europe dominated the market and accounted for a 43.1% growth during the forecast period.
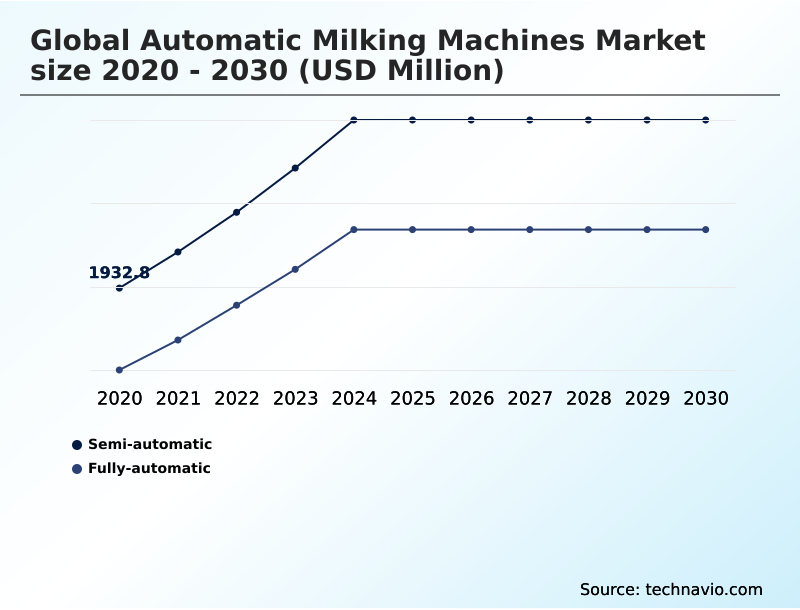
  • By Product - Semi-automatic segment was valued at USD 2.46 billion in 2024
  • By Mobility Type - Stationary automatic segment accounted for the largest market revenue share in 2024

Market Size & Forecast

  • Market Opportunities: USD 3.32 billion
  • Market Future Opportunities: USD 2.05 billion
  • CAGR from 2025 to 2030 : 7.3%

Market Summary

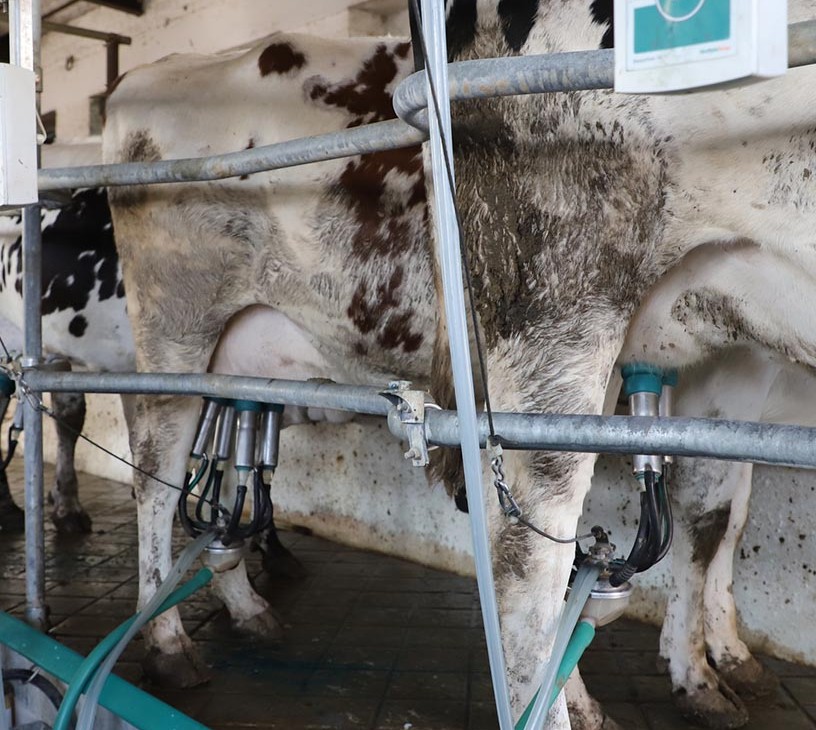
  • The automatic milking machines market is characterized by a strong emphasis on technological innovation to address the dual needs of operational efficiency and enhanced animal welfare. Systems range from semi-automatic units that augment manual labor to fully autonomous voluntary milking systems that enable 24/7 operation with minimal human intervention.
  • A key driver is the consolidation of dairy farms into larger operations, where labor-saving dairy technology is essential for managing profitability. Concurrently, the integration of advanced herd analytics via sensor-based milking technology allows for proactive health management, significantly improving milk quality.
  • For instance, a commercial dairy can leverage real-time data from milking cluster automation to adjust nutritional strategies for underperforming animals, thereby boosting overall yield. However, the high initial capital outlay remains a significant barrier, particularly for smaller farms, creating a competitive divide.
  • The market is also trending towards greater sustainability, with newer systems focusing on reduced energy and water consumption, aligning with modern agricultural standards.

What will be the Size of the Automatic Milking Machines Market during the forecast period?

Get Key Insights on Market Forecast (PDF) Request Free Sample

How is the Automatic Milking Machines Market Segmented?

The automatic milking machines industry research report provides comprehensive data (region-wise segment analysis), with forecasts and estimates in "USD million" for the period 2026-2030, as well as historical data from 2020-2024 for the following segments.

  • Product
    • Semi-automatic
    • Fully-automatic
  • Mobility type
    • Stationary automatic
    • Portable automatic
  • Application
    • Large herd operations farms
    • Small family farms
  • Geography
    • Europe
      • Germany
      • The Netherlands
      • France
    • North America
      • US
      • Canada
      • Mexico
    • APAC
      • China
      • India
      • Japan
    • South America
      • Brazil
      • Argentina
    • Middle East and Africa
      • Saudi Arabia
      • UAE
      • South Africa
    • Rest of World (ROW)

By Product Insights

The semi-automatic segment is estimated to witness significant growth during the forecast period.

The semi-automatic segment provides a crucial bridge for dairy producers transitioning from manual methods. These systems, including portable milking units and single-bucket piston machines, enhance milking speed with lower initial capital than fully robotic solutions.

They are prevalent where labor is accessible but improved hygiene and standardized protocols are needed to meet quality standards. Integrating milk conductivity sensors and mobile herd management apps facilitates early health detection and real-time data visualization.

Advanced modular milking systems are designed for durability and energy-efficient milking, with a focus on straightforward robotic system maintenance.

For operators, this means a significant reduction in physical workload, with some farms reporting up to a 40% decrease in manual milking time, representing a phased investment into agricultural IoT integration and automated nutritional adjustments.

Request Free Sample

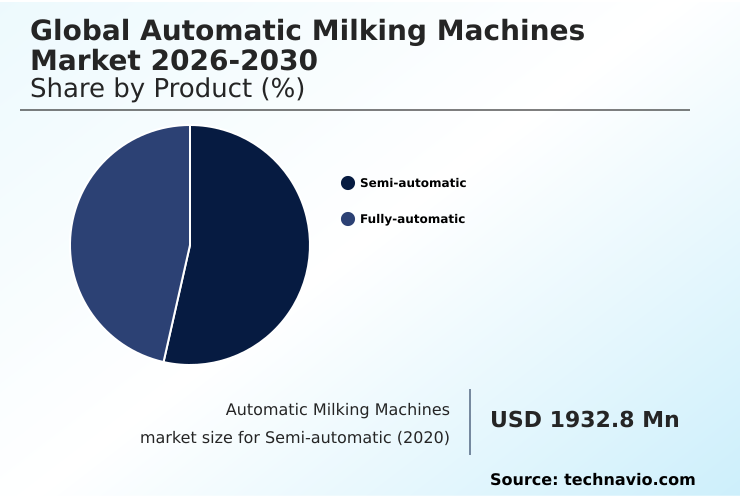
The Semi-automatic segment was valued at USD 2.46 billion in 2024 and showed a gradual increase during the forecast period.

Request Free Sample

Regional Analysis

Europe is estimated to contribute 43.1% to the growth of the global market during the forecast period.Technavio’s analysts have elaborately explained the regional trends and drivers that shape the market during the forecast period.

See How Automatic Milking Machines Market Demand is Rising in Europe Request Free Sample

The geographic landscape of the automatic milking machines market is defined by varying adoption rates tied to regional economic and agricultural structures.

In developed regions like Europe and North America, high labor costs drive the adoption of systems that feature advanced robotic arm precision and automated disinfection cycles for superior hygienic milking protocols.

These markets prioritize udder health monitoring and milking parameter optimization. In contrast, emerging markets are seeing growth in pasture-based robotic milking, which integrates automation with traditional grazing. This approach improves food safety and traceability while accommodating different farming models.

The implementation of precision feeding integration in these systems can reduce feed waste by up to 15%, a critical factor for profitability.

Furthermore, mobile application integration allows for remote management, which has proven to lower operational response times by 25%, boosting efficiency across diverse geographic settings.

Market Dynamics

Our researchers analyzed the data with 2025 as the base year, along with the key drivers, trends, and challenges. A holistic analysis of drivers will help companies refine their marketing strategies to gain a competitive advantage.

  • Strategic decision-making in the automatic milking machines market requires a comprehensive understanding of long-term operational impacts. A primary consideration for any farm is the ROI calculation for automatic milking systems, which must account for not just initial costs but also the ongoing maintenance costs of automated milking equipment.
  • The transition involves more than just hardware; the challenges of training cows for robotic milking can affect initial productivity, and optimizing cow traffic in robotic milking layouts is crucial for efficiency. Technologically, the benefits of voluntary milking systems for herd health are significant, but this is balanced by the need for robust hygiene protocols for automatic milking machines.
  • Data analytics for precision dairy farming, powered by sensor technology for early mastitis detection, offers a path to improving milk quality with automated systems. This is especially true for large herd management with batch milking. However, operators must also be prepared for software updates for robotic milking systems. For smaller operations, comparing stationary vs.
  • portable milking systems is key, as automation solutions for pasture-based dairies offer flexibility. For instance, farms adopting integrated data systems have reported a 15% more accurate prediction of herd health issues compared to those without, showcasing the value of deep analytics.
  • Ultimately, reducing labor costs with dairy automation is a major driver, but success depends on managing the complexities of energy consumption of robotic milking units and addressing the challenges in developing economies for automation.

What are the key market drivers leading to the rise in the adoption of Automatic Milking Machines Industry?

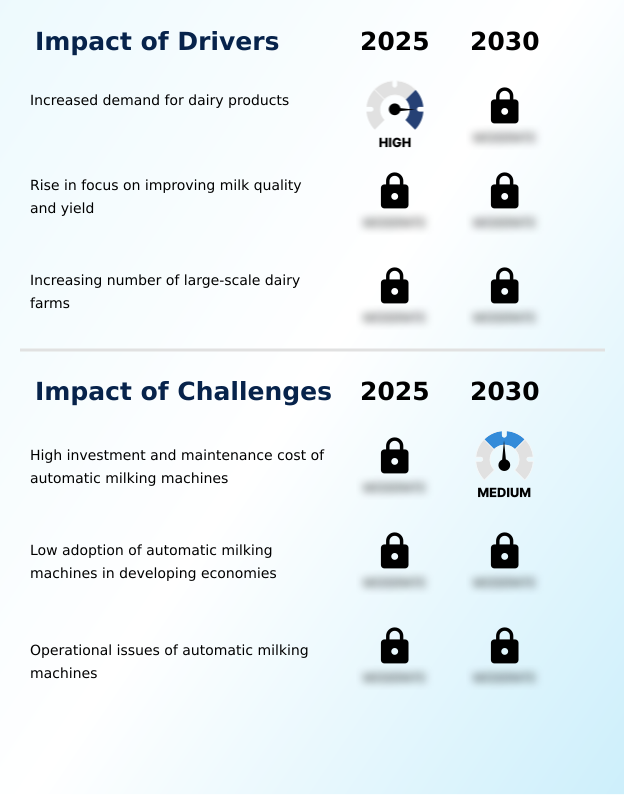
  • Increased global demand for dairy products is a key driver for the automatic milking machines market.

  • Market growth is significantly driven by the adoption of voluntary milking systems that enhance animal welfare standards and farm profitability optimization. These systems improve cow comfort and have been linked to a 5–10% increase in lifetime milk production.
  • The implementation of advanced cow traffic management and high-throughput milking technologies enables farms to increase operational capacity without a proportional rise in labor.
  • Technologies like somatic cell count monitoring and automated teat positioner systems contribute to sustainable dairy production through proactive health management and data-driven decision making.
  • The integration of robotic barn cleaners and milking cluster automation streamlines operations, allowing for remote operational control and reducing manual labor requirements by as much as 50% in some modern facilities.

What are the market trends shaping the Automatic Milking Machines Industry?

  • The rising demand for sensor-based milking is an influential market trend. It signifies a broader industry movement toward data-driven optimization in modern dairy farming.

  • Key market trends are centered on the evolution of sensor-based milking technology and predictive dairying algorithms. The integration of advanced milk flow rate sensors within modern robotic milking systems allows for operational efficiency improvement that can increase milking parlor throughput by up to 15%.
  • This shift towards dairy farm automation is enabling more effective automated herd management and individual cow monitoring. The use of sophisticated software for remote farm monitoring provides real-time data, which has been shown to reduce critical error response times by 30%.
  • This focus on labor-saving dairy technology not only enhances productivity but also drives milk quality enhancement, as continuous analysis helps maintain optimal herd health, supporting the broader trend of advanced herd analytics.

What challenges does the Automatic Milking Machines Industry face during its growth?

  • The high initial investment and subsequent maintenance costs of automatic milking machines pose a significant challenge to market growth.

  • A primary market challenge is the high upfront cost of scalable milking technology, which can deter small farm automation solutions. The complexity of integrating systems like batch milking configurations and robotic carousel systems requires significant capital and technical expertise. Issues such as ensuring reliable laser-guided teat detection and managing cloud-based dairy analytics can be demanding.
  • For example, the initial setup for a fully automated system can require 25% more in infrastructure investment compared to conventional parlors. Furthermore, the digital transformation in dairy demands a new skill set for managing precision dairy farming tools, including automated drafting gates and real-time health alerts.
  • Without a clear path to ROI, which can be obscured by variable milk prices, many potential adopters in high-volume dairy operations remain cautious, slowing the pace of integrated farm management.

Exclusive Technavio Analysis on Customer Landscape

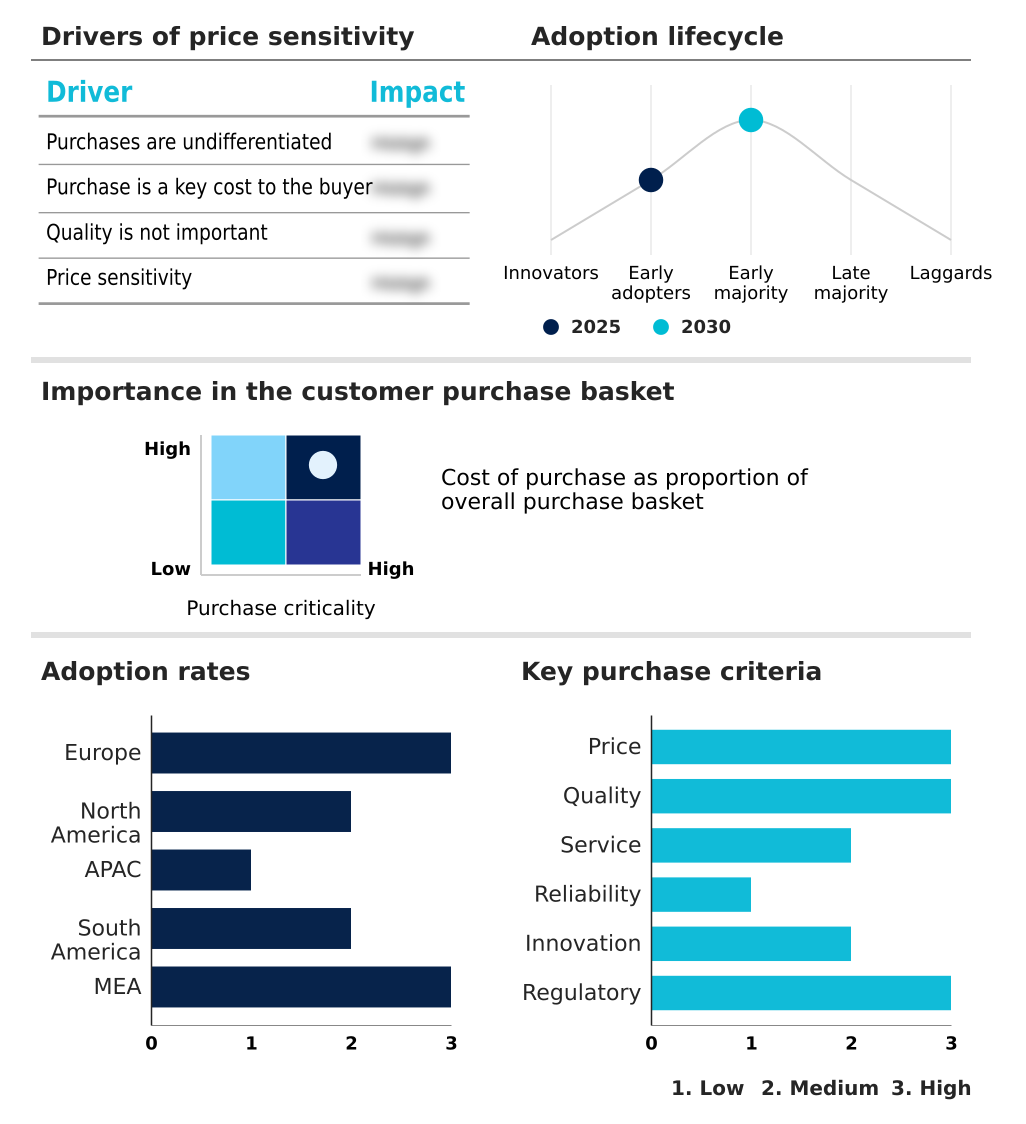
The automatic milking machines market forecasting report includes the adoption lifecycle of the market, covering from the innovator’s stage to the laggard’s stage. It focuses on adoption rates in different regions based on penetration. Furthermore, the automatic milking machines market report also includes key purchase criteria and drivers of price sensitivity to help companies evaluate and develop their market growth analysis strategies.

Customer Landscape of Automatic Milking Machines Industry

Competitive Landscape

Companies are implementing various strategies, such as strategic alliances, automatic milking machines market forecast, partnerships, mergers and acquisitions, geographical expansion, and product/service launches, to enhance their presence in the industry.

AMS Galaxy USA - Delivers integrated robotic milking and automated farm management solutions, enhancing dairy production and operational efficiency.

The industry research and growth report includes detailed analyses of the competitive landscape of the market and information about key companies, including:

  • AMS Galaxy USA
  • Caprine Supply
  • DeLaval International AB
  • Delmer Group
  • GEA Group AG
  • Go Seva Agro Industries
  • Kovai Classic Industries
  • LAKTO Dairy Technologies
  • Lely International N.V
  • Mahesh Eng. Works
  • Milkline
  • Milkomax
  • Prompt Equipments Pvt. Ltd.
  • Shri Krishna Industry
  • System Happel GmbH
  • Waikato Milking Systems LP

Qualitative and quantitative analysis of companies has been conducted to help clients understand the wider business environment as well as the strengths and weaknesses of key industry players. Data is qualitatively analyzed to categorize companies as pure play, category-focused, industry-focused, and diversified; it is quantitatively analyzed to categorize companies as dominant, leading, strong, tentative, and weak.

Recent Development and News in Automatic milking machines market

  • In May 2025, Lely introduced a significant AI update for its Astronaut robotic units, which optimized cow traffic flow and reduced the energy consumption of the system’s cleaning cycles.
  • In February 2025, GEA Group AG launched a new diagnostic kit specifically designed to enhance the performance and analytical capabilities of its semi-automatic milking clusters in emerging agricultural markets.
  • In October 2025, BouMatic unveiled a new high-efficiency stationary carousel system featuring an integrated robotic prep arm to accelerate the pre-milking sanitization process in large-scale commercial dairy operations.
  • In December 2025, DeLaval secured a major contract to equip a new dairy facility with a fully integrated batch milking system, utilizing a fleet of interconnected robotic units to manage a herd of 5,000 cows.

Dive into Technavio’s robust research methodology, blending expert interviews, extensive data synthesis, and validated models for unparalleled Automatic Milking Machines Market insights. See full methodology.

Market Scope
Page number 283
Base year 2025
Historic period 2020-2024
Forecast period 2026-2030
Growth momentum & CAGR Accelerate at a CAGR of 7.3%
Market growth 2026-2030 USD 2052.9 million
Market structure Fragmented
YoY growth 2025-2026(%) 6.8%
Key countries Germany, The Netherlands, France, UK, Italy, Spain, US, Canada, Mexico, China, India, Japan, Australia, South Korea, Indonesia, Brazil, Argentina, Chile, Saudi Arabia, UAE, South Africa, Israel and Turkey
Competitive landscape Leading Companies, Market Positioning of Companies, Competitive Strategies, and Industry Risks

Request Free Sample

Research Analyst Overview

  • The automatic milking machines market is advancing through sophisticated integration of hardware and software. Modern robotic milking systems are increasingly designed as voluntary milking systems, including high-throughput milking configurations like batch milking configurations and robotic carousel systems. These systems utilize robotic arm precision with laser-guided teat detection and advanced teat positioner systems for milking cluster automation.
  • For different farm layouts, options range from pasture-based robotic milking and tie-stall robotic milking to portable milking units and simpler single-bucket piston machines. Core to their function are milk flow rate sensors and milk conductivity sensors for precision dairy farming, which facilitate somatic cell count monitoring and overall udder health monitoring.
  • Hygienic milking protocols are maintained through automatic teat cleaning and automated disinfection cycles. Farm efficiency is enhanced by automated herd management tools for cow traffic management, automated drafting gates, automated feeding systems, and robotic barn cleaners.
  • All this data is synthesized through cloud-based dairy analytics and predictive dairying algorithms, accessible via mobile herd management apps for remote farm monitoring and real-time health alerts, making energy-efficient milking and milking parameter optimization attainable goals.

What are the Key Data Covered in this Automatic Milking Machines Market Research and Growth Report?

  • What is the expected growth of the Automatic Milking Machines Market between 2026 and 2030?

    • USD 2.05 billion, at a CAGR of 7.3%

  • What segmentation does the market report cover?

    • The report is segmented by Product (Semi-automatic, and Fully-automatic), Mobility Type (Stationary automatic, and Portable automatic), Application (Large herd operations farms, and Small family farms) and Geography (Europe, North America, APAC, South America, Middle East and Africa)

  • Which regions are analyzed in the report?

    • Europe, North America, APAC, South America and Middle East and Africa

  • What are the key growth drivers and market challenges?

    • Increased demand for dairy products, High investment and maintenance cost of automatic milking machines

  • Who are the major players in the Automatic Milking Machines Market?

    • AMS Galaxy USA, Caprine Supply, DeLaval International AB, Delmer Group, GEA Group AG, Go Seva Agro Industries, Kovai Classic Industries, LAKTO Dairy Technologies, Lely International N.V, Mahesh Eng. Works, Milkline, Milkomax, Prompt Equipments Pvt. Ltd., Shri Krishna Industry, System Happel GmbH and Waikato Milking Systems LP

Market Research Insights

  • The market dynamics for automatic milking machines are shaped by the pursuit of operational efficiency improvement and enhanced farm profitability optimization. The adoption of labor-saving dairy technology has led to significant gains, with farms reporting a 20% increase in labor productivity. Data-driven decision making, facilitated by systems enabling individual cow monitoring, allows for precise management of herd health and nutrition.
  • This focus on proactive health management contributes to sustainable dairy production by improving animal welfare standards. Consequently, farms using these advanced systems see a return on investment not just from labor savings but also from a 5-10% improvement in milk yield per cow, underscoring the shift toward integrated farm management solutions.

We can help! Our analysts can customize this automatic milking machines market research report to meet your requirements.

Get in touch

1. Executive Summary

1.1 Market overview

Executive Summary - Chart on Market Overview
Executive Summary - Data Table on Market Overview
Executive Summary - Chart on Global Market Characteristics
Executive Summary - Chart on Market by Geography
Executive Summary - Chart on Market Segmentation by Product
Executive Summary - Chart on Market Segmentation by Mobility Type
Executive Summary - Chart on Market Segmentation by Application
Executive Summary - Chart on Incremental Growth
Executive Summary - Data Table on Incremental Growth
Executive Summary - Chart on Company Market Positioning

2. Technavio Analysis

2.1 Analysis of price sensitivity, lifecycle, customer purchase basket, adoption rates, and purchase criteria

2.2 Criticality of inputs and Factors of differentiation

Chart on Overview on criticality of inputs and factors of differentiation

2.3 Factors of disruption

Chart on Overview on factors of disruption

2.4 Impact of drivers and challenges

Chart on Impact of drivers and challenges in 2025 and 2030

3. Market Landscape

3.1 Market ecosystem

Chart on Parent Market
Data Table on - Parent Market

3.2 Market characteristics

Chart on Market characteristics analysis

3.3 Value chain analysis

Chart on Value chain analysis

4. Market Sizing

4.1 Market definition

Data Table on Offerings of companies included in the market definition

4.2 Market segment analysis

Market segments

4.3 Market size 2025

4.4 Market outlook: Forecast for 2025-2030

Chart on Global - Market size and forecast 2025-2030 ($ million)
Data Table on Global - Market size and forecast 2025-2030 ($ million)
Chart on Global Market: Year-over-year growth 2025-2030 (%)
Data Table on Global Market: Year-over-year growth 2025-2030 (%)

5. Historic Market Size

5.1 Global Automatic Milking Machines Market 2020 - 2024

Historic Market Size - Data Table on Global Automatic Milking Machines Market 2020 - 2024 ($ million)

5.2 Product segment analysis 2020 - 2024

Historic Market Size - Product Segment 2020 - 2024 ($ million)

5.3 Mobility Type segment analysis 2020 - 2024

Historic Market Size - Mobility Type Segment 2020 - 2024 ($ million)

5.4 Application segment analysis 2020 - 2024

Historic Market Size - Application Segment 2020 - 2024 ($ million)

5.5 Geography segment analysis 2020 - 2024

Historic Market Size - Geography Segment 2020 - 2024 ($ million)

5.6 Country segment analysis 2020 - 2024

Historic Market Size - Country Segment 2020 - 2024 ($ million)

6. Qualitative Analysis

6.1 Impact of AI on Global Automatic Milking Machines Market

6.2 Impact of Geopolitical Conflicts on Global Automatic Milking Machines Market

7. Five Forces Analysis

7.1 Five forces summary

Five forces analysis - Comparison between 2025 and 2030

7.2 Bargaining power of buyers

Bargaining power of buyers - Impact of key factors 2025 and 2030

7.3 Bargaining power of suppliers

Bargaining power of suppliers - Impact of key factors in 2025 and 2030

7.4 Threat of new entrants

Threat of new entrants - Impact of key factors in 2025 and 2030

7.5 Threat of substitutes

Threat of substitutes - Impact of key factors in 2025 and 2030

7.6 Threat of rivalry

Threat of rivalry - Impact of key factors in 2025 and 2030

7.7 Market condition

Chart on Market condition - Five forces 2025 and 2030

8. Market Segmentation by Product

8.1 Market segments

Chart on Product - Market share 2025-2030 (%)
Data Table on Product - Market share 2025-2030 (%)

8.2 Comparison by Product

Chart on Comparison by Product
Data Table on Comparison by Product

8.3 Semi-automatic - Market size and forecast 2025-2030

Chart on Semi-automatic - Market size and forecast 2025-2030 ($ million)
Data Table on Semi-automatic - Market size and forecast 2025-2030 ($ million)
Chart on Semi-automatic - Year-over-year growth 2025-2030 (%)
Data Table on Semi-automatic - Year-over-year growth 2025-2030 (%)

8.4 Fully-automatic - Market size and forecast 2025-2030

Chart on Fully-automatic - Market size and forecast 2025-2030 ($ million)
Data Table on Fully-automatic - Market size and forecast 2025-2030 ($ million)
Chart on Fully-automatic - Year-over-year growth 2025-2030 (%)
Data Table on Fully-automatic - Year-over-year growth 2025-2030 (%)

8.5 Market opportunity by Product

Market opportunity by Product ($ million)
Data Table on Market opportunity by Product ($ million)

9. Market Segmentation by Mobility Type

9.1 Market segments

Chart on Mobility Type - Market share 2025-2030 (%)
Data Table on Mobility Type - Market share 2025-2030 (%)

9.2 Comparison by Mobility Type

Chart on Comparison by Mobility Type
Data Table on Comparison by Mobility Type

9.3 Stationary automatic - Market size and forecast 2025-2030

Chart on Stationary automatic - Market size and forecast 2025-2030 ($ million)
Data Table on Stationary automatic - Market size and forecast 2025-2030 ($ million)
Chart on Stationary automatic - Year-over-year growth 2025-2030 (%)
Data Table on Stationary automatic - Year-over-year growth 2025-2030 (%)

9.4 Portable automatic - Market size and forecast 2025-2030

Chart on Portable automatic - Market size and forecast 2025-2030 ($ million)
Data Table on Portable automatic - Market size and forecast 2025-2030 ($ million)
Chart on Portable automatic - Year-over-year growth 2025-2030 (%)
Data Table on Portable automatic - Year-over-year growth 2025-2030 (%)

9.5 Market opportunity by Mobility Type

Market opportunity by Mobility Type ($ million)
Data Table on Market opportunity by Mobility Type ($ million)

10. Market Segmentation by Application

10.1 Market segments

Chart on Application - Market share 2025-2030 (%)
Data Table on Application - Market share 2025-2030 (%)

10.2 Comparison by Application

Chart on Comparison by Application
Data Table on Comparison by Application

10.3 Large herd operations farms - Market size and forecast 2025-2030

Chart on Large herd operations farms - Market size and forecast 2025-2030 ($ million)
Data Table on Large herd operations farms - Market size and forecast 2025-2030 ($ million)
Chart on Large herd operations farms - Year-over-year growth 2025-2030 (%)
Data Table on Large herd operations farms - Year-over-year growth 2025-2030 (%)

10.4 Small family farms - Market size and forecast 2025-2030

Chart on Small family farms - Market size and forecast 2025-2030 ($ million)
Data Table on Small family farms - Market size and forecast 2025-2030 ($ million)
Chart on Small family farms - Year-over-year growth 2025-2030 (%)
Data Table on Small family farms - Year-over-year growth 2025-2030 (%)

10.5 Market opportunity by Application

Market opportunity by Application ($ million)
Data Table on Market opportunity by Application ($ million)

11. Customer Landscape

11.1 Customer landscape overview

Analysis of price sensitivity, lifecycle, customer purchase basket, adoption rates, and purchase criteria

12. Geographic Landscape

12.1 Geographic segmentation

Chart on Market share by geography 2025-2030 (%)
Data Table on Market share by geography 2025-2030 (%)

12.2 Geographic comparison

Chart on Geographic comparison
Data Table on Geographic comparison

12.3 Europe - Market size and forecast 2025-2030

Chart on Europe - Market size and forecast 2025-2030 ($ million)
Data Table on Europe - Market size and forecast 2025-2030 ($ million)
Chart on Europe - Year-over-year growth 2025-2030 (%)
Data Table on Europe - Year-over-year growth 2025-2030 (%)
Chart on Regional Comparison - Europe
Data Table on Regional Comparison - Europe

12.3.1 Germany - Market size and forecast 2025-2030

Chart on Germany - Market size and forecast 2025-2030 ($ million)
Data Table on Germany - Market size and forecast 2025-2030 ($ million)
Chart on Germany - Year-over-year growth 2025-2030 (%)
Data Table on Germany - Year-over-year growth 2025-2030 (%)

12.3.2 The Netherlands - Market size and forecast 2025-2030

Chart on The Netherlands - Market size and forecast 2025-2030 ($ million)
Data Table on The Netherlands - Market size and forecast 2025-2030 ($ million)
Chart on The Netherlands - Year-over-year growth 2025-2030 (%)
Data Table on The Netherlands - Year-over-year growth 2025-2030 (%)

12.3.3 France - Market size and forecast 2025-2030

Chart on France - Market size and forecast 2025-2030 ($ million)
Data Table on France - Market size and forecast 2025-2030 ($ million)
Chart on France - Year-over-year growth 2025-2030 (%)
Data Table on France - Year-over-year growth 2025-2030 (%)

12.3.4 UK - Market size and forecast 2025-2030

Chart on UK - Market size and forecast 2025-2030 ($ million)
Data Table on UK - Market size and forecast 2025-2030 ($ million)
Chart on UK - Year-over-year growth 2025-2030 (%)
Data Table on UK - Year-over-year growth 2025-2030 (%)

12.3.5 Italy - Market size and forecast 2025-2030

Chart on Italy - Market size and forecast 2025-2030 ($ million)
Data Table on Italy - Market size and forecast 2025-2030 ($ million)
Chart on Italy - Year-over-year growth 2025-2030 (%)
Data Table on Italy - Year-over-year growth 2025-2030 (%)

12.3.6 Spain - Market size and forecast 2025-2030

Chart on Spain - Market size and forecast 2025-2030 ($ million)
Data Table on Spain - Market size and forecast 2025-2030 ($ million)
Chart on Spain - Year-over-year growth 2025-2030 (%)
Data Table on Spain - Year-over-year growth 2025-2030 (%)

12.4 North America - Market size and forecast 2025-2030

Chart on North America - Market size and forecast 2025-2030 ($ million)
Data Table on North America - Market size and forecast 2025-2030 ($ million)
Chart on North America - Year-over-year growth 2025-2030 (%)
Data Table on North America - Year-over-year growth 2025-2030 (%)
Chart on Regional Comparison - North America
Data Table on Regional Comparison - North America

12.4.1 US - Market size and forecast 2025-2030

Chart on US - Market size and forecast 2025-2030 ($ million)
Data Table on US - Market size and forecast 2025-2030 ($ million)
Chart on US - Year-over-year growth 2025-2030 (%)
Data Table on US - Year-over-year growth 2025-2030 (%)

12.4.2 Canada - Market size and forecast 2025-2030

Chart on Canada - Market size and forecast 2025-2030 ($ million)
Data Table on Canada - Market size and forecast 2025-2030 ($ million)
Chart on Canada - Year-over-year growth 2025-2030 (%)
Data Table on Canada - Year-over-year growth 2025-2030 (%)

12.4.3 Mexico - Market size and forecast 2025-2030

Chart on Mexico - Market size and forecast 2025-2030 ($ million)
Data Table on Mexico - Market size and forecast 2025-2030 ($ million)
Chart on Mexico - Year-over-year growth 2025-2030 (%)
Data Table on Mexico - Year-over-year growth 2025-2030 (%)

12.5 APAC - Market size and forecast 2025-2030

Chart on APAC - Market size and forecast 2025-2030 ($ million)
Data Table on APAC - Market size and forecast 2025-2030 ($ million)
Chart on APAC - Year-over-year growth 2025-2030 (%)
Data Table on APAC - Year-over-year growth 2025-2030 (%)
Chart on Regional Comparison - APAC
Data Table on Regional Comparison - APAC

12.5.1 China - Market size and forecast 2025-2030

Chart on China - Market size and forecast 2025-2030 ($ million)
Data Table on China - Market size and forecast 2025-2030 ($ million)
Chart on China - Year-over-year growth 2025-2030 (%)
Data Table on China - Year-over-year growth 2025-2030 (%)

12.5.2 India - Market size and forecast 2025-2030

Chart on India - Market size and forecast 2025-2030 ($ million)
Data Table on India - Market size and forecast 2025-2030 ($ million)
Chart on India - Year-over-year growth 2025-2030 (%)
Data Table on India - Year-over-year growth 2025-2030 (%)

12.5.3 Japan - Market size and forecast 2025-2030

Chart on Japan - Market size and forecast 2025-2030 ($ million)
Data Table on Japan - Market size and forecast 2025-2030 ($ million)
Chart on Japan - Year-over-year growth 2025-2030 (%)
Data Table on Japan - Year-over-year growth 2025-2030 (%)

12.5.4 Australia - Market size and forecast 2025-2030

Chart on Australia - Market size and forecast 2025-2030 ($ million)
Data Table on Australia - Market size and forecast 2025-2030 ($ million)
Chart on Australia - Year-over-year growth 2025-2030 (%)
Data Table on Australia - Year-over-year growth 2025-2030 (%)

12.5.5 South Korea - Market size and forecast 2025-2030

Chart on South Korea - Market size and forecast 2025-2030 ($ million)
Data Table on South Korea - Market size and forecast 2025-2030 ($ million)
Chart on South Korea - Year-over-year growth 2025-2030 (%)
Data Table on South Korea - Year-over-year growth 2025-2030 (%)

12.5.6 Indonesia - Market size and forecast 2025-2030

Chart on Indonesia - Market size and forecast 2025-2030 ($ million)
Data Table on Indonesia - Market size and forecast 2025-2030 ($ million)
Chart on Indonesia - Year-over-year growth 2025-2030 (%)
Data Table on Indonesia - Year-over-year growth 2025-2030 (%)

12.6 South America - Market size and forecast 2025-2030

Chart on South America - Market size and forecast 2025-2030 ($ million)
Data Table on South America - Market size and forecast 2025-2030 ($ million)
Chart on South America - Year-over-year growth 2025-2030 (%)
Data Table on South America - Year-over-year growth 2025-2030 (%)
Chart on Regional Comparison - South America
Data Table on Regional Comparison - South America

12.6.1 Brazil - Market size and forecast 2025-2030

Chart on Brazil - Market size and forecast 2025-2030 ($ million)
Data Table on Brazil - Market size and forecast 2025-2030 ($ million)
Chart on Brazil - Year-over-year growth 2025-2030 (%)
Data Table on Brazil - Year-over-year growth 2025-2030 (%)

12.6.2 Argentina - Market size and forecast 2025-2030

Chart on Argentina - Market size and forecast 2025-2030 ($ million)
Data Table on Argentina - Market size and forecast 2025-2030 ($ million)
Chart on Argentina - Year-over-year growth 2025-2030 (%)
Data Table on Argentina - Year-over-year growth 2025-2030 (%)

12.6.3 Chile - Market size and forecast 2025-2030

Chart on Chile - Market size and forecast 2025-2030 ($ million)
Data Table on Chile - Market size and forecast 2025-2030 ($ million)
Chart on Chile - Year-over-year growth 2025-2030 (%)
Data Table on Chile - Year-over-year growth 2025-2030 (%)

12.7 Middle East and Africa - Market size and forecast 2025-2030

Chart on Middle East and Africa - Market size and forecast 2025-2030 ($ million)
Data Table on Middle East and Africa - Market size and forecast 2025-2030 ($ million)
Chart on Middle East and Africa - Year-over-year growth 2025-2030 (%)
Data Table on Middle East and Africa - Year-over-year growth 2025-2030 (%)
Chart on Regional Comparison - Middle East and Africa
Data Table on Regional Comparison - Middle East and Africa

12.7.1 Saudi Arabia - Market size and forecast 2025-2030

Chart on Saudi Arabia - Market size and forecast 2025-2030 ($ million)
Data Table on Saudi Arabia - Market size and forecast 2025-2030 ($ million)
Chart on Saudi Arabia - Year-over-year growth 2025-2030 (%)
Data Table on Saudi Arabia - Year-over-year growth 2025-2030 (%)

12.7.2 UAE - Market size and forecast 2025-2030

Chart on UAE - Market size and forecast 2025-2030 ($ million)
Data Table on UAE - Market size and forecast 2025-2030 ($ million)
Chart on UAE - Year-over-year growth 2025-2030 (%)
Data Table on UAE - Year-over-year growth 2025-2030 (%)

12.7.3 South Africa - Market size and forecast 2025-2030

Chart on South Africa - Market size and forecast 2025-2030 ($ million)
Data Table on South Africa - Market size and forecast 2025-2030 ($ million)
Chart on South Africa - Year-over-year growth 2025-2030 (%)
Data Table on South Africa - Year-over-year growth 2025-2030 (%)

12.7.4 Israel - Market size and forecast 2025-2030

Chart on Israel - Market size and forecast 2025-2030 ($ million)
Data Table on Israel - Market size and forecast 2025-2030 ($ million)
Chart on Israel - Year-over-year growth 2025-2030 (%)
Data Table on Israel - Year-over-year growth 2025-2030 (%)

12.7.5 Turkey - Market size and forecast 2025-2030

Chart on Turkey - Market size and forecast 2025-2030 ($ million)
Data Table on Turkey - Market size and forecast 2025-2030 ($ million)
Chart on Turkey - Year-over-year growth 2025-2030 (%)
Data Table on Turkey - Year-over-year growth 2025-2030 (%)

12.8 Market opportunity by geography

Market opportunity by geography ($ million)
Data Tables on Market opportunity by geography ($ million)

13. Drivers, Challenges, and Opportunity

13.1 Market drivers

Increased demand for dairy products
Rise in focus on improving milk quality and yield
Increasing number of large-scale dairy farms

13.2 Market challenges

High investment and maintenance cost of automatic milking machines
Low adoption of automatic milking machines in developing economies
Operational issues of automatic milking machines

13.3 Impact of drivers and challenges

Impact of drivers and challenges in 2025 and 2030

13.4 Market opportunities

Rising demand for sensor-based milking
Surge in usage of single bucket piston type automatic milking machines
Growing inclination towards automation of milking machines with mobile applications

14. Competitive Landscape

14.1 Overview

14.2

Overview on criticality of inputs and factors of differentiation

14.3 Landscape disruption

Overview on factors of disruption

14.4 Industry risks

Impact of key risks on business

15. Competitive Analysis

15.1 Companies profiled

Companies covered

15.2 Company ranking index

15.3 Market positioning of companies

Matrix on companies position and classification

15.4 AMS Galaxy USA

AMS Galaxy USA - Overview
AMS Galaxy USA - Product / Service
AMS Galaxy USA - Key offerings
SWOT

15.5 Caprine Supply

Caprine Supply - Overview
Caprine Supply - Product / Service
Caprine Supply - Key offerings
SWOT

15.6 DeLaval International AB

DeLaval International AB - Overview
DeLaval International AB - Product / Service
DeLaval International AB - Key offerings
SWOT

15.7 Delmer Group

Delmer Group - Overview
Delmer Group - Product / Service
Delmer Group - Key offerings
SWOT

15.8 GEA Group AG

GEA Group AG - Overview
GEA Group AG - Business segments
GEA Group AG - Key offerings
GEA Group AG - Segment focus
SWOT

15.9 Go Seva Agro Industries

Go Seva Agro Industries - Overview
Go Seva Agro Industries - Product / Service
Go Seva Agro Industries - Key offerings
SWOT

15.10 Kovai Classic Industries

Kovai Classic Industries - Overview
Kovai Classic Industries - Product / Service
Kovai Classic Industries - Key offerings
SWOT

15.11 LAKTO Dairy Technologies

LAKTO Dairy Technologies - Overview
LAKTO Dairy Technologies - Product / Service
LAKTO Dairy Technologies - Key offerings
SWOT

15.12 Lely International N.V

Lely International N.V - Overview
Lely International N.V - Product / Service
Lely International N.V - Key offerings
SWOT

15.13 Mahesh Eng. Works

Mahesh Eng. Works - Overview
Mahesh Eng. Works - Product / Service
Mahesh Eng. Works - Key offerings
SWOT

15.14 Milkline

Milkline - Overview
Milkline - Product / Service
Milkline - Key offerings
SWOT

15.15 Milkomax

Milkomax - Overview
Milkomax - Product / Service
Milkomax - Key offerings
SWOT

15.16 Prompt Equipments Pvt. Ltd.

Prompt Equipments Pvt. Ltd. - Overview
Prompt Equipments Pvt. Ltd. - Product / Service
Prompt Equipments Pvt. Ltd. - Key offerings
SWOT

15.17 Shri Krishna Industry

Shri Krishna Industry - Overview
Shri Krishna Industry - Product / Service
Shri Krishna Industry - Key offerings
SWOT

15.18 System Happel GmbH

System Happel GmbH - Overview
System Happel GmbH - Product / Service
System Happel GmbH - Key offerings
SWOT

16. Appendix

16.1 Scope of the report

Market definition
Objectives
Notes and caveats

16.2 Inclusions and exclusions checklist

Inclusions checklist
Exclusions checklist

16.3 Currency conversion rates for US$

16.4 Research methodology

16.5 Data procurement

Information sources

16.6 Data validation

16.7 Validation techniques employed for market sizing

16.8 Data synthesis

16.9 360 degree market analysis

16.10 List of abbreviations

Research Methodology

Technavio presents a detailed picture of the market by way of study, synthesis, and summation of data from multiple sources. The analysts have presented the various facets of the market with a particular focus on identifying the key industry influencers. The data thus presented is comprehensive, reliable, and the result of extensive research, both primary and secondary.

INFORMATION SOURCES

Primary sources

  • Manufacturers and suppliers
  • Channel partners
  • Industry experts
  • Strategic decision makers

Secondary sources

  • Industry journals and periodicals
  • Government data
  • Financial reports of key industry players
  • Historical data
  • Press releases

DATA ANALYSIS

Data Synthesis

  • Collation of data
  • Estimation of key figures
  • Analysis of derived insights

Data Validation

  • Triangulation with data models
  • Reference against proprietary databases
  • Corroboration with industry experts

REPORT WRITING

Qualitative

  • Market drivers
  • Market challenges
  • Market trends
  • Five forces analysis

Quantitative

  • Market size and forecast
  • Market segmentation
  • Geographical insights
  • Competitive landscape

Interested in this report?

Get your sample now to see our research methodology and insights!

Download Now

Frequently Asked Questions

Automatic Milking Machines market growth will increase by USD 2052.9 million during 2026-2030.

The Automatic Milking Machines market is expected to grow at a CAGR of 7.3% during 2026-2030.

Automatic Milking Machines market is segmented by Product (Semi-automatic, Fully-automatic) Mobility type (Stationary automatic, Portable automatic) Application (Large herd operations farms, Small family farms)

AMS Galaxy USA, Caprine Supply, DeLaval International AB, Delmer Group, GEA Group AG, Go Seva Agro Industries, Kovai Classic Industries, LAKTO Dairy Technologies, Lely International N.V, Mahesh Eng. Works, Milkline, Milkomax, Prompt Equipments Pvt. Ltd., Shri Krishna Industry, System Happel GmbH, Waikato Milking Systems LP are a few of the key vendors in the Automatic Milking Machines market.

Europe will register the highest growth rate of 43.1% among the other regions. Therefore, the Automatic Milking Machines market in Europe is expected to garner significant business opportunities for the vendors during the forecast period.

Germany, The Netherlands, France, UK, Italy, Spain, US, Canada, Mexico, China, India, Japan, Australia, South Korea, Indonesia, Brazil, Argentina, Chile, Saudi Arabia, UAE, South Africa, Israel, Turkey

  • Increased demand for dairy products is the driving factor this market.

The Automatic Milking Machines market vendors should focus on grabbing business opportunities from the Product segment as it accounted for the largest market share in the base year.
RIA - Research AI Assistant
Ask RIA