Sleeping Aids Market Analysis, Size, and Forecast 2025-2029: North America (US and Canada), Europe (France, Germany, Italy, and UK), APAC (China, India, and Japan), South America (Brazil), and Rest of World (ROW)

Sleeping Aids Market Analysis, Size, and Forecast 2025-2029:
North America (US and Canada), Europe (France, Germany, Italy, and UK), APAC (China, India, and Japan), South America (Brazil), and Rest of World (ROW)

Published: Jun 2025 233 Pages SKU: IRTNTR70685

Market Overview at a Glance

$47.03 B
Market Opportunity
7.6%
CAGR
6.6
YoY growth 2024-2025(%)

Sleeping Aids Market Size 2025-2029

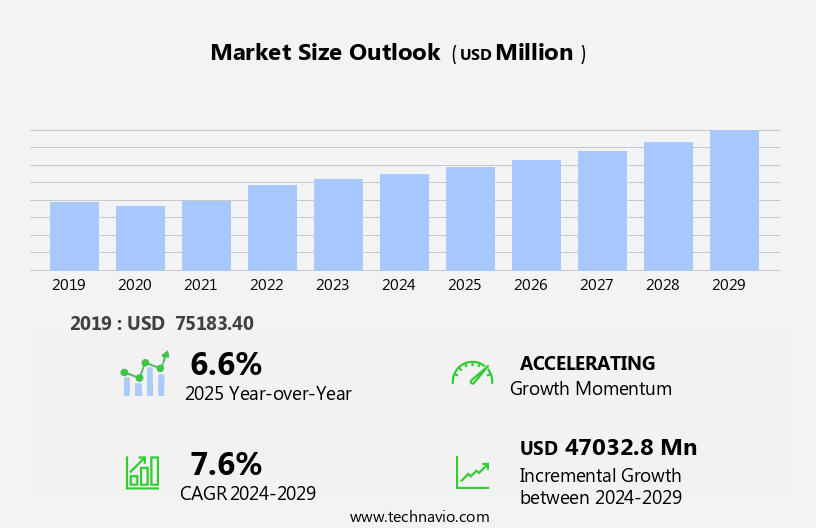
The sleeping aids market size is forecast to increase by USD 47.03 billion, at a CAGR of 7.6% between 2024 and 2029.

  • The market is experiencing significant growth, driven by the increasing technological innovations in Continuous Positive Airway Pressure (CPAP) devices. These advancements aim to enhance user experience and effectiveness, addressing the primary challenge of patient compliance. Furthermore, the use of the internet as a marketing tool and a platform for creating awareness is fueling market expansion. However, the high cost of sleeping aids remains a notable challenge for both manufacturers and consumers.
  • Companies must maintain a balance between affordability and innovation to cater to the growing demand while maintaining profitability. To capitalize on market opportunities and navigate challenges effectively, strategic business decisions and operational planning should focus on product differentiation, cost optimization, and consumer education. Sleep studies, conducted in sleep centers, help diagnose various sleep disorders, including sleep-disordered breathing, obstructive sleep apnea, and central sleep apnea.

What will be the Size of the Sleeping Aids Market during the forecast period?

Sleeping Aids Market Size

Explore in-depth regional segment analysis with market size data - historical 2019-2023 and forecasts 2025-2029 - in the full report.  
Request Free Sample

The market continues to evolve, driven by advancements in technology and a growing awareness of the importance of sleep health. Sleep-disordered breathing, including central sleep apnea and obstructive sleep apnea, remains a significant focus, with medical devices such as CPAP and APAP therapy, oral appliances, and BIPAP therapy offering solutions. Daytime sleepiness is a common symptom, leading to the development of tools like the Epworth Sleepiness Scale and Stanford Sleepiness Scale for assessment. Wearable sensors and smartphone apps are transforming sleep monitoring, providing real-time data on sleep stages, sleep architecture, and sleep quality. Sleep fragmentation, respiratory events, and oxygen saturation are critical metrics, while data analytics and AI-powered sleep analysis offer insights into patterns and trends.

Circadian rhythm disorders, mood disorders, and cardiac events are among the various health conditions linked to sleep disturbances. Sleep hygiene, remote patient monitoring, and smart beds are essential components of preventive care. Restless legs syndrome, sleep paralysis, and sleep talking are other sleep-related issues gaining attention. The market dynamics are continuously unfolding, with ongoing research into sleep architecture, sleep efficiency, sleep latency, and sleep diaries. The integration of technology and healthcare is revolutionizing the industry, offering innovative solutions for improving sleep quality and overall health.

How is this Sleeping Aids Industry segmented?

The sleeping aids industry research report provides comprehensive data (region-wise segment analysis), with forecasts and estimates in "USD million" for the period 2025-2029, as well as historical data from 2019-2023 for the following segments.

  • Type
    • Insomnia
    • Sleep apnea
    • Primary restless legs syndrome
    • Others
  • Product
    • Mattress and pillows
    • Sleep apnea devices
    • Others
  • Distribution Channel
    • Retail pharmacies
    • E-commerce
    • Hospital pharmacies
    • Drug stores
  • Geography
    • North America
      • US
      • Canada
    • Europe
      • France
      • Germany
      • Italy
      • UK
    • APAC
      • China
      • India
      • Japan
    • South America
      • Brazil
    • Rest of World (ROW)

By Type Insights

The insomnia segment is estimated to witness significant growth during the forecast period. Insomnia, a prevalent sleep disorder, affects approximately 12% of American adults, with up to 50% reporting symptoms at some point during the year. Chronic insomnia, defined as sleep disturbances for three months or more, is a significant health concern. Central sleep apnea, sleep paralysis, cognitive impairment, circadian rhythm disorders, mood disorders, and cardiac events can exacerbate insomnia. Sleep-disordered breathing, including sleep-talking and sleep fragmentation, can also impact sleep quality. Advancements in medical devices, such as CPAP and APAP therapy, oral appliances, and smart beds, offer potential solutions. Remote patient monitoring, wearable sensors, and data analytics enable continuous tracking of sleep patterns and respiratory events.

Bipap therapy, the Epworth Sleepiness Scale, and the Stanford Sleepiness Scale are additional tools used to assess and manage sleep disorders. Insomnia remains a common sleep disorder in the US, affecting millions of adults. Advancements in medical devices, technology, and natural remedies offer potential solutions to improve sleep quality and address underlying sleep disorders. Sleep-promoting foods, herbal supplements, and over-the-counter sleep aids are popular solutions for individuals seeking to optimize their sleep.

Sleeping Aids Market Size

Request Free Sample

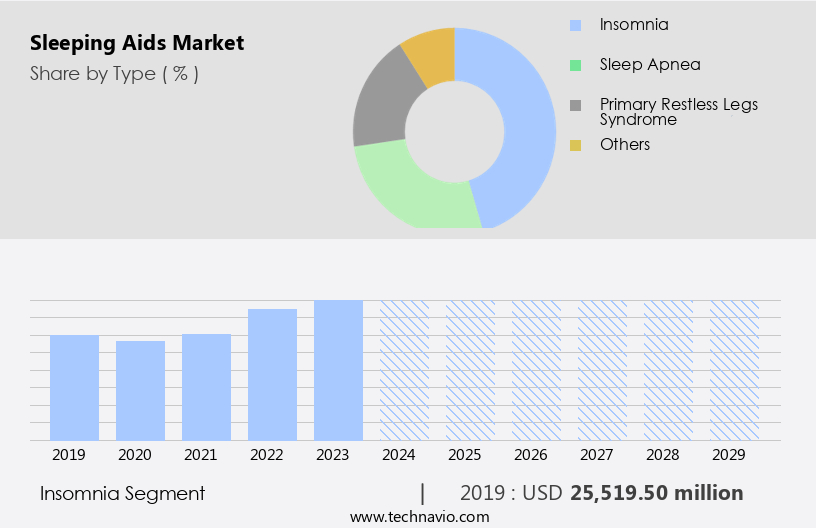
The Insomnia segment was valued at USD 25.52 billion in 2019 and showed a gradual increase during the forecast period.

The Sleeping Aids market is experiencing steady growth as sleep disorders become increasingly common in today's fast-paced world. A key segment includes sleep medications, widely used to manage chronic insomnia and other related conditions. However, safe use relies heavily on awareness of drug interactions, especially for individuals on multiple prescriptions. Beyond pharmacological solutions, environmental factors like bedroom temperature also play a critical role, with optimal cooling shown to enhance sleep quality. For long-term effectiveness, treatment adherence is essential—consistent use and proper guidance improve outcomes significantly. People with diabetes face higher healthcare costs and a two to three times greater risk of cardiovascular diseases and related comorbidities.

AI-powered sleep analysis and smartphone apps provide personalized insights into sleep stages, sleep architecture, and sleep efficiency. Restless legs syndrome, night terrors, and sleep-walking are additional sleep disorders that can affect overall sleep quality. The apnea-hypopnea index (AHI) is a diagnostic tool used to measure respiratory events during sleep. Valerian root, a natural supplement, may help improve sleep quality for some individuals. Circadian rhythm disorders and mood disorders can also impact sleep, leading to daytime sleepiness and decreased cognitive function. Oxygen saturation monitoring is essential for individuals with sleep-disordered breathing, ensuring adequate oxygen supply during sleep. Incorporating good sleep hygiene practices, such as maintaining a consistent sleep schedule and avoiding caffeine intake, can improve sleep quality.

Regional Analysis

North America is estimated to contribute 40% to the growth of the global market during the forecast period. Technavio's analysts have elaborately explained the regional trends and drivers that shape the market during the forecast period.

Sleeping Aids Market Share by Geography

 Request Free Sample

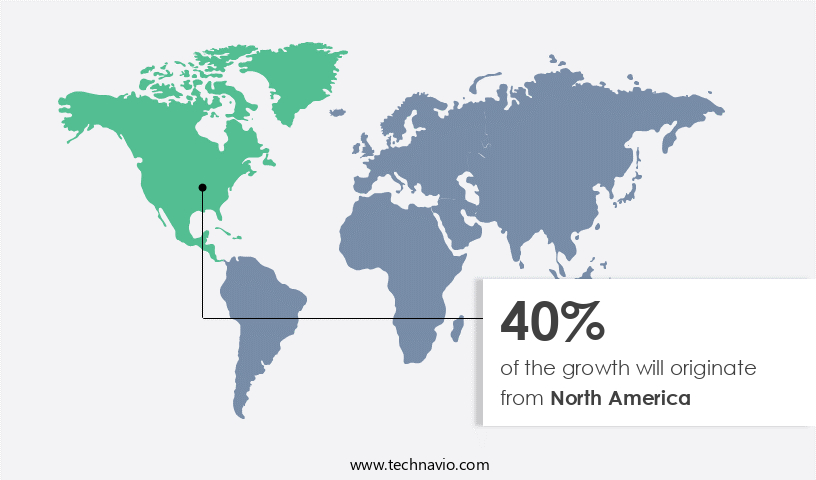
The North American market holds a significant share in the global market due to the increasing prevalence of conditions such as diabetes, sleep-disordered breathing, restless legs syndrome, and circadian rhythm disorders. According to the Pan American Health Organization, healthcare expenditures for diabetes in the Americas are projected to reach USD 445.6 billion by 2040. In North America, approximately 34.2 million people have diabetes, representing 10.5% of the US population. People with diabetes face higher healthcare costs, with expenses being two to three times greater than for those without diabetes. Moreover, the risk of cardiac events and other related comorbidities is also increased by two to three times among people with diabetes.

Sleep-related issues like sleep apnea, sleep fragmentation, and daytime sleepiness are common among people with these conditions. To address these concerns, various sleep aids such as oral appliances, APAP therapy, CPAP therapy, and medical devices have gained popularity. Advanced technologies like AI-powered sleep analysis, remote patient monitoring, smart beds, and wearable sensors are also being adopted to improve sleep quality and efficiency. Additionally, mood disorders, cognitive impairment, and sleep paralysis can also impact sleep patterns, leading to the use of sleep aids. Smartphone apps, the Epworth Sleepiness Scale, and the Stanford Sleepiness Scale are some tools used to assess sleep quality and daytime sleepiness.

Valerian root is a natural supplement that has been used to promote sleep. Sleep stages and sleep architecture are essential aspects of sleep health, and sleep diaries and sleep trackers help individuals monitor their sleep patterns. Data analytics plays a crucial role in identifying respiratory events, sleep talking, and oxygen saturation levels during sleep. Bipap therapy and CPAP therapy are effective treatments for sleep-disordered breathing, while night terrors and apnea-hypopnea index (AHI) are common sleep disorders. Sleep hygiene practices and circadian rhythm disorders also influence sleep quality.

Market Dynamics

Our researchers analyzed the data with 2024 as the base year, along with the key drivers, trends, and challenges. A holistic analysis of drivers will help companies refine their marketing strategies to gain a competitive advantage.

What are the key market drivers leading to the rise in the adoption of Sleeping Aids Industry?

  • The continuous advancements in CPAP (Continuous Positive Airway Pressure) technology are the primary catalyst fueling market growth. The market has seen significant advancements due to technological innovations, leading to the development of more effective solutions for sleep-disordered breathing. Companies are investing in research and development to create innovative Continuous Positive Airway Pressure (CPAP) devices and accessories. These technological strides have resulted in the production of lightweight interface masks with soft sealing flanges and fewer accessories, making them easier to use and more adaptable to various face geometries.
  • Sleep disorders such as restless legs syndrome, sleep fragmentation, mixed sleep apnea, and sleep apnea are prevalent, and the market is responding with AI-powered sleep analysis and medical devices that cater to these conditions. Oral appliances and CPAP therapy remain popular solutions, with CPAP therapy offering APAP (Automatic Positive Airway Pressure) and CPAP (Continuous Positive Airway Pressure) options. The market is expected to continue growing as more people seek effective solutions for sleep disorders, ensuring total sleep time and overall health improvement. Furthermore, the integration of IT data systems with CPAP and monitoring devices reduces costs and time while enhancing therapy efficiency. For instance, Hans Rudolph's latest full-face masks cater to the global market demands with advanced features.

What are the market trends shaping the Sleeping Aids Industry?

  • The use of the internet for creating awareness is an emerging market trend. This digital approach to raising public consciousness is increasingly popular among professionals and organizations. The market is witnessing significant growth due to the increasing prevalence of daytime sleepiness and the need for improved sleep quality. Advanced technologies, such as wearable sensors and smartphone apps, are transforming the industry by providing valuable insights into sleep stages, sleep architecture, and sleep disorders like apnea-hypopnea index (AHI) and night terrors. CPAP devices, on the other hand, are medical devices used to treat sleep apnea and require regular maintenance and replacement of parts.
  • Companies are leveraging these trends to expand their offerings and capture a larger market share. Online platforms enable easy access to information and comparison of various products and services, enhancing brand visibility and customer engagement. The future of the market lies in innovative solutions that prioritize user experience, comfort, and effectiveness. Bipap therapy is another emerging solution for sleep apnea patients, offering better comfort and effectiveness compared to traditional CPAP devices. The Epworth Sleepiness Scale is a widely used tool to assess daytime sleepiness, highlighting the importance of addressing sleep disorders.

What challenges does the Sleeping Aids Industry face during its growth?

  • The escalating costs of products pose a significant challenge to the industry's growth trajectory. Sleeping aids, including pressure-relief mattresses and Continuous Positive Airway Pressure (CPAP) devices, cater to individuals experiencing sleeping disorders such as sleep apnea. While pressure-relief mattresses are considered lifestyle products, their cost varies from USD530 to USD4,000 based on features. Unlike other lifestyle products, these mattresses do not necessitate frequent maintenance or services for optimal performance. However, their long lifespan and high price point significantly decrease the likelihood of repurchases.
  • Tools like sleep diaries, sleep trackers, and the Stanford Sleepiness Scale are used to assess sleep efficiency, sleep latency, and oxygen saturation levels. Valerian root, a natural sleep aid, is also gaining popularity due to its potential benefits in improving sleep quality. These devices monitor respiratory events and adjust oxygen saturation levels accordingly, ensuring a restful and uninterrupted sleep. As research continues to uncover new insights into sleep disorders and their treatments, the market is expected to evolve further, offering innovative solutions to improve overall sleep health. The market for sleeping aids is influenced by several factors, including the prevalence of sleeping disorders and advancements in technology. Data analytics plays a crucial role in understanding sleep patterns and disorders, enabling the development of more effective solutions.

Exclusive Customer Landscape

The sleeping aids market forecasting report includes the adoption lifecycle of the market, covering from the innovator's stage to the laggard's stage. It focuses on adoption rates in different regions based on penetration. Furthermore, the sleeping aids market report also includes key purchase criteria and drivers of price sensitivity to help companies evaluate and develop their market growth analysis strategies.
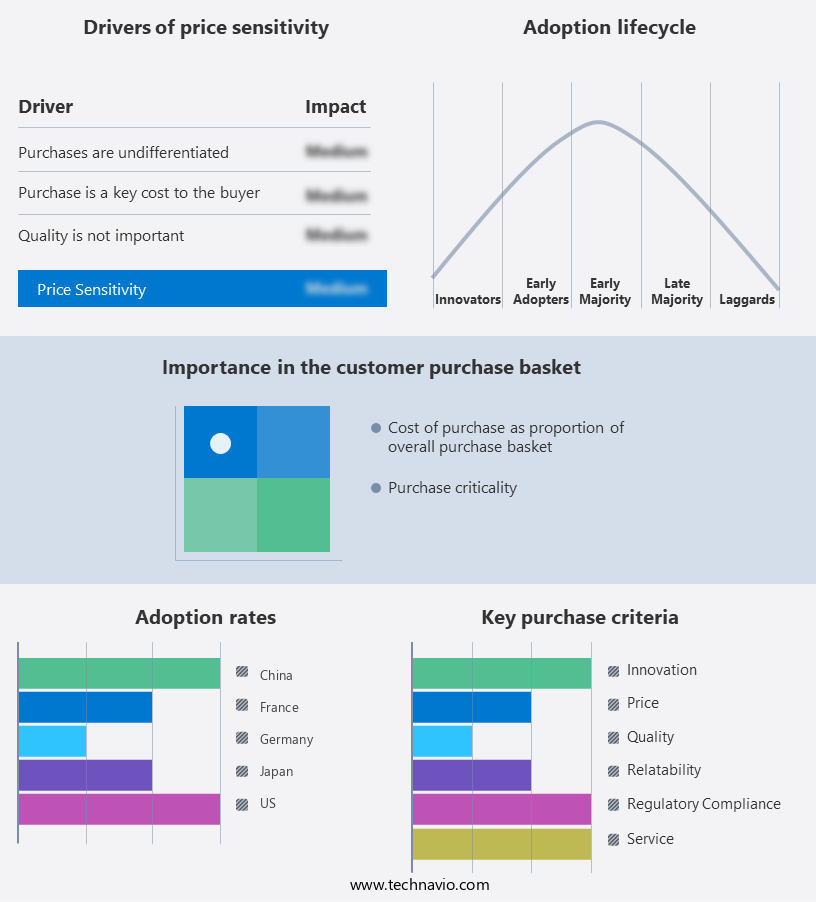
Sleeping Aids Market Share by Geography

 Customer Landscape

Key Companies & Market Insights

Companies are implementing various strategies, such as strategic alliances, sleeping aids market forecast, partnerships, mergers and acquisitions, geographical expansion, and product/service launches, to enhance their presence in the industry.

ActiGraph LLC - The company specializes in Sleeping Aids and offers a cutting-edge wearable device that analyzes sleep patterns, using advanced algorithms to deliver data-driven insights and personalized recommendations for optimal sleep quality.

The industry research and growth report includes detailed analyses of the competitive landscape of the market and information about key companies, including:

  • ActiGraph LLC
  • AstraZeneca Plc
  • Becton Dickinson and Co.
  • Cadwell Industries Inc.
  • Compumedics Ltd.
  • CSL Ltd.
  • F. Hoffmann La Roche Ltd.
  • GlaxoSmithKline Plc
  • Koninklijke Philips NV
  • Medical Depot Inc.
  • Merck and Co. Inc.
  • Natus Medical Inc.
  • Pfizer Inc.
  • Sanofi SA
  • Serta Inc.
  • SleepMed Inc.
  • Takeda Pharmaceutical Co. Ltd.
  • Talley Group Ltd.

Qualitative and quantitative analysis of companies has been conducted to help clients understand the wider business environment as well as the strengths and weaknesses of key industry players. Data is qualitatively analyzed to categorize companies as pure play, category-focused, industry-focused, and diversified; it is quantitatively analyzed to categorize companies as dominant, leading, strong, tentative, and weak.

Recent Development and News in Sleeping Aids Market

  • In January 2024, pharmaceutical company Merck KGaA announced the FDA approval of its new sleep aid product, "Suvorexant," which targets insomnia by blocking orexin receptors in the brain (Merck KGaA press release, 2024).
  • In March 2024, sleep technology firm Philips unveiled its new smart sleep solution, "DreamMapper," which uses advanced analytics to help users identify patterns and improve their sleep quality (Philips press release, 2024).
  • In April 2024, medical device manufacturer ResMed acquired sleep diagnostics company Medibyte for an undisclosed sum, aiming to expand its digital health offerings and improve sleep apnea diagnosis and treatment (ResMed press release, 2024).
  • In May 2025, the European Commission approved the merger of sleep aid market leaders, Sanofi and Boehringer Ingelheim, subject to certain conditions, creating a global powerhouse in the sector (European Commission press release, 2025).

Research Analyst Overview

The market encompasses various solutions aimed at improving sleep quality, including sleep environment modifications, consumer preferences for alternative treatments, and prescription sleeping pills. Alcohol consumption and certain medications, such as prescription sleeping pills, can interact, affecting drug efficacy and patient compliance. Clinical trials explore the effectiveness of herbal remedies and relaxation techniques, while regulatory approvals streamline access to over-the-counter sleep aids. Lifestyle modifications, like stress management, smoking cessation, weight management, and noise reduction, play a crucial role in enhancing sleep quality. Sleep positions, caffeine consumption, and light exposure also influence restorative rest. Pillow selection and comfortable bedding contribute to a conducive sleep environment.

Product innovation in the market includes drug-free solutions like dietary supplements and comfortable bedding. Consumers increasingly seek treatment adherence-friendly options, with minimal side effects and improved patient compliance. Mattress selection, based on personal comfort and support, is another essential factor in ensuring a restful night. Incorporating relaxation techniques and stress management practices into daily routines can help mitigate the need for prescription sleeping pills and improve overall sleep health. Consumers prioritize drug efficacy and safety, driving demand for innovative, effective, and non-habit-forming sleep solutions. Moreover, sleep's impact on mental health, cognitive function, and emotion regulation underscores the importance of addressing sleep-related issues in today's fast-paced business environment.

Dive into Technavio's robust research methodology, blending expert interviews, extensive data synthesis, and validated models for unparalleled Sleeping Aids Market insights. See full methodology.

Market Scope

Report Coverage

Details

Page number

233

Base year

2024

Historic period

2019-2023

Forecast period

2025-2029

Growth momentum & CAGR

Accelerate at a CAGR of 7.6%

Market growth 2025-2029

USD 47.03 billion

Market structure

Fragmented

YoY growth 2024-2025(%)

6.6

Key countries

US, Germany, China, France, Japan, Canada, Brazil, UK, Italy, and India

Competitive landscape

Leading Companies, Market Positioning of Companies, Competitive Strategies, and Industry Risks

Request Free Sample

What are the Key Data Covered in this Sleeping Aids Market Research and Growth Report?

  • CAGR of the Sleeping Aids industry during the forecast period
  • Detailed information on factors that will drive the growth and forecasting between 2025 and 2029
  • Precise estimation of the size of the market and its contribution of the industry in focus to the parent market
  • Accurate predictions about upcoming growth and trends and changes in consumer behaviour
  • Growth of the market across North America, Europe, APAC, South America, and Middle East and Africa
  • Thorough analysis of the market's competitive landscape and detailed information about companies
  • Comprehensive analysis of factors that will challenge the sleeping aids market growth of industry companies

We can help! Our analysts can customize this sleeping aids market research report to meet your requirements.

Get in touch

1 Executive Summary

  • 1.1 Market overview
    • Executive Summary - Chart on Market Overview
    • Executive Summary - Data Table on Market Overview
    • Executive Summary - Chart on Global Market Characteristics
    • Executive Summary - Chart on Market by Geography
    • Executive Summary - Chart on Market Segmentation by Type
    • Executive Summary - Chart on Market Segmentation by Product
    • Executive Summary - Chart on Market Segmentation by Distribution Channel
    • Executive Summary - Chart on Incremental Growth
    • Executive Summary - Data Table on Incremental Growth
    • Executive Summary - Chart on Company Market Positioning

2 Technavio Analysis

  • 2.1 Analysis of price sensitivity, lifecycle, customer purchase basket, adoption rates, and purchase criteria
    • Analysis of price sensitivity, lifecycle, customer purchase basket, adoption rates, and purchase criteria
  • 2.2 Criticality of inputs and Factors of differentiation
    • Overview on criticality of inputs and factors of differentiation
  • 2.3 Factors of disruption
    • Overview on factors of disruption
  • 2.4 Impact of drivers and challenges
    • Impact of drivers and challenges in 2024 and 2029

3 Market Landscape

  • 3.1 Market ecosystem
    • Parent Market
    • Data Table on - Parent Market
  • 3.2 Market characteristics
    • Market characteristics analysis
  • 3.3 Value chain analysis
    • Value chain analysis

4 Market Sizing

  • 4.1 Market definition
    • Offerings of companies included in the market definition
  • 4.2 Market segment analysis
    • Market segments
  • 4.3 Market size 2024
    • 4.4 Market outlook: Forecast for 2024-2029
      • Chart on Global - Market size and forecast 2024-2029 ($ million)
      • Data Table on Global - Market size and forecast 2024-2029 ($ million)
      • Chart on Global Market: Year-over-year growth 2024-2029 (%)
      • Data Table on Global Market: Year-over-year growth 2024-2029 (%)

    5 Historic Market Size

    • 5.1 Global Sleeping Aids Market 2019 - 2023
      • Historic Market Size - Data Table on Global Sleeping Aids Market 2019 - 2023 ($ million)
    • 5.2 Type segment analysis 2019 - 2023
      • Historic Market Size - Type Segment 2019 - 2023 ($ million)
    • 5.3 Product segment analysis 2019 - 2023
      • Historic Market Size - Product Segment 2019 - 2023 ($ million)
    • 5.4 Distribution Channel segment analysis 2019 - 2023
      • Historic Market Size - Distribution Channel Segment 2019 - 2023 ($ million)
    • 5.5 Geography segment analysis 2019 - 2023
      • Historic Market Size - Geography Segment 2019 - 2023 ($ million)
    • 5.6 Country segment analysis 2019 - 2023
      • Historic Market Size - Country Segment 2019 - 2023 ($ million)

    6 Qualitative Analysis

    • 6.1 The impact of AI in the global sleeping aids market

      7 Five Forces Analysis

      • 7.1 Five forces summary
        • Five forces analysis - Comparison between 2024 and 2029
      • 7.2 Bargaining power of buyers
        • Bargaining power of buyers - Impact of key factors 2024 and 2029
      • 7.3 Bargaining power of suppliers
        • Bargaining power of suppliers - Impact of key factors in 2024 and 2029
      • 7.4 Threat of new entrants
        • Threat of new entrants - Impact of key factors in 2024 and 2029
      • 7.5 Threat of substitutes
        • Threat of substitutes - Impact of key factors in 2024 and 2029
      • 7.6 Threat of rivalry
        • Threat of rivalry - Impact of key factors in 2024 and 2029
      • 7.7 Market condition
        • Chart on Market condition - Five forces 2024 and 2029

      8 Market Segmentation by Type

      • 8.1 Market segments
        • Chart on Type - Market share 2024-2029 (%)
        • Data Table on Type - Market share 2024-2029 (%)
      • 8.2 Comparison by Type
        • Chart on Comparison by Type
        • Data Table on Comparison by Type
      • 8.3 Insomnia - Market size and forecast 2024-2029
        • Chart on Insomnia - Market size and forecast 2024-2029 ($ million)
        • Data Table on Insomnia - Market size and forecast 2024-2029 ($ million)
        • Chart on Insomnia - Year-over-year growth 2024-2029 (%)
        • Data Table on Insomnia - Year-over-year growth 2024-2029 (%)
      • 8.4 Sleep apnea - Market size and forecast 2024-2029
        • Chart on Sleep apnea - Market size and forecast 2024-2029 ($ million)
        • Data Table on Sleep apnea - Market size and forecast 2024-2029 ($ million)
        • Chart on Sleep apnea - Year-over-year growth 2024-2029 (%)
        • Data Table on Sleep apnea - Year-over-year growth 2024-2029 (%)
      • 8.5 Primary restless legs syndrome - Market size and forecast 2024-2029
        • Chart on Primary restless legs syndrome - Market size and forecast 2024-2029 ($ million)
        • Data Table on Primary restless legs syndrome - Market size and forecast 2024-2029 ($ million)
        • Chart on Primary restless legs syndrome - Year-over-year growth 2024-2029 (%)
        • Data Table on Primary restless legs syndrome - Year-over-year growth 2024-2029 (%)
      • 8.6 Others - Market size and forecast 2024-2029
        • Chart on Others - Market size and forecast 2024-2029 ($ million)
        • Data Table on Others - Market size and forecast 2024-2029 ($ million)
        • Chart on Others - Year-over-year growth 2024-2029 (%)
        • Data Table on Others - Year-over-year growth 2024-2029 (%)
      • 8.7 Market opportunity by Type
        • Market opportunity by Type ($ million)
        • Data Table on Market opportunity by Type ($ million)

      9 Market Segmentation by Product

      • 9.1 Market segments
        • Chart on Product - Market share 2024-2029 (%)
        • Data Table on Product - Market share 2024-2029 (%)
      • 9.2 Comparison by Product
        • Chart on Comparison by Product
        • Data Table on Comparison by Product
      • 9.3 Mattress and pillows - Market size and forecast 2024-2029
        • Chart on Mattress and pillows - Market size and forecast 2024-2029 ($ million)
        • Data Table on Mattress and pillows - Market size and forecast 2024-2029 ($ million)
        • Chart on Mattress and pillows - Year-over-year growth 2024-2029 (%)
        • Data Table on Mattress and pillows - Year-over-year growth 2024-2029 (%)
      • 9.4 Sleep apnea devices - Market size and forecast 2024-2029
        • Chart on Sleep apnea devices - Market size and forecast 2024-2029 ($ million)
        • Data Table on Sleep apnea devices - Market size and forecast 2024-2029 ($ million)
        • Chart on Sleep apnea devices - Year-over-year growth 2024-2029 (%)
        • Data Table on Sleep apnea devices - Year-over-year growth 2024-2029 (%)
      • 9.5 Others - Market size and forecast 2024-2029
        • Chart on Others - Market size and forecast 2024-2029 ($ million)
        • Data Table on Others - Market size and forecast 2024-2029 ($ million)
        • Chart on Others - Year-over-year growth 2024-2029 (%)
        • Data Table on Others - Year-over-year growth 2024-2029 (%)
      • 9.6 Market opportunity by Product
        • Market opportunity by Product ($ million)
        • Data Table on Market opportunity by Product ($ million)

      10 Market Segmentation by Distribution Channel

      • 10.1 Market segments
        • Chart on Distribution Channel - Market share 2024-2029 (%)
        • Data Table on Distribution Channel - Market share 2024-2029 (%)
      • 10.2 Comparison by Distribution Channel
        • Chart on Comparison by Distribution Channel
        • Data Table on Comparison by Distribution Channel
      • 10.3 Retail pharmacies - Market size and forecast 2024-2029
        • Chart on Retail pharmacies - Market size and forecast 2024-2029 ($ million)
        • Data Table on Retail pharmacies - Market size and forecast 2024-2029 ($ million)
        • Chart on Retail pharmacies - Year-over-year growth 2024-2029 (%)
        • Data Table on Retail pharmacies - Year-over-year growth 2024-2029 (%)
      • 10.4 E-commerce - Market size and forecast 2024-2029
        • Chart on E-commerce - Market size and forecast 2024-2029 ($ million)
        • Data Table on E-commerce - Market size and forecast 2024-2029 ($ million)
        • Chart on E-commerce - Year-over-year growth 2024-2029 (%)
        • Data Table on E-commerce - Year-over-year growth 2024-2029 (%)
      • 10.5 Hospital pharmacies - Market size and forecast 2024-2029
        • Chart on Hospital pharmacies - Market size and forecast 2024-2029 ($ million)
        • Data Table on Hospital pharmacies - Market size and forecast 2024-2029 ($ million)
        • Chart on Hospital pharmacies - Year-over-year growth 2024-2029 (%)
        • Data Table on Hospital pharmacies - Year-over-year growth 2024-2029 (%)
      • 10.6 Drug stores - Market size and forecast 2024-2029
        • Chart on Drug stores - Market size and forecast 2024-2029 ($ million)
        • Data Table on Drug stores - Market size and forecast 2024-2029 ($ million)
        • Chart on Drug stores - Year-over-year growth 2024-2029 (%)
        • Data Table on Drug stores - Year-over-year growth 2024-2029 (%)
      • 10.7 Market opportunity by Distribution Channel
        • Market opportunity by Distribution Channel ($ million)
        • Data Table on Market opportunity by Distribution Channel ($ million)

      11 Customer Landscape

      • 11.1 Customer landscape overview
        • Analysis of price sensitivity, lifecycle, customer purchase basket, adoption rates, and purchase criteria

      12 Geographic Landscape

      • 12.1 Geographic segmentation
        • Chart on Market share by geography 2024-2029 (%)
        • Data Table on Market share by geography 2024-2029 (%)
      • 12.2 Geographic comparison
        • Chart on Geographic comparison
        • Data Table on Geographic comparison
      • 12.3 North America - Market size and forecast 2024-2029
        • Chart on North America - Market size and forecast 2024-2029 ($ million)
        • Data Table on North America - Market size and forecast 2024-2029 ($ million)
        • Chart on North America - Year-over-year growth 2024-2029 (%)
        • Data Table on North America - Year-over-year growth 2024-2029 (%)
      • 12.4 Europe - Market size and forecast 2024-2029
        • Chart on Europe - Market size and forecast 2024-2029 ($ million)
        • Data Table on Europe - Market size and forecast 2024-2029 ($ million)
        • Chart on Europe - Year-over-year growth 2024-2029 (%)
        • Data Table on Europe - Year-over-year growth 2024-2029 (%)
      • 12.5 APAC - Market size and forecast 2024-2029
        • Chart on APAC - Market size and forecast 2024-2029 ($ million)
        • Data Table on APAC - Market size and forecast 2024-2029 ($ million)
        • Chart on APAC - Year-over-year growth 2024-2029 (%)
        • Data Table on APAC - Year-over-year growth 2024-2029 (%)
      • 12.6 South America - Market size and forecast 2024-2029
        • Chart on South America - Market size and forecast 2024-2029 ($ million)
        • Data Table on South America - Market size and forecast 2024-2029 ($ million)
        • Chart on South America - Year-over-year growth 2024-2029 (%)
        • Data Table on South America - Year-over-year growth 2024-2029 (%)
      • 12.7 Middle East and Africa - Market size and forecast 2024-2029
        • Chart on Middle East and Africa - Market size and forecast 2024-2029 ($ million)
        • Data Table on Middle East and Africa - Market size and forecast 2024-2029 ($ million)
        • Chart on Middle East and Africa - Year-over-year growth 2024-2029 (%)
        • Data Table on Middle East and Africa - Year-over-year growth 2024-2029 (%)
      • 12.8 US - Market size and forecast 2024-2029
        • Chart on US - Market size and forecast 2024-2029 ($ million)
        • Data Table on US - Market size and forecast 2024-2029 ($ million)
        • Chart on US - Year-over-year growth 2024-2029 (%)
        • Data Table on US - Year-over-year growth 2024-2029 (%)
      • 12.9 Germany - Market size and forecast 2024-2029
        • Chart on Germany - Market size and forecast 2024-2029 ($ million)
        • Data Table on Germany - Market size and forecast 2024-2029 ($ million)
        • Chart on Germany - Year-over-year growth 2024-2029 (%)
        • Data Table on Germany - Year-over-year growth 2024-2029 (%)
      • 12.10 China - Market size and forecast 2024-2029
        • Chart on China - Market size and forecast 2024-2029 ($ million)
        • Data Table on China - Market size and forecast 2024-2029 ($ million)
        • Chart on China - Year-over-year growth 2024-2029 (%)
        • Data Table on China - Year-over-year growth 2024-2029 (%)
      • 12.11 France - Market size and forecast 2024-2029
        • Chart on France - Market size and forecast 2024-2029 ($ million)
        • Data Table on France - Market size and forecast 2024-2029 ($ million)
        • Chart on France - Year-over-year growth 2024-2029 (%)
        • Data Table on France - Year-over-year growth 2024-2029 (%)
      • 12.12 Japan - Market size and forecast 2024-2029
        • Chart on Japan - Market size and forecast 2024-2029 ($ million)
        • Data Table on Japan - Market size and forecast 2024-2029 ($ million)
        • Chart on Japan - Year-over-year growth 2024-2029 (%)
        • Data Table on Japan - Year-over-year growth 2024-2029 (%)
      • 12.13 Canada - Market size and forecast 2024-2029
        • Chart on Canada - Market size and forecast 2024-2029 ($ million)
        • Data Table on Canada - Market size and forecast 2024-2029 ($ million)
        • Chart on Canada - Year-over-year growth 2024-2029 (%)
        • Data Table on Canada - Year-over-year growth 2024-2029 (%)
      • 12.14 Brazil - Market size and forecast 2024-2029
        • Chart on Brazil - Market size and forecast 2024-2029 ($ million)
        • Data Table on Brazil - Market size and forecast 2024-2029 ($ million)
        • Chart on Brazil - Year-over-year growth 2024-2029 (%)
        • Data Table on Brazil - Year-over-year growth 2024-2029 (%)
      • 12.15 UK - Market size and forecast 2024-2029
        • Chart on UK - Market size and forecast 2024-2029 ($ million)
        • Data Table on UK - Market size and forecast 2024-2029 ($ million)
        • Chart on UK - Year-over-year growth 2024-2029 (%)
        • Data Table on UK - Year-over-year growth 2024-2029 (%)
      • 12.16 Italy - Market size and forecast 2024-2029
        • Chart on Italy - Market size and forecast 2024-2029 ($ million)
        • Data Table on Italy - Market size and forecast 2024-2029 ($ million)
        • Chart on Italy - Year-over-year growth 2024-2029 (%)
        • Data Table on Italy - Year-over-year growth 2024-2029 (%)
      • 12.17 India - Market size and forecast 2024-2029
        • Chart on India - Market size and forecast 2024-2029 ($ million)
        • Data Table on India - Market size and forecast 2024-2029 ($ million)
        • Chart on India - Year-over-year growth 2024-2029 (%)
        • Data Table on India - Year-over-year growth 2024-2029 (%)
      • 12.18 Market opportunity by geography
        • Market opportunity by geography ($ million)
        • Data Tables on Market opportunity by geography ($ million)

      13 Drivers, Challenges, and Opportunity/Restraints

      • 13.1 Market drivers
        • 13.2 Market challenges
          • 13.3 Impact of drivers and challenges
            • Impact of drivers and challenges in 2024 and 2029
          • 13.4 Market opportunities/restraints

            14 Competitive Landscape

            • 14.1 Overview
              • 14.2 Competitive Landscape
                • Overview on criticality of inputs and factors of differentiation
              • 14.3 Landscape disruption
                • Overview on factors of disruption
              • 14.4 Industry risks
                • Impact of key risks on business

              15 Competitive Analysis

              • 15.1 Companies profiled
                • Companies covered
              • 15.2 Company ranking index
                • Company ranking index
              • 15.3 Market positioning of companies
                • Matrix on companies position and classification
              • 15.4 ActiGraph LLC
                • ActiGraph LLC - Overview
                • ActiGraph LLC - Product / Service
                • ActiGraph LLC - Key offerings
                • SWOT
              • 15.5 Cadwell Industries Inc.
                • Cadwell Industries Inc. - Overview
                • Cadwell Industries Inc. - Product / Service
                • Cadwell Industries Inc. - Key offerings
                • SWOT
              • 15.6 Compumedics Ltd.
                • Compumedics Ltd. - Overview
                • Compumedics Ltd. - Product / Service
                • Compumedics Ltd. - Key offerings
                • SWOT
              • 15.7 F. Hoffmann La Roche Ltd.
                • F. Hoffmann La Roche Ltd. - Overview
                • F. Hoffmann La Roche Ltd. - Business segments
                • F. Hoffmann La Roche Ltd. - Key news
                • F. Hoffmann La Roche Ltd. - Key offerings
                • F. Hoffmann La Roche Ltd. - Segment focus
                • SWOT
              • 15.8 GlaxoSmithKline Plc
                • GlaxoSmithKline Plc - Overview
                • GlaxoSmithKline Plc - Business segments
                • GlaxoSmithKline Plc - Key news
                • GlaxoSmithKline Plc - Key offerings
                • GlaxoSmithKline Plc - Segment focus
                • SWOT
              • 15.9 Koninklijke Philips NV
                • Koninklijke Philips NV - Overview
                • Koninklijke Philips NV - Business segments
                • Koninklijke Philips NV - Key news
                • Koninklijke Philips NV - Key offerings
                • Koninklijke Philips NV - Segment focus
                • SWOT
              • 15.10 Medical Depot Inc.
                • Medical Depot Inc. - Overview
                • Medical Depot Inc. - Product / Service
                • Medical Depot Inc. - Key offerings
                • SWOT
              • 15.11 Merck and Co. Inc.
                • Merck and Co. Inc. - Overview
                • Merck and Co. Inc. - Business segments
                • Merck and Co. Inc. - Key news
                • Merck and Co. Inc. - Key offerings
                • Merck and Co. Inc. - Segment focus
                • SWOT
              • 15.12 Natus Medical Inc.
                • Natus Medical Inc. - Overview
                • Natus Medical Inc. - Product / Service
                • Natus Medical Inc. - Key offerings
                • SWOT
              • 15.13 Pfizer Inc.
                • Pfizer Inc. - Overview
                • Pfizer Inc. - Product / Service
                • Pfizer Inc. - Key news
                • Pfizer Inc. - Key offerings
                • SWOT
              • 15.14 Sanofi SA
                • Sanofi SA - Overview
                • Sanofi SA - Business segments
                • Sanofi SA - Key news
                • Sanofi SA - Key offerings
                • Sanofi SA - Segment focus
                • SWOT
              • 15.15 Serta Inc.
                • Serta Inc. - Overview
                • Serta Inc. - Product / Service
                • Serta Inc. - Key offerings
                • SWOT
              • 15.16 SleepMed Inc.
                • SleepMed Inc. - Overview
                • SleepMed Inc. - Product / Service
                • SleepMed Inc. - Key offerings
                • SWOT
              • 15.17 Takeda Pharmaceutical Co. Ltd.
                • Takeda Pharmaceutical Co. Ltd. - Overview
                • Takeda Pharmaceutical Co. Ltd. - Product / Service
                • Takeda Pharmaceutical Co. Ltd. - Key news
                • Takeda Pharmaceutical Co. Ltd. - Key offerings
                • SWOT
              • 15.18 Talley Group Ltd.
                • Talley Group Ltd. - Overview
                • Talley Group Ltd. - Product / Service
                • Talley Group Ltd. - Key offerings
                • SWOT

              16 Appendix

              • 16.1 Scope of the report
                • 16.2 Inclusions and exclusions checklist
                  • Inclusions checklist
                  • Exclusions checklist
                • 16.3 Currency conversion rates for US$
                  • Currency conversion rates for US$
                • 16.4 Research methodology
                  • Research methodology
                • 16.5 Data procurement
                  • Information sources
                • 16.6 Data validation
                  • Data validation
                • 16.7 Validation techniques employed for market sizing
                  • Validation techniques employed for market sizing
                • 16.8 Data synthesis
                  • Data synthesis
                • 16.9 360 degree market analysis
                  • 360 degree market analysis
                • 16.10 List of abbreviations
                  • List of abbreviations

                Research Methodology

                Technavio presents a detailed picture of the market by way of study, synthesis, and summation of data from multiple sources. The analysts have presented the various facets of the market with a particular focus on identifying the key industry influencers. The data thus presented is comprehensive, reliable, and the result of extensive research, both primary and secondary.

                INFORMATION SOURCES

                Primary sources

                • Manufacturers and suppliers
                • Channel partners
                • Industry experts
                • Strategic decision makers

                Secondary sources

                • Industry journals and periodicals
                • Government data
                • Financial reports of key industry players
                • Historical data
                • Press releases

                DATA ANALYSIS

                Data Synthesis

                • Collation of data
                • Estimation of key figures
                • Analysis of derived insights

                Data Validation

                • Triangulation with data models
                • Reference against proprietary databases
                • Corroboration with industry experts

                REPORT WRITING

                Qualitative

                • Market drivers
                • Market challenges
                • Market trends
                • Five forces analysis

                Quantitative

                • Market size and forecast
                • Market segmentation
                • Geographical insights
                • Competitive landscape

                Interested in this report?

                Get your sample now to see our research methodology and insights!

                Download Now

                Frequently Asked Questions

                Sleeping Aids market growth will increase by $ 47032.8 mn during 2025-2029 .

                The Sleeping Aids market is expected to grow at a CAGR of 7.6% during 2025-2029 .

                Sleeping Aids market is segmented by Type( Insomnia, Sleep apnea, Primary restless legs syndrome, Others) Product( Mattress and pillows, Sleep apnea devices, Others, ROW) Distribution Channel( Retail pharmacies, E-commerce, Hospital pharmacies, Drug stores, Middle East and Africa)

                ActiGraph LLC, AstraZeneca Plc, Becton Dickinson and Co., Cadwell Industries Inc., Compumedics Ltd., CSL Ltd., F. Hoffmann La Roche Ltd., GlaxoSmithKline Plc, Koninklijke Philips NV, Medical Depot Inc., Merck and Co. Inc., Natus Medical Inc., Pfizer Inc., Sanofi SA, Serta Inc., SleepMed Inc., Takeda Pharmaceutical Co. Ltd., Talley Group Ltd. are a few of the key vendors in the Sleeping Aids market.

                North America will register the highest growth rate of 40% among the other regions. Therefore, the Sleeping Aids market in North America is expected to garner significant business opportunities for the vendors during the forecast period.

                US, Germany, China, France, Japan, Canada, Brazil, UK, Italy, India

                • Increasing technological innovations in CPAP devicesTechnological innovations have resulted in the development of improved CPAP devices as per the end-user requirements. Companies are focusing on research and development activities to design and develop innovative CPAP devices and accessories. Technological advances have led to the development of lightweight interface masks with soft sealing flanges and fewer accessories that are easy to use and more adaptable to different face geometries. These masks will improve the usability of CPAP devices. The integration of IT data systems with CPAP and associated monitoring devices helps in improving therapy for sleep-disordered breathing by reducing cost and time. For instance is the driving factor this market.
                • the last two series of full-face masks by Hans Rudolph have all the features to address the latest market demands globally. Also is the driving factor this market.
                • the latest CPAP devices by ResMed include integrated humidification with wireless connectivity so that medical equipment providers for home care and other healthcare providers receive regular reports on patient progress. CPAP devices backed by IT data will allow improved patient care and increase the compliance rate of OSA therapy. These offer a range of opportunities for healthcare providers to stay virtually connected to patients and train them more efficiently. Amara View is the latest mask by Koninklijke Philips that covers less area of a patient face than any other full-face mask. The innovative design of Amara View helps minimize red facial marks and prevents discomfort on the nose. Patients can also watch TV while wearing Amara View masks and can wear glasses. These innovations can aid in generating interest among consumers is the driving factor this market.
                • resulting in high sales. The added benefits of these products offer significant value addition to a consumer life and bring about a change in attitude. The rise of innovative products will lead to increased sales is the driving factor this market.
                • resulting in the growth of the global sleeping aids market. Thus is the driving factor this market.
                • such factors are expected to drive the growth of the global sleeping aids market during the forecast period. is the driving factor this market.

                The Sleeping Aids market vendors should focus on grabbing business opportunities from the Insomnia segment as it accounted for the largest market share in the base year.