
Slot Machine Market Size 2026-2030
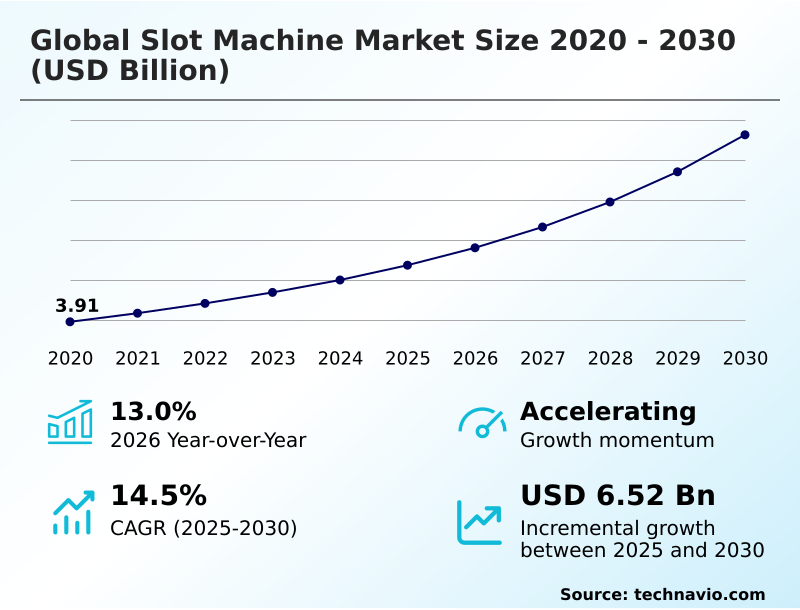
The Slot Machine Market size was valued at USD 6.74 billion in 2025, growing at a CAGR of 14.5% during the forecast period 2026-2030.
Major Market Trends & Insights
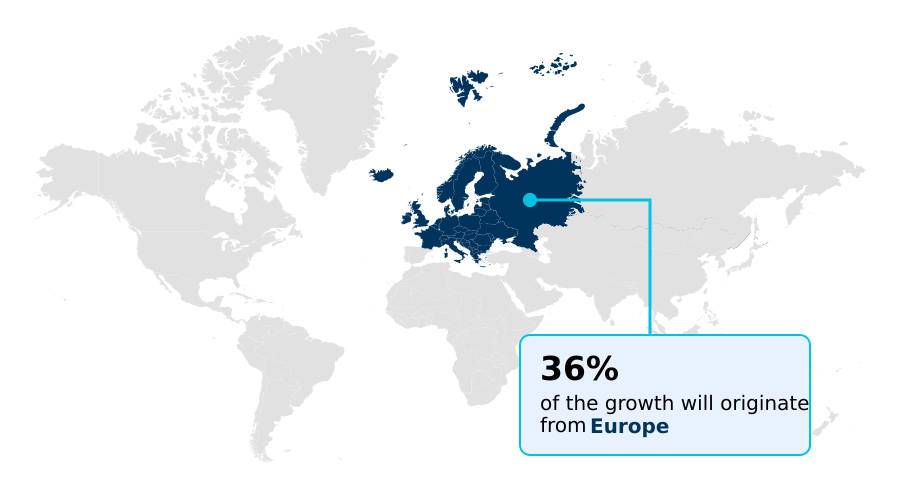
- Europe dominated the market and accounted for a 36.2% growth during the forecast period.
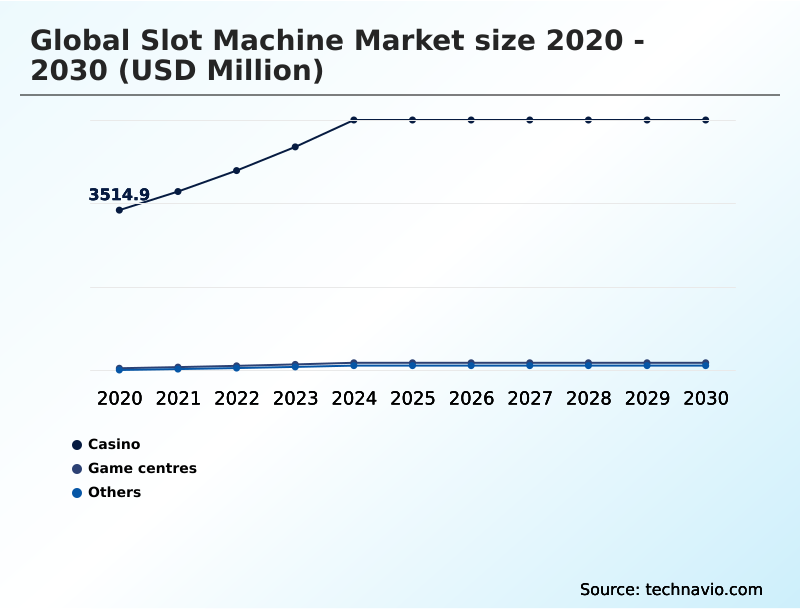
- By Application - Casino segment was valued at USD 5.40 billion in 2024
- By Product - Digital segment accounted for the largest market revenue share in 2024
Market Size & Forecast
- Historic Market Opportunities 2020-2024: USD 9.34 billion
- Market Future Opportunities 2025-2030: USD 6.52 billion
- CAGR from 2025 to 2030 : 14.5%
Market Summary
- The slot machine market is defined by a rapid replacement cycle and technological evolution, with digital machines constituting over 90% of new sales. In a typical business scenario, a casino operator replaces 15-20% of its gaming floor annually to maintain player engagement, prioritizing machines that demonstrate a 10% higher-than-average time-on-device metric.
- The primary driver is the strategic expansion into emerging jurisdictions, which opens new revenue streams for manufacturers. However, this growth is constrained by the significant challenge of navigating fragmented and shifting regional regulations, which can increase compliance costs by up to 25% per new market entry. This dynamic forces a balance between innovation and regulatory adherence.
- The integration of advanced hardware and software continues to reshape player experiences and operational models.
What will be the Size of the Slot Machine Market during the forecast period?
Get Key Insights on Market Forecast (PDF) Request Free Sample
How is the Slot Machine Market Segmented?
The slot machine industry research report provides comprehensive data (region-wise segment analysis), with forecasts and analysis for the period 2026-2030, as well as historical data from 2020-2024 for the following segments.
- Application
- Casino
- Game centres
- Others
- Product
- Digital
- Mechanical
- Type
- Video slot machines
- Reel slot machines
- Multi-denomination slot machines
- Progressive slot machines
- Geography
- Europe
- Italy
- Germany
- UK
- North America
- US
- Canada
- Mexico
- APAC
- China
- Australia
- Japan
- South America
- Brazil
- Argentina
- Middle East and Africa
- South Africa
- UAE
- Turkey
- Rest of World (ROW)
- Europe
How is the Slot Machine Market Segmented by Application?
The casino segment is estimated to witness significant growth during the forecast period.
The casino segment dominates the slot machine market, accounting for over 85% of total revenue due to the high volume of machines required for large gaming floors.
Operators in this segment prioritize high-performance cabinet hardware and sophisticated game mathematics to maximize revenue per unit, a metric that is 30% higher than in other segments.
The replacement cycle in casinos is also faster, with operators refreshing 15-20% of their floor annually to maintain player interest with new slot game content.
This demand is driven by the need for continuous innovation in remote game server technology and player tracking systems, which are essential for managing loyalty programs and optimizing floor layouts for operational efficiency gains.
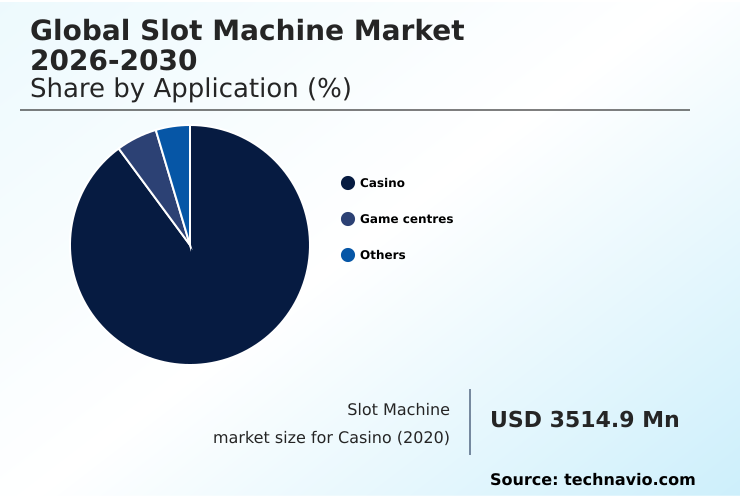
The Casino segment was valued at USD 5.40 billion in 2024 and showed a gradual increase during the forecast period.
How demand for the Slot Machine market is rising in the leading region?
Europe is estimated to contribute 36.2% to the growth of the global market during the forecast period.Technavio’s analysts have elaborately explained the regional trends and drivers that shape the market during the forecast period.
See How Slot Machine Market demand is rising in Europe Request Free Sample
The global slot machine market demonstrates significant geographic variance, with North America representing a 30.38% opportunity share compared to Europe's 36.15%.
North America's maturity is driven by the United States, which constitutes over 75% of the regional market, focusing on premium gaming assets and licensed content integration.
In contrast, APAC, which holds a 22.55% share, shows rapid growth fueled by integrated resort development demanding high volatility games.
Operator strategies differ accordingly; North American casinos prioritize data-driven floor space optimization to increase revenue per square foot by 10-15%, while APAC operators focus on deploying wide area networks for linked progressive systems to attract international tourism.
This regional divergence requires manufacturers to adapt their game volatility features and content.
What are the key Drivers, Trends, and Challenges in the Slot Machine Market?
Our researchers analyzed the data with 2025 as the base year, along with the key drivers, trends, and challenges. A holistic analysis of drivers will help companies refine their marketing strategies to gain a competitive advantage.
- Strategic decision-making in the global slot machine market hinges on understanding the nuances of different product and technology segments. The evolution of slot machine hardware and cabinet aesthetics is a critical factor, as enhanced designs can improve player engagement by up to 20%.
- Simultaneously, the market is experiencing a significant push toward omnichannel gaming experience platform convergence, which integrates land-based and digital play to capture a wider audience. This is closely tied to the adoption of cashless and contactless payment technology, a trend that streamlines operations and provides valuable player data.
- However, this increased connectivity brings challenges, highlighting the importance of addressing cybersecurity threats in networked slot machines. Furthermore, the introduction of skill based gaming mechanics in slot machines is a key innovation aimed at attracting younger demographics accustomed to interactive entertainment.
- All these developments are governed by the strict need for regulatory compliance for electronic gaming machines, which remains a primary consideration for manufacturers and operators alike, influencing design, deployment, and profitability across all jurisdictions.
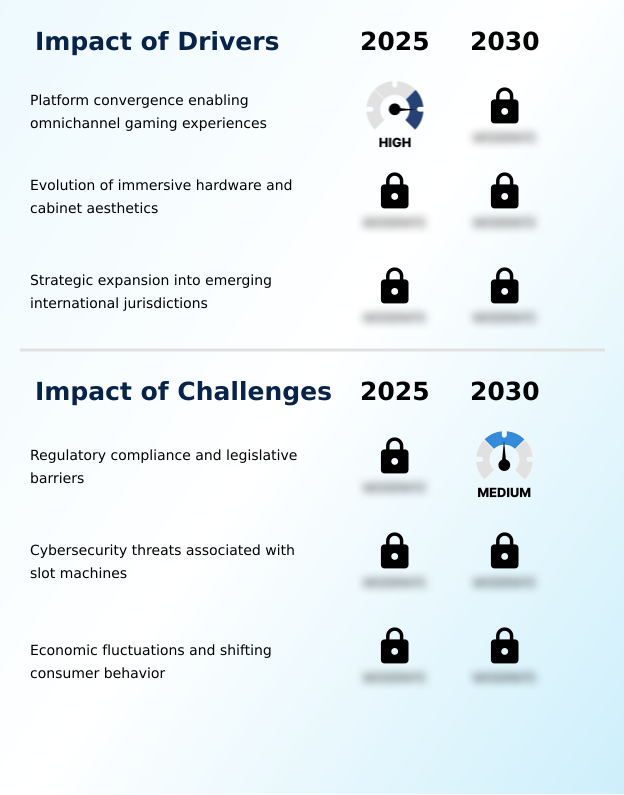
What are the key market drivers leading to the rise in the adoption of Slot Machine Industry?
- Platform convergence, which enables seamless omnichannel gaming experiences across both physical and digital channels, serves as a key driver for market growth.
- Platform convergence is a primary driver, fostering omnichannel gaming experiences that extend player engagement beyond the casino floor.
- By creating a unified ecosystem through server based gaming and robust player loyalty platforms, operators can achieve a 20% higher customer lifetime value.
- This omnichannel engagement is supported by cross platform deployment of successful slot game content, where a popular digital title can be rolled out to physical cabinet hardware with minimal redevelopment.
- The strategy strengthens intellectual property portfolios and allows for regional content localization with greater efficiency. Such integration, supported by sophisticated backend system sophistication, reduces content development cycles by an estimated 30%, allowing operators to refresh their gaming floors more rapidly.
What are the market trends shaping the Slot Machine Industry?
- The integration of artificial intelligence and machine learning represents a significant market trend. These technologies are increasingly utilized to personalize gaming experiences and optimize operational efficiency.
- The integration of advanced analytics is reshaping player interaction, with a clear trend toward personalizing the gaming experience. Modern slot machines now incorporate AI-driven player behavior analytics to dynamically adjust game characteristics, which can increase session duration by up to 15% compared to static machines.
- This move beyond simple random number generation involves sophisticated payout structures managed by machine learning algorithms. The adoption of cashless wagering systems and digital wallet integration is also accelerating, simplifying transactions and enhancing the user interface design.
- This technological shift is complemented by advancements in immersive hardware, such as haptic feedback, creating a more engaging sensory experience that boosts player retention by a measurable 5%.
What challenges does the Slot Machine Industry face during its growth?
- Adherence to stringent regulatory compliance standards and overcoming legislative barriers remains a key challenge that significantly affects industry growth and operational strategy.
- Navigating complex and fragmented regulatory frameworks presents the most significant challenge to market participants, increasing compliance costs by up to 25%. Companies must manage diverse responsible gaming measures and adhere to stringent rules for video lottery terminals and other gaming devices. This requires sophisticated regulatory compliance management systems integrated directly into casino management platforms.
- The rise of networked computing systems also introduces significant cybersecurity infrastructure challenges, as a single breach can compromise thousands of machines and lead to severe penalties. For instance, implementing a new centralized monitoring system across a network can require an initial investment equivalent to 5% of the hardware's value.
- The need for constant asset performance monitoring to ensure compliance adds further operational overhead.
Exclusive Technavio Analysis on Customer Landscape
The slot machine market forecasting report includes the adoption lifecycle of the market, covering from the innovator’s stage to the laggard’s stage. It focuses on adoption rates in different regions based on penetration. Furthermore, the slot machine market report also includes key purchase criteria and drivers of price sensitivity to help companies evaluate and develop their market growth analysis strategies.
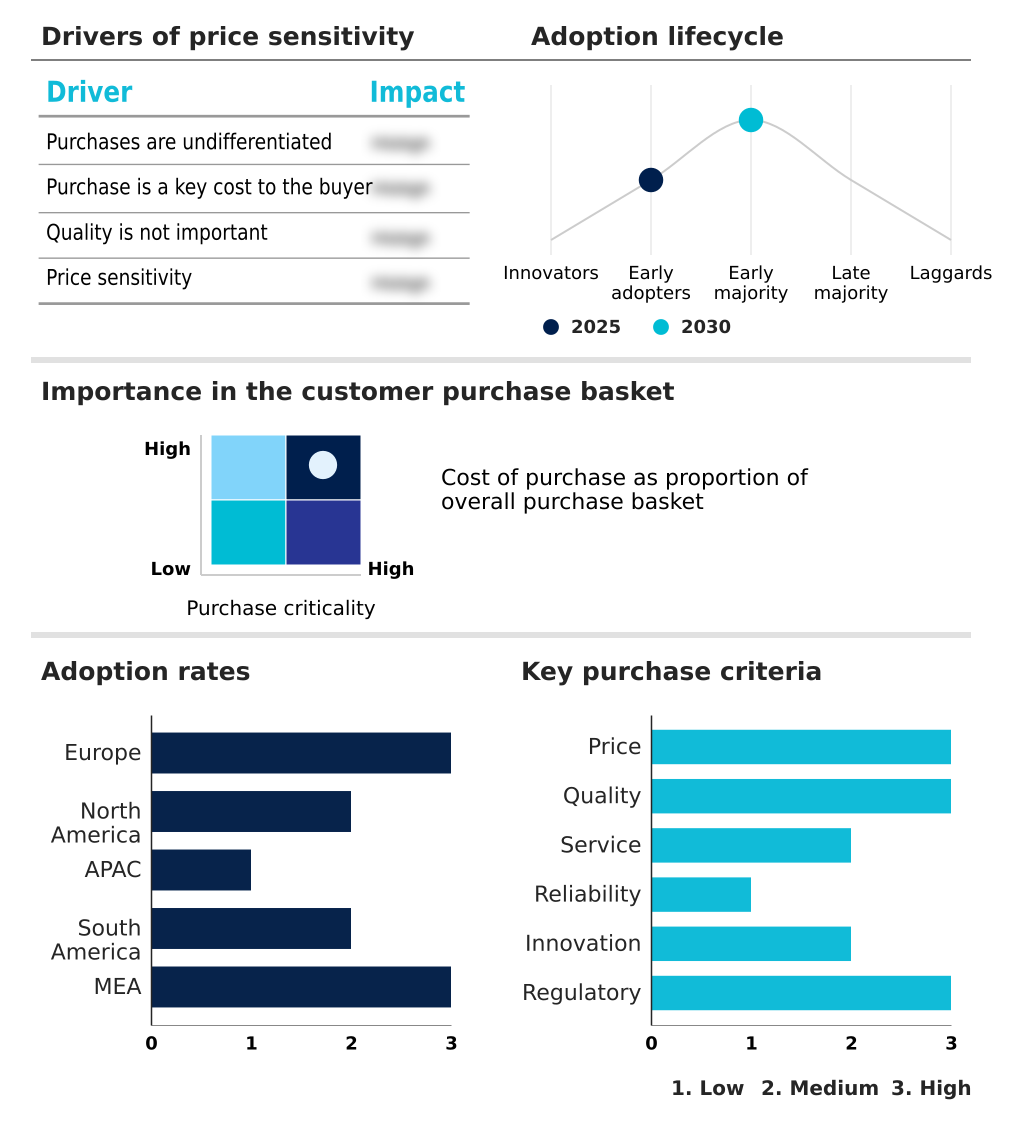
Customer Landscape of Slot Machine Industry
Competitive Landscape
Companies are implementing various strategies, such as strategic alliances, slot machine market forecast, partnerships, mergers and acquisitions, geographical expansion, and product/service launches, to enhance their presence in the industry.
Accel Entertainment Inc. - Key offerings include electronic gaming machines, premium cabinet hardware, extensive game libraries, and integrated casino systems technology designed to support modern slot operations and enhance player engagement.
The industry research and growth report includes detailed analyses of the competitive landscape of the market and information about key companies, including:
- Accel Entertainment Inc.
- AMATIC Industries GmbH
- APEX pro gaming s.r.o
- APOLLO SOFT s.r.o.
- Aries Technology LLC
- Aristocrat Leisure Ltd.
- Aruze Gaming Global
- Ballys Corp.
- Eclipse Gaming Systems
- Everi Holdings Inc.
- Incredible Technologies Inc.
- Inspired Entertainment Inc.
- Interblock Gaming
- International Game Technology
- JPM Interactive Ltd.
- Konami Group Corp.
- NOVOMATIC AG
- PlayAGS Inc.
- Recreativos Franco S.A
- Scientific Games LLC
Qualitative and quantitative analysis of companies has been conducted to help clients understand the wider business environment as well as the strengths and weaknesses of key industry players. Data is qualitatively analyzed to categorize companies as pure play, category-focused, industry-focused, and diversified; it is quantitatively analyzed to categorize companies as dominant, leading, strong, tentative, and weak.
Market Intelligence Radar: High-Impact Developments & Growth Signals
- In the Casinos and Gaming industry, the widespread adoption of digital payment systems and mobile wallets in consumer finance has accelerated the push for cashless wagering systems on casino floors, impacting slot machine design to include digital wallet integration.
- Technological advancements in consumer electronics, particularly the standardization of high-definition curved displays and immersive audio, have set new player expectations, compelling slot machine manufacturers to invest in advanced, immersive hardware to remain competitive.
- A global regulatory shift toward stricter data privacy and consumer protection, exemplified by frameworks like GDPR, is forcing the Casinos and Gaming industry to invest heavily in cybersecurity infrastructure and centralized monitoring systems for slot machines to ensure regulatory compliance management.
- The expansion of integrated resorts in emerging tourism markets is creating large-scale, concentrated demand for premium gaming assets, shifting manufacturer focus toward high-volatility games and regional content localization to cater to an international clientele.
Dive into Technavio’s robust research methodology, blending expert interviews, extensive data synthesis, and validated models for unparalleled Slot Machine Market insights. See full methodology.
| Market Scope | |
|---|---|
| Page number | 292 |
| Base year | 2025 |
| Historic period | 2020-2024 |
| Forecast period | 2026-2030 |
| Growth momentum & CAGR | Accelerate at a CAGR of 14.5% |
| Market growth 2026-2030 | USD 6515.9 million |
| Market structure | Fragmented |
| YoY growth 2025-2026(%) | 13.0% |
| Key countries | Italy, Germany, UK, Spain, France, The Netherlands, US, Canada, Mexico, China, Australia, Japan, South Korea, Singapore, India, Brazil, Argentina, Chile, South Africa, UAE, Egypt, Turkey and Saudi Arabia |
| Competitive landscape | Leading Companies, Market Positioning of Companies, Competitive Strategies, and Industry Risks |
Research Analyst Overview
- The slot machine market ecosystem operates through a complex value chain where technology suppliers provide critical components like processors and high-definition displays, which represent over 40% of a machine's bill of materials. Manufacturers such as IGT and Aristocrat integrate these parts with proprietary software and cabinet hardware, developing extensive slot game content.
- Regulatory bodies then impose rigorous testing, a process that can add 6-9 months to product-to-market timelines. Distribution occurs through direct sales to large casino groups and regional distributors for smaller venues. End-users, the players, are influenced by game mathematics and immersive hardware.
- The system is supported by financial technology firms enabling cashless wagering systems and loyalty platform providers that facilitate omnichannel engagement.
What are the Key Data Covered in this Slot Machine Market Research and Growth Report?
-
What is the expected growth of the Slot Machine Market between 2026 and 2030?
-
The Slot Machine Market is expected to grow by USD 6.52 billion during 2026-2030, registering a CAGR of 14.5%. Year-over-year growth in 2026 is estimated at 13.0%%. This acceleration is shaped by platform convergence enabling omnichannel gaming experiences, which is intensifying demand across multiple end-use verticals covered in the report.
-
-
What segmentation does the market report cover?
-
The report is segmented by Application (Casino, Game centres, and Others), Product (Digital, and Mechanical), Type (Video slot machines, Reel slot machines, Multi-denomination slot machines, and Progressive slot machines) and Geography (Europe, North America, APAC, South America, Middle East and Africa). Among these, the Casino segment is estimated to witness significant growth during the forecast period, driven by rising adoption across key application areas. Each segment includes detailed qualitative and quantitative analysis, along with historical data from 2020-2024 and forecasts through 2030 with year-over-year growth rates.
-
-
Which regions are analyzed in the report?
-
The report covers Europe, North America, APAC, South America and Middle East and Africa. Europe is estimated to contribute 36.2% to market growth during the forecast period. Country-level analysis includes Italy, Germany, UK, Spain, France, The Netherlands, US, Canada, Mexico, China, Australia, Japan, South Korea, Singapore, India, Brazil, Argentina, Chile, South Africa, UAE, Egypt, Turkey and Saudi Arabia, with dedicated market size tables and year-over-year growth for each.
-
-
What are the key growth drivers and market challenges?
-
The primary driver is platform convergence enabling omnichannel gaming experiences, which is accelerating investment and industry demand. The main challenge is regulatory compliance and legislative barriers, creating operational barriers for key market participants. The report quantifies the impact of each driver and challenge across 2026 and 2030 with comparative analysis.
-
-
Who are the major players in the Slot Machine Market?
-
Key vendors include Accel Entertainment Inc., AMATIC Industries GmbH, APEX pro gaming s.r.o, APOLLO SOFT s.r.o., Aries Technology LLC, Aristocrat Leisure Ltd., Aruze Gaming Global, Ballys Corp., Eclipse Gaming Systems, Everi Holdings Inc., Incredible Technologies Inc., Inspired Entertainment Inc., Interblock Gaming, International Game Technology, JPM Interactive Ltd., Konami Group Corp., NOVOMATIC AG, PlayAGS Inc., Recreativos Franco S.A and Scientific Games LLC. The report provides qualitative and quantitative analysis categorizing companies as dominant, leading, strong, tentative, and weak based on their market positioning. Company profiles include business segment analysis, SWOT assessment, key offerings, and recent strategic developments.
-
Market Research Insights
- The competitive landscape for slot machines is moderately concentrated, with the top five companies accounting for over 70% of the market share. Key players like Aristocrat and International Game Technology are driving consolidation, focusing on integrating digital capabilities with land-based operations to create a unified player experience.
- For instance, recent strategic acquisitions aim to combine online gaming portfolios with hardware manufacturing, expanding the end-to-end content portfolio. This responds to operator demand for solutions that improve floor space optimization by at least 15%. These developments are directly tied to the industry shift toward omnichannel engagement.
- A persistent challenge remains the management of cybersecurity threats in increasingly networked computing systems, compelling manufacturers to invest heavily in cybersecurity infrastructure to protect both player data and operational integrity.
We can help! Our analysts can customize this slot machine market research report to meet your requirements.
 RIA -
RIA - 
