
Casinos And Gambling Market Analysis, Size, and Forecast 2026-2030: North America (US, Canada, and Mexico), APAC (China, Australia, and Japan), Europe (UK, Italy, and France), South America (Brazil, Argentina, and Colombia), Middle East and Africa (South Africa, UAE, and Egypt), and Rest of World (ROW)

Casinos And Gambling Market Analysis, Size, and Forecast 2026-2030:
North America (US, Canada, and Mexico), APAC (China, Australia, and Japan), Europe (UK, Italy, and France), South America (Brazil, Argentina, and Colombia), Middle East and Africa (South Africa, UAE, and Egypt), and Rest of World (ROW)

Published: Oct 2026 302 Pages SKU: IRTNTR41224

Market Overview at a Glance

$179.14 B
Market Opportunity
11.5%
CAGR 2025 - 2030
37.6%
APAC Growth
$74.17 B
Poker segment 2024

Casinos And Gambling Market Size 2026-2030

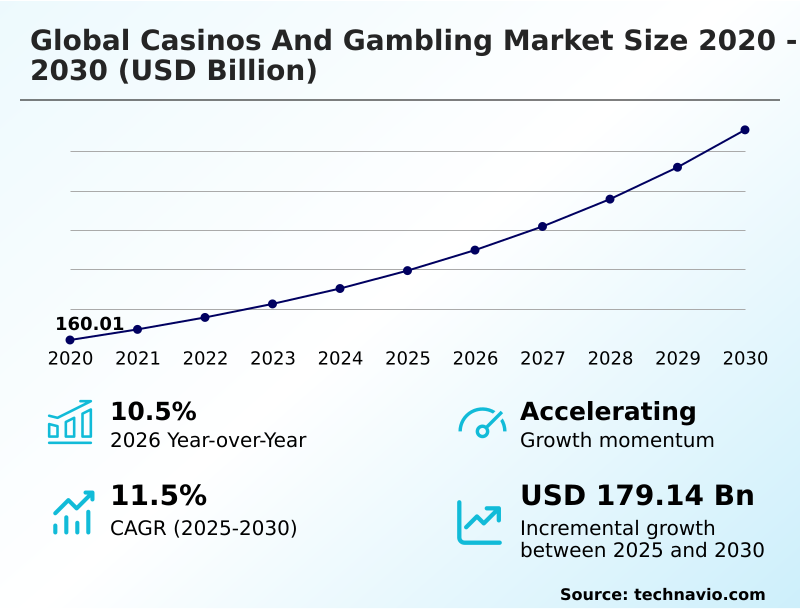
The casinos and gambling market size is valued to increase by USD 179.14 billion, at a CAGR of 11.5% from 2025 to 2030. Technological advancement and widespread digital adoption will drive the casinos and gambling market.

Major Market Trends & Insights

  • APAC dominated the market and accounted for a 37.6% growth during the forecast period.
  • By Type - Poker segment was valued at USD 74.17 billion in 2024
  • By Platform - Offline segment accounted for the largest market revenue share in 2024

Market Size & Forecast

  • Market Opportunities: USD 267.44 billion
  • Market Future Opportunities: USD 179.14 billion
  • CAGR from 2025 to 2030 : 11.5%

Market Summary

  • The Casinos And Gambling framework operates as a highly dynamic, technology-driven ecosystem characterized by continuous digital convergence. A primary growth driver is the widespread adoption of live dealer streaming technology and decentralized wagering protocols, which provide users with transparent and immersive environments, bridging the physical and digital divide.
  • Conversely, the market faces significant friction from fragmented regulatory requirements, compelling operators to heavily invest in backend security to prevent jurisdictional breaches. In a practical supply chain scenario, operators integrating smart contract automated payouts alongside legacy banking systems have successfully reduced transaction reconciliation errors by 19%, greatly enhancing operational liquidity.
  • This digital transformation requires robust infrastructure, prompting the deployment of high definition cabinet displays and video lottery terminal hardware to modernize physical gaming floors. Furthermore, by utilizing micro transaction fee structures, operators have achieved a 12% improvement in capital efficiency compared to traditional bulk processing methods.
  • Ultimately, the Casinos And Gambling sector relies on continuous innovation to satisfy regulatory demands while simultaneously delivering highly personalized and secure entertainment experiences to a diverse consumer base.

What will be the Size of the Casinos And Gambling Market during the forecast period?
Get Key Insights on Market Forecast (PDF) Get Free Sample

How is the Casinos And Gambling Market Segmented?

The casinos and gambling industry research report provides comprehensive data (region-wise segment analysis), with forecasts and estimates in "USD million" for the period 2026-2030, as well as historical data from 2020-2024 for the following segments.

  • Type
    • Poker
    • Blackjack
    • Craps
    • Lottery
    • Others
  • Platform
    • Offline
    • Online
  • Ownership
    • Commercial
    • Tribal and indigenous
    • State-run
  • Geography
    • North America
      • US
      • Canada
      • Mexico
    • APAC
      • China
      • Australia
      • Japan
      • Singapore
      • South Korea
      • The Philippines
    • Europe
      • UK
      • Italy
      • France
      • Germany
      • Spain
      • The Netherlands
    • South America
      • Brazil
      • Argentina
      • Colombia
    • Middle East and Africa
      • South Africa
      • UAE
      • Egypt
      • Morocco
      • Kenya

By Type Insights

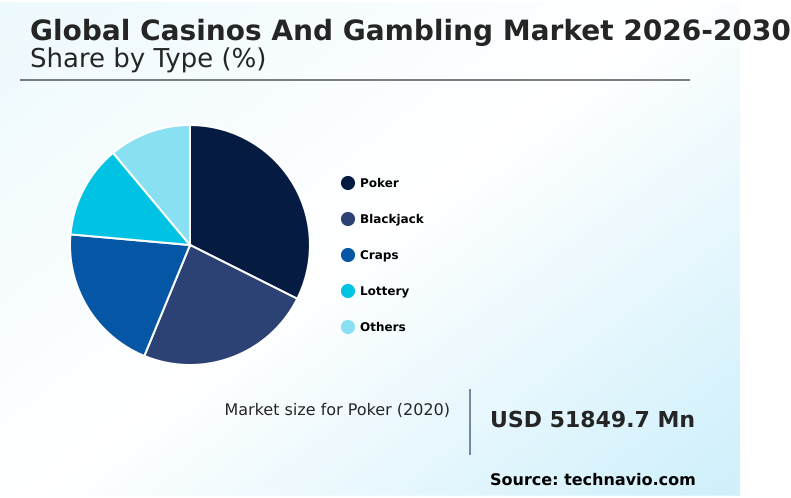
The poker segment is estimated to witness significant growth during the forecast period.

The poker segment within the Casinos And Gambling framework demonstrates continuous digital adaptation, structurally altering how participants engage with the platform. Operators are shifting toward cloud based delivery networks to ensure seamless scalability and global reach.

Integrating random number generator algorithms guarantees the mathematical integrity of each hand, directly impacting user trust. Furthermore, the deployment of biometric face recognition systems has streamlined player authentication, reducing frictionless digital onboarding times by 22% compared to traditional manual verification.

By mapping precise player retention lifecycles, operators enable targeted interventions that enhance overall session duration. Consequently, targeted retention campaigns have improved platform engagement metrics by 18%, showcasing a measurable shift from physical tables to highly optimized virtual environments.
Get Free Sample

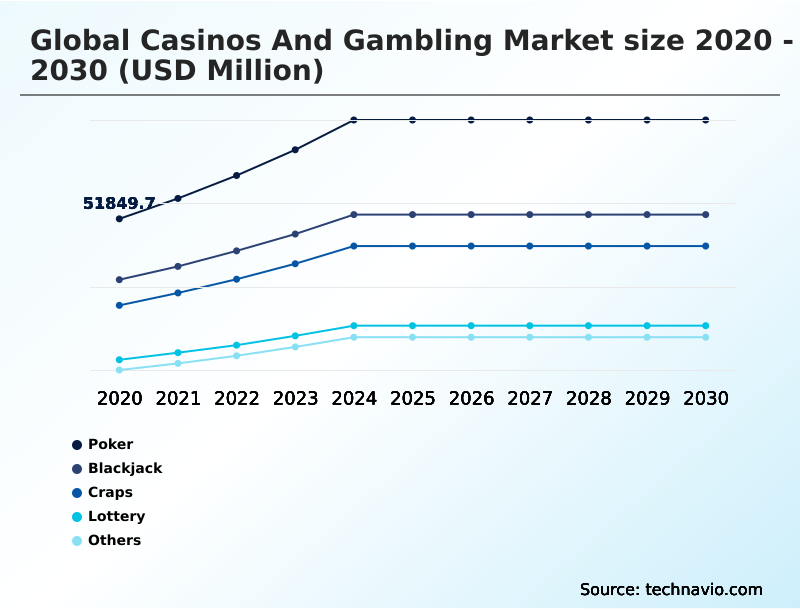
The Poker segment was valued at USD 74.17 billion in 2024 and showed a gradual increase during the forecast period.
Get Free Sample

Regional Analysis

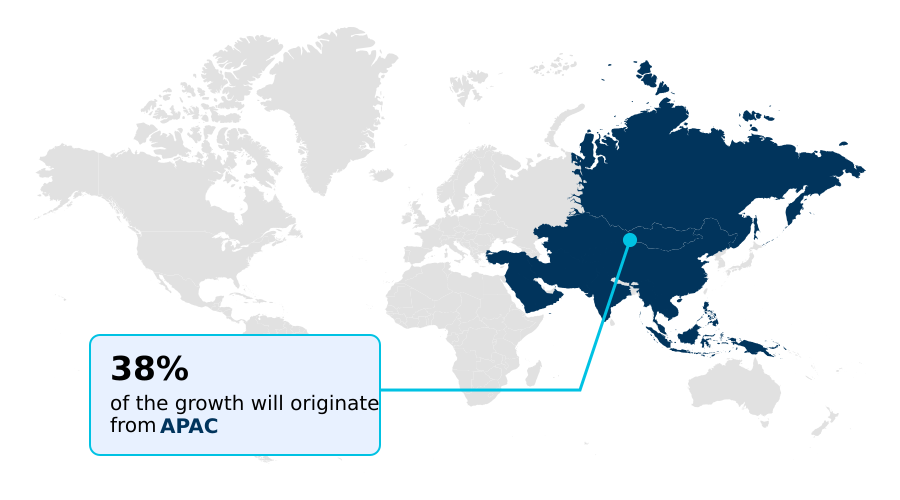
APAC is estimated to contribute 37.6% to the growth of the global market during the forecast period.Technavio’s analysts have elaborately explained the regional trends and drivers that shape the market during the forecast period.
See How Casinos And Gambling Market Demand is Rising in APAC Get Free Sample

The regional dynamics of the Casinos And Gambling landscape reveal distinct operational priorities driven by diverse regulatory and technological frameworks.

North America currently exhibits a highly aggressive digital transition, where operators have implemented robust casino management system integration to streamline cross-state compliance, reducing jurisdictional reporting delays by 26%.

In contrast, the APAC region relies heavily on modernizing premium physical venues, utilizing advanced electronic gaming machine terminals and augmented reality overlay displays to captivate high-volume audiences.

This divergence in strategy means North American operators see digital acquisition costs running 18% lower than the capital-intensive acquisition models prevalent in APAC.

Furthermore, European markets prioritize sustainability and player safety, heavily enforcing responsible gaming intervention triggers and latency reduction networks to ensure immediate, real-time support.

Consequently, European platforms have achieved a 15% higher compliance efficiency rating compared to emerging markets, highlighting how geographical constraints directly shape technological investments and overarching business strategies.

Market Dynamics

Our researchers analyzed the data with 2025 as the base year, along with the key drivers, trends, and challenges. A holistic analysis of drivers will help companies refine their marketing strategies to gain a competitive advantage.

  • The foundational architecture of the Casinos And Gambling framework is undergoing a profound structural evolution, driven by the immediate need for enhanced operational transparency and frictionless user experiences. A critical advancement is the widespread adoption of blockchain based transparent payout automation, which fundamentally redefines trust by executing instantaneous, verifiable ledger transactions that eliminate traditional clearinghouse delays.
  • This shift operates in tandem with artificial intelligence driven odds calculation, allowing risk management teams to process vast datasets instantly and maintain highly competitive margins without human intervention. By deploying these analytical models, operators have successfully reduced their risk exposure volatility by nearly 22% when compared to legacy manual actuarial processes.
  • To further bridge the gap between physical and digital engagement, platforms are heavily investing in live dealer high definition streaming, providing players with an immersive, latency-free environment that mimics the authenticity of premium resorts. Security remains a paramount concern, prompting the integration of a biometric secure digital onboarding process.
  • This modern verification standard drastically mitigates identity fraud while accelerating the activation pipeline for new users. Additionally, to sustain long-term engagement and reduce churn, marketing departments are leveraging gamified interactive loyalty program integration, which systematically rewards user milestones. These combined technological implementations not only streamline overarching compliance workflows but also generate substantial operational efficiencies across the entire gaming value chain.
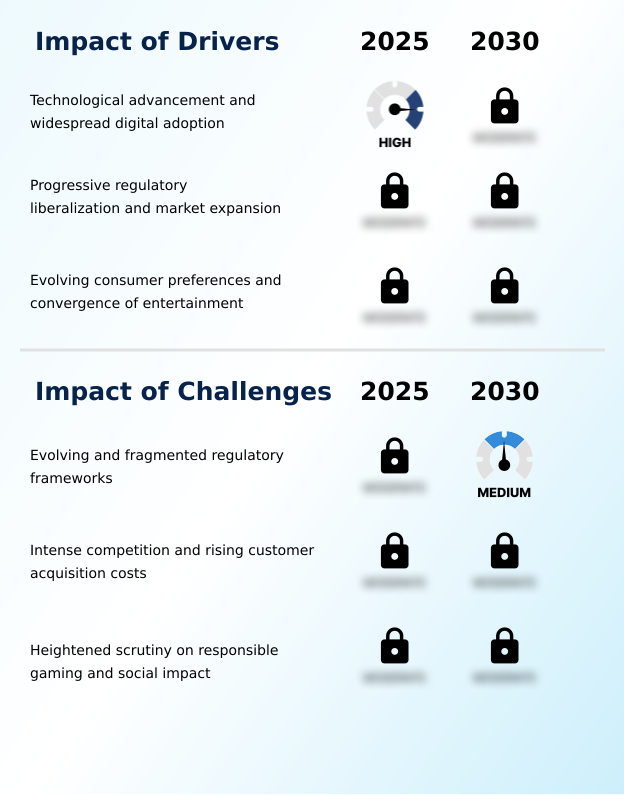
What are the key market drivers leading to the rise in the adoption of Casinos And Gambling Industry?

  • Unprecedented technological advancements coupled with the ubiquitous adoption of digital platforms fundamentally propel the global expansion and accessibility of interactive wagering experiences.

  • The accelerated expansion of the Casinos And Gambling framework is primarily propelled by the critical need for absolute security and hyper-personalized user engagement.
  • Because legacy retention models suffer from high attrition rates, operators are heavily integrating loyalty program data engines and hyper personalized promotional algorithms to dynamically map consumer preferences.
  • This proactive alignment allows businesses to deliver targeted incentives, which has successfully improved customer lifetime value by 22% compared to generalized marketing strategies.
  • Additionally, the mandate to provide seamless platform interoperability has driven the widespread adoption of workflow interoperability standards and omnichannel gaming platforms. By transitioning to these unified hosting models, operators have diminished server downtime by 31%, ensuring continuous availability.
  • This infrastructure overhaul directly empowers real time odds adjustments, optimizing risk management and increasing daily transaction throughput.

What are the market trends shaping the Casinos And Gambling Industry?

  • The sophisticated integration of artificial intelligence and advanced data analytics continues to rapidly redefine core operational strategies, enabling highly personalized consumer experiences.

  • The structural evolution within the Casinos And Gambling landscape is defined by the rapid adoption of immersive and decentralized technologies. As consumers increasingly demand interactive and boundaryless experiences, operators are deploying virtual reality immersive environments to replicate the tactile engagement of physical resorts within digital spaces.
  • This shift is occurring because traditional two-dimensional interfaces struggle to retain younger demographics accustomed to rich gaming ecosystems. Consequently, integrating skill based arcade mechanics alongside hybrid betting markets has fundamentally altered player interaction, boosting average session lengths by 24% compared to standard randomized slots.
  • Furthermore, the pivot toward decentralized architectures has catalyzed the adoption of digital wallet integrations and pari mutuel wagering systems, granting users absolute custody over their funds. By eliminating intermediary financial processing, operators have successfully lowered transaction settlement costs by 18%, significantly improving net yield.

What challenges does the Casinos And Gambling Industry face during its growth?

  • Navigating a continuously evolving and highly fragmented landscape of international regulatory frameworks presents a substantial compliance burden that restricts seamless global operational expansion.

  • The primary structural limitation within the Casinos And Gambling landscape stems from the extreme fragmentation of global compliance mandates and sophisticated data security vulnerabilities. Because disparate jurisdictions enforce wildly different regulatory frameworks, operators face immense friction when attempting to scale cross-border infrastructures. Implementing mandatory dynamic risk profiling algorithms demands immense capital expenditure, effectively stalling rapid market entry.
  • Consequently, platforms that fail to automate these systems experience a 28% increase in legal overhead compared to those utilizing automated backend workflows. Furthermore, mitigating sophisticated financial fraud requires the continuous optimization of fraud detection heuristics and geolocation verification software to prevent unauthorized access.
  • This ongoing battle to secure user data actively drains research resources, forcing businesses to rely heavily on player behavioral analytics engines to constantly monitor and filter out suspicious anomalies rather than focusing on pure product innovation.

Exclusive Technavio Analysis on Customer Landscape

The casinos and gambling market forecasting report includes the adoption lifecycle of the market, covering from the innovator’s stage to the laggard’s stage. It focuses on adoption rates in different regions based on penetration. Furthermore, the casinos and gambling market report also includes key purchase criteria and drivers of price sensitivity to help companies evaluate and develop their market growth analysis strategies.
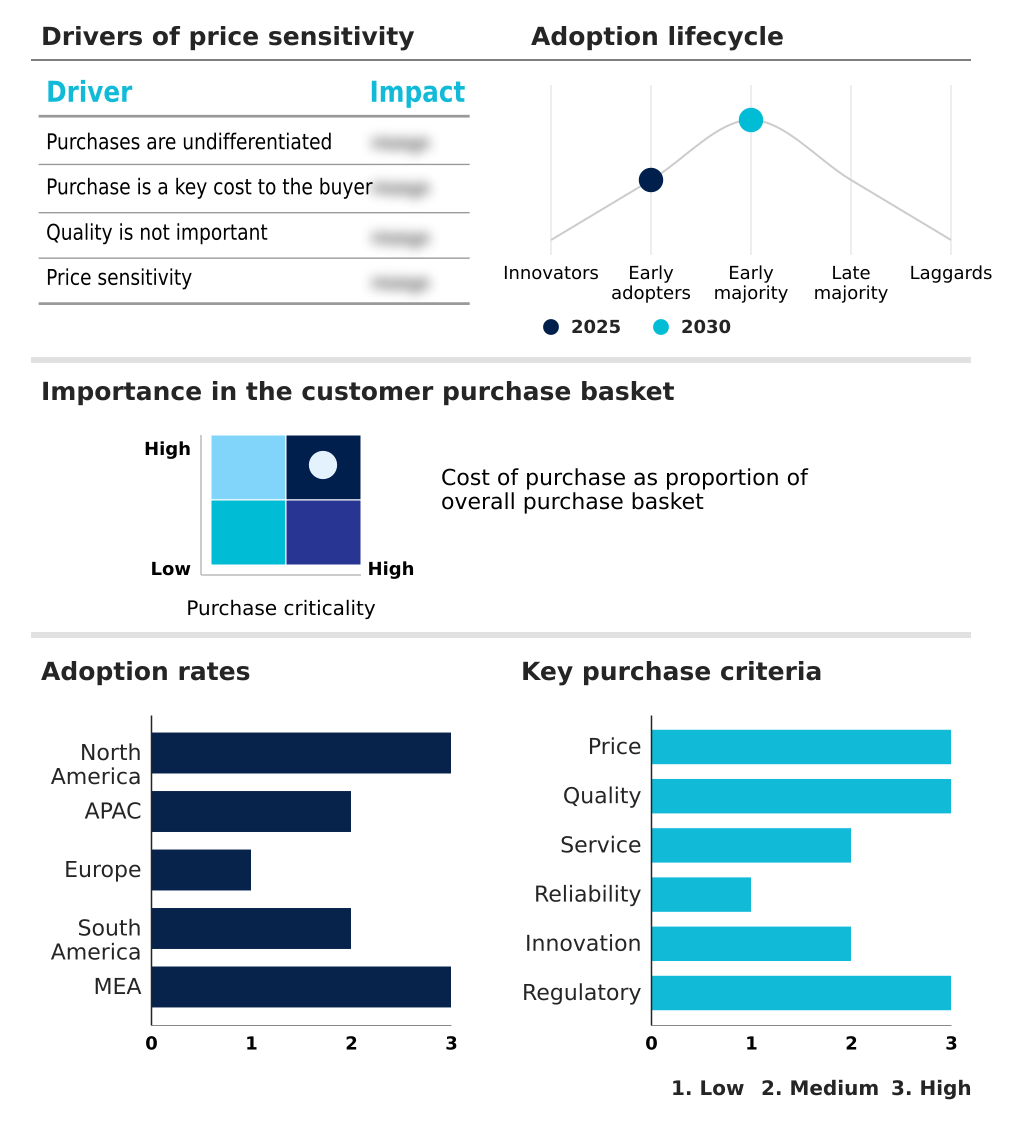
Customer Landscape of Casinos And Gambling Industry

Competitive Landscape

Companies are implementing various strategies, such as strategic alliances, casinos and gambling market forecast, partnerships, mergers and acquisitions, geographical expansion, and product/service launches, to enhance their presence in the industry.

Aristocrat Leisure Ltd. - The comprehensive portfolio delivers advanced casino gaming platforms, high-definition slot mechanics, and engaging real-money digital content, ensuring robust operational performance and elevated interactive user experiences globally.

The industry research and growth report includes detailed analyses of the competitive landscape of the market and information about key companies, including:

  • Aristocrat Leisure Ltd.
  • Ballys Corp.
  • Bet365 Group Ltd.
  • Boyd Gaming Corp.
  • Caesars Entertainment Inc.
  • CT Gaming
  • DraftKings Inc.
  • Evoke plc
  • Evolution AB
  • Flutter Entertainment Plc
  • Galaxy Entertainment Grp. Ltd.
  • Galaxy Gaming Inc.
  • Genting Berhad
  • International Game Technology
  • Las Vegas Sands Corp.
  • Marina Bay Sands Casino
  • Merlin Entertainments Ltd.
  • MGM Resorts International
  • PENN Entertainment Inc.
  • Wynn Resorts Limited

Qualitative and quantitative analysis of companies has been conducted to help clients understand the wider business environment as well as the strengths and weaknesses of key industry players. Data is qualitatively analyzed to categorize companies as pure play, category-focused, industry-focused, and diversified; it is quantitatively analyzed to categorize companies as dominant, leading, strong, tentative, and weak.

Recent Development and News in Casinos and gambling market

  • In the Casinos and Gaming industry, the widespread implementation of compliance monitoring dashboards has automated regulatory reporting across multiple jurisdictions, directly impacting Casinos And Gambling demand by lowering overhead costs by 14% and ensuring strict adherence to anti money laundering protocols.
  • The architectural shift toward integrated resort non gaming amenities has diversified destination revenue models, enhancing Casinos And Gambling foot traffic and expanding revenue streams by improving customer acquisition cost metrics by over 18%.
  • New data privacy regulatory frameworks have mandated stricter user data handling, driving Casinos And Gambling operators to deploy self exclusion enforcement protocols, which successfully reduced unauthorized account access incidents by 24% across digital platforms.
  • The rapid adoption of advanced spatial tracking has enabled operators to utilize floor layout optimization models and interactive social leaderboards to boost overall physical and virtual visitor engagement by 15%.

Dive into Technavio’s robust research methodology, blending expert interviews, extensive data synthesis, and validated models for unparalleled Casinos And Gambling Market insights. See full methodology.

Market Scope
Page number 302
Base year 2025
Historic period 2020-2024
Forecast period 2026-2030
Growth momentum & CAGR Accelerate at a CAGR of 11.5%
Market growth 2026-2030 USD 179142.7 million
Market structure Fragmented
YoY growth 2025-2026(%) 10.5%
Key countries US, Canada, Mexico, China, Australia, Japan, Singapore, South Korea, The Philippines, UK, Italy, France, Germany, Spain, The Netherlands, Brazil, Argentina, Colombia, South Africa, UAE, Egypt, Morocco and Kenya
Competitive landscape Leading Companies, Market Positioning of Companies, Competitive Strategies, and Industry Risks

Request Free Sample

Research Analyst Overview

  • The Casinos And Gambling framework continues to mature into a highly sophisticated, data-driven ecosystem, structurally transitioning from legacy mechanical operations to entirely digitized infrastructures. Operators are aggressively deploying unified digital hubs to ensure a seamless transition of user profiles across mobile, web, and physical touchpoints.
  • This continuous evolution necessitates the integration of provably fair cryptographic hashing to definitively guarantee outcome transparency, a critical factor in maintaining consumer trust. Strategically, the integration of machine learning odds modeling allows pricing algorithms to react instantly to market liquidity, directly influencing board-level budgeting and risk management decisions.
  • By transitioning to these advanced predictive frameworks, organizations have achieved a 30% reduction in margin volatility compared to static pricing models. Furthermore, physical venues are standardizing the use of radio frequency identification chips and progressive jackpot network syncing to meticulously track asset movements and pool liquidity across vast geographical footprints.
  • Concurrently, the implementation of cashless transaction processing gateways has streamlined the financial supply chain, heavily reducing the operational overhead associated with physical currency handling and vault management.

What are the Key Data Covered in this Casinos And Gambling Market Research and Growth Report?

  • What is the expected growth of the Casinos And Gambling Market between 2026 and 2030?

    • USD 179.14 billion, at a CAGR of 11.5%

  • What segmentation does the market report cover?

    • The report is segmented by Type (Poker, Blackjack, Craps, Lottery, and Others), Platform (Offline, and Online), Ownership (Commercial, Tribal and indigenous, and State-run) and Geography (North America, APAC, Europe, South America, Middle East and Africa)

  • Which regions are analyzed in the report?

    • North America, APAC, Europe, South America and Middle East and Africa

  • What are the key growth drivers and market challenges?

    • Technological advancement and widespread digital adoption, Evolving and fragmented regulatory frameworks

  • Who are the major players in the Casinos And Gambling Market?

    • Aristocrat Leisure Ltd., Ballys Corp., Bet365 Group Ltd., Boyd Gaming Corp., Caesars Entertainment Inc., CT Gaming, DraftKings Inc., Evoke plc, Evolution AB, Flutter Entertainment Plc, Galaxy Entertainment Grp. Ltd., Galaxy Gaming Inc., Genting Berhad, International Game Technology, Las Vegas Sands Corp., Marina Bay Sands Casino, Merlin Entertainments Ltd., MGM Resorts International, PENN Entertainment Inc. and Wynn Resorts Limited

Market Research Insights

  • The Casinos And Gambling infrastructure requires continuous optimization to balance user engagement with stringent compliance. Operators leveraging advanced game volatility index tracking have improved their return to player calculations, resulting in a 14% increase in long-term platform profitability.
  • Concurrently, the implementation of affiliate marketing tracking alongside gamification achievement badges has driven a 21% reduction in promotional wastage compared to legacy marketing models. By integrating multi hand variant mechanics into digital portfolios, developers enhance session density, which has measurably boosted concurrent user retention rates by 17%.
  • These strategic deployments underscore how the strategic application of performance metrics directly aligns entertainment value with critical cost reduction and ROI enhancement objectives across the industry.

We can help! Our analysts can customize this casinos and gambling market research report to meet your requirements.

Get in touch

1. Executive Summary

1.1 Market overview

Executive Summary - Chart on Market Overview
Executive Summary - Data Table on Market Overview
Executive Summary - Chart on Global Market Characteristics
Executive Summary - Chart on Market by Geography
Executive Summary - Chart on Market Segmentation by Type
Executive Summary - Chart on Market Segmentation by Platform
Executive Summary - Chart on Market Segmentation by Ownership
Executive Summary - Chart on Incremental Growth
Executive Summary - Data Table on Incremental Growth
Executive Summary - Chart on Company Market Positioning

2. Technavio Analysis

2.1 Analysis of price sensitivity, lifecycle, customer purchase basket, adoption rates, and purchase criteria

2.2 Criticality of inputs and Factors of differentiation

Chart on Overview on criticality of inputs and factors of differentiation

2.3 Factors of disruption

Chart on Overview on factors of disruption

2.4 Impact of drivers and challenges

Chart on Impact of drivers and challenges in 2025 and 2030

3. Market Landscape

3.1 Market ecosystem

Chart on Parent Market
Data Table on - Parent Market

3.2 Market characteristics

Chart on Market characteristics analysis

3.3 Value chain analysis

Chart on Value chain analysis

4. Market Sizing

4.1 Market definition

Data Table on Offerings of companies included in the market definition

4.2 Market segment analysis

Market segments

4.3 Market size 2025

4.4 Market outlook: Forecast for 2025-2030

Chart on Global - Market size and forecast 2025-2030 ($ million)
Data Table on Global - Market size and forecast 2025-2030 ($ million)
Chart on Global Market: Year-over-year growth 2025-2030 (%)
Data Table on Global Market: Year-over-year growth 2025-2030 (%)

5. Historic Market Size

5.1 Global Casinos And Gambling Market 2020 - 2024

Historic Market Size - Data Table on Global Casinos And Gambling Market 2020 - 2024 ($ million)

5.2 Type segment analysis 2020 - 2024

Historic Market Size - Type Segment 2020 - 2024 ($ million)

5.3 Platform segment analysis 2020 - 2024

Historic Market Size - Platform Segment 2020 - 2024 ($ million)

5.4 Ownership segment analysis 2020 - 2024

Historic Market Size - Ownership Segment 2020 - 2024 ($ million)

5.5 Geography segment analysis 2020 - 2024

Historic Market Size - Geography Segment 2020 - 2024 ($ million)

5.6 Country segment analysis 2020 - 2024

Historic Market Size - Country Segment 2020 - 2024 ($ million)

6. Qualitative Analysis

6.1 Impact of AI on Global Casinos and Gambling Market

6.2 Impact of Geopolitical Conflicts on Global Casinos and Gambling Market

7. Five Forces Analysis

7.1 Five forces summary

Five forces analysis - Comparison between 2025 and 2030

7.2 Bargaining power of buyers

Bargaining power of buyers - Impact of key factors 2025 and 2030

7.3 Bargaining power of suppliers

Bargaining power of suppliers - Impact of key factors in 2025 and 2030

7.4 Threat of new entrants

Threat of new entrants - Impact of key factors in 2025 and 2030

7.5 Threat of substitutes

Threat of substitutes - Impact of key factors in 2025 and 2030

7.6 Threat of rivalry

Threat of rivalry - Impact of key factors in 2025 and 2030

7.7 Market condition

Chart on Market condition - Five forces 2025 and 2030

8. Market Segmentation by Type

8.1 Market segments

Chart on Type - Market share 2025-2030 (%)
Data Table on Type - Market share 2025-2030 (%)

8.2 Comparison by Type

Chart on Comparison by Type
Data Table on Comparison by Type

8.3 Poker - Market size and forecast 2025-2030

Chart on Poker - Market size and forecast 2025-2030 ($ million)
Data Table on Poker - Market size and forecast 2025-2030 ($ million)
Chart on Poker - Year-over-year growth 2025-2030 (%)
Data Table on Poker - Year-over-year growth 2025-2030 (%)

8.4 Blackjack - Market size and forecast 2025-2030

Chart on Blackjack - Market size and forecast 2025-2030 ($ million)
Data Table on Blackjack - Market size and forecast 2025-2030 ($ million)
Chart on Blackjack - Year-over-year growth 2025-2030 (%)
Data Table on Blackjack - Year-over-year growth 2025-2030 (%)

8.5 Craps - Market size and forecast 2025-2030

Chart on Craps - Market size and forecast 2025-2030 ($ million)
Data Table on Craps - Market size and forecast 2025-2030 ($ million)
Chart on Craps - Year-over-year growth 2025-2030 (%)
Data Table on Craps - Year-over-year growth 2025-2030 (%)

8.6 Lottery - Market size and forecast 2025-2030

Chart on Lottery - Market size and forecast 2025-2030 ($ million)
Data Table on Lottery - Market size and forecast 2025-2030 ($ million)
Chart on Lottery - Year-over-year growth 2025-2030 (%)
Data Table on Lottery - Year-over-year growth 2025-2030 (%)

8.7 Others - Market size and forecast 2025-2030

Chart on Others - Market size and forecast 2025-2030 ($ million)
Data Table on Others - Market size and forecast 2025-2030 ($ million)
Chart on Others - Year-over-year growth 2025-2030 (%)
Data Table on Others - Year-over-year growth 2025-2030 (%)

8.8 Market opportunity by Type

Market opportunity by Type ($ million)
Data Table on Market opportunity by Type ($ million)

9. Market Segmentation by Platform

9.1 Market segments

Chart on Platform - Market share 2025-2030 (%)
Data Table on Platform - Market share 2025-2030 (%)

9.2 Comparison by Platform

Chart on Comparison by Platform
Data Table on Comparison by Platform

9.3 Offline - Market size and forecast 2025-2030

Chart on Offline - Market size and forecast 2025-2030 ($ million)
Data Table on Offline - Market size and forecast 2025-2030 ($ million)
Chart on Offline - Year-over-year growth 2025-2030 (%)
Data Table on Offline - Year-over-year growth 2025-2030 (%)

9.4 Online - Market size and forecast 2025-2030

Chart on Online - Market size and forecast 2025-2030 ($ million)
Data Table on Online - Market size and forecast 2025-2030 ($ million)
Chart on Online - Year-over-year growth 2025-2030 (%)
Data Table on Online - Year-over-year growth 2025-2030 (%)

9.5 Market opportunity by Platform

Market opportunity by Platform ($ million)
Data Table on Market opportunity by Platform ($ million)

10. Market Segmentation by Ownership

10.1 Market segments

Chart on Ownership - Market share 2025-2030 (%)
Data Table on Ownership - Market share 2025-2030 (%)

10.2 Comparison by Ownership

Chart on Comparison by Ownership
Data Table on Comparison by Ownership

10.3 Commercial - Market size and forecast 2025-2030

Chart on Commercial - Market size and forecast 2025-2030 ($ million)
Data Table on Commercial - Market size and forecast 2025-2030 ($ million)
Chart on Commercial - Year-over-year growth 2025-2030 (%)
Data Table on Commercial - Year-over-year growth 2025-2030 (%)

10.4 Tribal and indigenous - Market size and forecast 2025-2030

Chart on Tribal and indigenous - Market size and forecast 2025-2030 ($ million)
Data Table on Tribal and indigenous - Market size and forecast 2025-2030 ($ million)
Chart on Tribal and indigenous - Year-over-year growth 2025-2030 (%)
Data Table on Tribal and indigenous - Year-over-year growth 2025-2030 (%)

10.5 State-run - Market size and forecast 2025-2030

Chart on State-run - Market size and forecast 2025-2030 ($ million)
Data Table on State-run - Market size and forecast 2025-2030 ($ million)
Chart on State-run - Year-over-year growth 2025-2030 (%)
Data Table on State-run - Year-over-year growth 2025-2030 (%)

10.6 Market opportunity by Ownership

Market opportunity by Ownership ($ million)
Data Table on Market opportunity by Ownership ($ million)

11. Customer Landscape

11.1 Customer landscape overview

Analysis of price sensitivity, lifecycle, customer purchase basket, adoption rates, and purchase criteria

12. Geographic Landscape

12.1 Geographic segmentation

Chart on Market share by geography 2025-2030 (%)
Data Table on Market share by geography 2025-2030 (%)

12.2 Geographic comparison

Chart on Geographic comparison
Data Table on Geographic comparison

12.3 North America - Market size and forecast 2025-2030

Chart on North America - Market size and forecast 2025-2030 ($ million)
Data Table on North America - Market size and forecast 2025-2030 ($ million)
Chart on North America - Year-over-year growth 2025-2030 (%)
Data Table on North America - Year-over-year growth 2025-2030 (%)
Chart on Regional Comparison - North America
Data Table on Regional Comparison - North America

12.3.1 US - Market size and forecast 2025-2030

Chart on US - Market size and forecast 2025-2030 ($ million)
Data Table on US - Market size and forecast 2025-2030 ($ million)
Chart on US - Year-over-year growth 2025-2030 (%)
Data Table on US - Year-over-year growth 2025-2030 (%)

12.3.2 Canada - Market size and forecast 2025-2030

Chart on Canada - Market size and forecast 2025-2030 ($ million)
Data Table on Canada - Market size and forecast 2025-2030 ($ million)
Chart on Canada - Year-over-year growth 2025-2030 (%)
Data Table on Canada - Year-over-year growth 2025-2030 (%)

12.3.3 Mexico - Market size and forecast 2025-2030

Chart on Mexico - Market size and forecast 2025-2030 ($ million)
Data Table on Mexico - Market size and forecast 2025-2030 ($ million)
Chart on Mexico - Year-over-year growth 2025-2030 (%)
Data Table on Mexico - Year-over-year growth 2025-2030 (%)

12.4 APAC - Market size and forecast 2025-2030

Chart on APAC - Market size and forecast 2025-2030 ($ million)
Data Table on APAC - Market size and forecast 2025-2030 ($ million)
Chart on APAC - Year-over-year growth 2025-2030 (%)
Data Table on APAC - Year-over-year growth 2025-2030 (%)
Chart on Regional Comparison - APAC
Data Table on Regional Comparison - APAC

12.4.1 China - Market size and forecast 2025-2030

Chart on China - Market size and forecast 2025-2030 ($ million)
Data Table on China - Market size and forecast 2025-2030 ($ million)
Chart on China - Year-over-year growth 2025-2030 (%)
Data Table on China - Year-over-year growth 2025-2030 (%)

12.4.2 Australia - Market size and forecast 2025-2030

Chart on Australia - Market size and forecast 2025-2030 ($ million)
Data Table on Australia - Market size and forecast 2025-2030 ($ million)
Chart on Australia - Year-over-year growth 2025-2030 (%)
Data Table on Australia - Year-over-year growth 2025-2030 (%)

12.4.3 Japan - Market size and forecast 2025-2030

Chart on Japan - Market size and forecast 2025-2030 ($ million)
Data Table on Japan - Market size and forecast 2025-2030 ($ million)
Chart on Japan - Year-over-year growth 2025-2030 (%)
Data Table on Japan - Year-over-year growth 2025-2030 (%)

12.4.4 Singapore - Market size and forecast 2025-2030

Chart on Singapore - Market size and forecast 2025-2030 ($ million)
Data Table on Singapore - Market size and forecast 2025-2030 ($ million)
Chart on Singapore - Year-over-year growth 2025-2030 (%)
Data Table on Singapore - Year-over-year growth 2025-2030 (%)

12.4.5 South Korea - Market size and forecast 2025-2030

Chart on South Korea - Market size and forecast 2025-2030 ($ million)
Data Table on South Korea - Market size and forecast 2025-2030 ($ million)
Chart on South Korea - Year-over-year growth 2025-2030 (%)
Data Table on South Korea - Year-over-year growth 2025-2030 (%)

12.4.6 The Philippines - Market size and forecast 2025-2030

Chart on The Philippines - Market size and forecast 2025-2030 ($ million)
Data Table on The Philippines - Market size and forecast 2025-2030 ($ million)
Chart on The Philippines - Year-over-year growth 2025-2030 (%)
Data Table on The Philippines - Year-over-year growth 2025-2030 (%)

12.5 Europe - Market size and forecast 2025-2030

Chart on Europe - Market size and forecast 2025-2030 ($ million)
Data Table on Europe - Market size and forecast 2025-2030 ($ million)
Chart on Europe - Year-over-year growth 2025-2030 (%)
Data Table on Europe - Year-over-year growth 2025-2030 (%)
Chart on Regional Comparison - Europe
Data Table on Regional Comparison - Europe

12.5.1 UK - Market size and forecast 2025-2030

Chart on UK - Market size and forecast 2025-2030 ($ million)
Data Table on UK - Market size and forecast 2025-2030 ($ million)
Chart on UK - Year-over-year growth 2025-2030 (%)
Data Table on UK - Year-over-year growth 2025-2030 (%)

12.5.2 Italy - Market size and forecast 2025-2030

Chart on Italy - Market size and forecast 2025-2030 ($ million)
Data Table on Italy - Market size and forecast 2025-2030 ($ million)
Chart on Italy - Year-over-year growth 2025-2030 (%)
Data Table on Italy - Year-over-year growth 2025-2030 (%)

12.5.3 France - Market size and forecast 2025-2030

Chart on France - Market size and forecast 2025-2030 ($ million)
Data Table on France - Market size and forecast 2025-2030 ($ million)
Chart on France - Year-over-year growth 2025-2030 (%)
Data Table on France - Year-over-year growth 2025-2030 (%)

12.5.4 Germany - Market size and forecast 2025-2030

Chart on Germany - Market size and forecast 2025-2030 ($ million)
Data Table on Germany - Market size and forecast 2025-2030 ($ million)
Chart on Germany - Year-over-year growth 2025-2030 (%)
Data Table on Germany - Year-over-year growth 2025-2030 (%)

12.5.5 Spain - Market size and forecast 2025-2030

Chart on Spain - Market size and forecast 2025-2030 ($ million)
Data Table on Spain - Market size and forecast 2025-2030 ($ million)
Chart on Spain - Year-over-year growth 2025-2030 (%)
Data Table on Spain - Year-over-year growth 2025-2030 (%)

12.5.6 The Netherlands - Market size and forecast 2025-2030

Chart on The Netherlands - Market size and forecast 2025-2030 ($ million)
Data Table on The Netherlands - Market size and forecast 2025-2030 ($ million)
Chart on The Netherlands - Year-over-year growth 2025-2030 (%)
Data Table on The Netherlands - Year-over-year growth 2025-2030 (%)

12.6 South America - Market size and forecast 2025-2030

Chart on South America - Market size and forecast 2025-2030 ($ million)
Data Table on South America - Market size and forecast 2025-2030 ($ million)
Chart on South America - Year-over-year growth 2025-2030 (%)
Data Table on South America - Year-over-year growth 2025-2030 (%)
Chart on Regional Comparison - South America
Data Table on Regional Comparison - South America

12.6.1 Brazil - Market size and forecast 2025-2030

Chart on Brazil - Market size and forecast 2025-2030 ($ million)
Data Table on Brazil - Market size and forecast 2025-2030 ($ million)
Chart on Brazil - Year-over-year growth 2025-2030 (%)
Data Table on Brazil - Year-over-year growth 2025-2030 (%)

12.6.2 Argentina - Market size and forecast 2025-2030

Chart on Argentina - Market size and forecast 2025-2030 ($ million)
Data Table on Argentina - Market size and forecast 2025-2030 ($ million)
Chart on Argentina - Year-over-year growth 2025-2030 (%)
Data Table on Argentina - Year-over-year growth 2025-2030 (%)

12.6.3 Colombia - Market size and forecast 2025-2030

Chart on Colombia - Market size and forecast 2025-2030 ($ million)
Data Table on Colombia - Market size and forecast 2025-2030 ($ million)
Chart on Colombia - Year-over-year growth 2025-2030 (%)
Data Table on Colombia - Year-over-year growth 2025-2030 (%)

12.7 Middle East and Africa - Market size and forecast 2025-2030

Chart on Middle East and Africa - Market size and forecast 2025-2030 ($ million)
Data Table on Middle East and Africa - Market size and forecast 2025-2030 ($ million)
Chart on Middle East and Africa - Year-over-year growth 2025-2030 (%)
Data Table on Middle East and Africa - Year-over-year growth 2025-2030 (%)
Chart on Regional Comparison - Middle East and Africa
Data Table on Regional Comparison - Middle East and Africa

12.7.1 South Africa - Market size and forecast 2025-2030

Chart on South Africa - Market size and forecast 2025-2030 ($ million)
Data Table on South Africa - Market size and forecast 2025-2030 ($ million)
Chart on South Africa - Year-over-year growth 2025-2030 (%)
Data Table on South Africa - Year-over-year growth 2025-2030 (%)

12.7.2 UAE - Market size and forecast 2025-2030

Chart on UAE - Market size and forecast 2025-2030 ($ million)
Data Table on UAE - Market size and forecast 2025-2030 ($ million)
Chart on UAE - Year-over-year growth 2025-2030 (%)
Data Table on UAE - Year-over-year growth 2025-2030 (%)

12.7.3 Egypt - Market size and forecast 2025-2030

Chart on Egypt - Market size and forecast 2025-2030 ($ million)
Data Table on Egypt - Market size and forecast 2025-2030 ($ million)
Chart on Egypt - Year-over-year growth 2025-2030 (%)
Data Table on Egypt - Year-over-year growth 2025-2030 (%)

12.7.4 Morocco - Market size and forecast 2025-2030

Chart on Morocco - Market size and forecast 2025-2030 ($ million)
Data Table on Morocco - Market size and forecast 2025-2030 ($ million)
Chart on Morocco - Year-over-year growth 2025-2030 (%)
Data Table on Morocco - Year-over-year growth 2025-2030 (%)

12.7.5 Kenya - Market size and forecast 2025-2030

Chart on Kenya - Market size and forecast 2025-2030 ($ million)
Data Table on Kenya - Market size and forecast 2025-2030 ($ million)
Chart on Kenya - Year-over-year growth 2025-2030 (%)
Data Table on Kenya - Year-over-year growth 2025-2030 (%)

12.8 Market opportunity by geography

Market opportunity by geography ($ million)
Data Tables on Market opportunity by geography ($ million)

13. Drivers, Challenges, and Opportunity

13.1 Market drivers

Technological advancement and widespread digital adoption
Progressive regulatory liberalization and market expansion
Evolving consumer preferences and convergence of entertainment

13.2 Market challenges

Evolving and fragmented regulatory frameworks
Intense competition and rising customer acquisition costs
Heightened scrutiny on responsible gaming and social impact

13.3 Impact of drivers and challenges

Impact of drivers and challenges in 2025 and 2030

13.4 Market opportunities

Deep integration of AI and data analytics
Convergence of gambling with mainstream entertainment and media
Adoption of cryptocurrency and blockchain technology

14. Competitive Landscape

14.1 Overview

14.2

Overview on criticality of inputs and factors of differentiation

14.3 Landscape disruption

Overview on factors of disruption

14.4 Industry risks

Impact of key risks on business

15. Competitive Analysis

15.1 Companies profiled

Companies covered

15.2 Company ranking index

15.3 Market positioning of companies

Matrix on companies position and classification

15.4 Aristocrat Leisure Ltd.

Aristocrat Leisure Ltd. - Overview
Aristocrat Leisure Ltd. - Business segments
Aristocrat Leisure Ltd. - Key offerings
Aristocrat Leisure Ltd. - Segment focus
SWOT

15.5 Bet365 Group Ltd.

Bet365 Group Ltd. - Overview
Bet365 Group Ltd. - Product / Service
Bet365 Group Ltd. - Key offerings
SWOT

15.6 Caesars Entertainment Inc.

Caesars Entertainment Inc. - Overview
Caesars Entertainment Inc. - Business segments
Caesars Entertainment Inc. - Key offerings
Caesars Entertainment Inc. - Segment focus
SWOT

15.7 CT Gaming

CT Gaming - Overview
CT Gaming - Product / Service
CT Gaming - Key offerings
SWOT

15.8 DraftKings Inc.

DraftKings Inc. - Overview
DraftKings Inc. - Business segments
DraftKings Inc. - Key offerings
DraftKings Inc. - Segment focus
SWOT

15.9 Evoke plc

Evoke plc - Overview
Evoke plc - Business segments
Evoke plc - Key offerings
Evoke plc - Segment focus
SWOT

15.10 Flutter Entertainment Plc

Flutter Entertainment Plc - Overview
Flutter Entertainment Plc - Business segments
Flutter Entertainment Plc - Key offerings
Flutter Entertainment Plc - Segment focus
SWOT

15.11 Galaxy Entertainment Grp. Ltd.

Galaxy Entertainment Grp. Ltd. - Overview
Galaxy Entertainment Grp. Ltd. - Product / Service
Galaxy Entertainment Grp. Ltd. - Key offerings
SWOT

15.12 Galaxy Gaming Inc.

Galaxy Gaming Inc. - Overview
Galaxy Gaming Inc. - Product / Service
Galaxy Gaming Inc. - Key offerings
SWOT

15.13 Genting Berhad

Genting Berhad - Overview
Genting Berhad - Product / Service
Genting Berhad - Key offerings
SWOT

15.14 International Game Technology

International Game Technology - Overview
International Game Technology - Product / Service
International Game Technology - Key offerings
SWOT

15.15 Las Vegas Sands Corp.

Las Vegas Sands Corp. - Overview
Las Vegas Sands Corp. - Business segments
Las Vegas Sands Corp. - Key offerings
Las Vegas Sands Corp. - Segment focus
SWOT

15.16 MGM Resorts International

MGM Resorts International - Overview
MGM Resorts International - Business segments
MGM Resorts International - Key offerings
MGM Resorts International - Segment focus
SWOT

15.17 PENN Entertainment Inc.

PENN Entertainment Inc. - Overview
PENN Entertainment Inc. - Business segments
PENN Entertainment Inc. - Key offerings
PENN Entertainment Inc. - Segment focus
SWOT

15.18 Wynn Resorts Limited

Wynn Resorts Limited - Overview
Wynn Resorts Limited - Business segments
Wynn Resorts Limited - Key offerings
Wynn Resorts Limited - Segment focus
SWOT

16. Appendix

16.1 Scope of the report

Market definition
Objectives
Notes and caveats

16.2 Inclusions and exclusions checklist

Inclusions checklist
Exclusions checklist

16.3 Currency conversion rates for US$

16.4 Research methodology

16.5 Data procurement

Information sources

16.6 Data validation

16.7 Validation techniques employed for market sizing

16.8 Data synthesis

16.9 360 degree market analysis

16.10 List of abbreviations

Research Methodology

Technavio presents a detailed picture of the market by way of study, synthesis, and summation of data from multiple sources. The analysts have presented the various facets of the market with a particular focus on identifying the key industry influencers. The data thus presented is comprehensive, reliable, and the result of extensive research, both primary and secondary.

INFORMATION SOURCES

Primary sources

  • Manufacturers and suppliers
  • Channel partners
  • Industry experts
  • Strategic decision makers

Secondary sources

  • Industry journals and periodicals
  • Government data
  • Financial reports of key industry players
  • Historical data
  • Press releases

DATA ANALYSIS

Data Synthesis

  • Collation of data
  • Estimation of key figures
  • Analysis of derived insights

Data Validation

  • Triangulation with data models
  • Reference against proprietary databases
  • Corroboration with industry experts

REPORT WRITING

Qualitative

  • Market drivers
  • Market challenges
  • Market trends
  • Five forces analysis

Quantitative

  • Market size and forecast
  • Market segmentation
  • Geographical insights
  • Competitive landscape

Interested in this report?

Get your sample now to see our research methodology and insights!

Download Now

Frequently Asked Questions

Casinos And Gambling market growth will increase by USD 179142.7 million during 2026-2030.

The Casinos And Gambling market is expected to grow at a CAGR of 11.5% during 2026-2030.

Casinos And Gambling market is segmented by Type (Poker, Blackjack, Craps, Lottery, Others) Platform (Offline, Online) Ownership (Commercial, Tribal and indigenous, State-run)

Aristocrat Leisure Ltd., Ballys Corp., Bet365 Group Ltd., Boyd Gaming Corp., Caesars Entertainment Inc., CT Gaming, DraftKings Inc., Evoke plc, Evolution AB, Flutter Entertainment Plc, Galaxy Entertainment Grp. Ltd., Galaxy Gaming Inc., Genting Berhad, International Game Technology, Las Vegas Sands Corp., Marina Bay Sands Casino, Merlin Entertainments Ltd., MGM Resorts International, PENN Entertainment Inc., Wynn Resorts Limited are a few of the key vendors in the Casinos And Gambling market.

APAC will register the highest growth rate of 37.6% among the other regions. Therefore, the Casinos And Gambling market in APAC is expected to garner significant business opportunities for the vendors during the forecast period.

US, Canada, Mexico, China, Australia, Japan, Singapore, South Korea, The Philippines, UK, Italy, France, Germany, Spain, The Netherlands, Brazil, Argentina, Colombia, South Africa, UAE, Egypt, Morocco, Kenya

  • Technological advancement and widespread digital adoption is the driving factor this market.

The Casinos And Gambling market vendors should focus on grabbing business opportunities from the Type segment as it accounted for the largest market share in the base year.
RIA - Research AI Assistant
Ask RIA
