Small Wind Turbine Market Analysis, Size, and Forecast 2026-2030: APAC (China, India, and Japan), Europe (Germany, UK, and France), North America (US, Canada, and Mexico), South America (Brazil and Argentina), Middle East and Africa (South Africa, UAE, and Saudi Arabia), and Rest of World (ROW)

Small Wind Turbine Market Analysis, Size, and Forecast 2026-2030:
APAC (China, India, and Japan), Europe (Germany, UK, and France), North America (US, Canada, and Mexico), South America (Brazil and Argentina), Middle East and Africa (South Africa, UAE, and Saudi Arabia), and Rest of World (ROW)

Published: Mar 2026 285 Pages SKU: IRTNTR74380

Market Overview at a Glance

$899.8 Mn
Market Opportunity
9.2%
CAGR 2025 - 2030
46.7%
APAC Growth
$1.02 B
Horizontal axis segment 2024

Small Wind Turbine Market Size 2026-2030

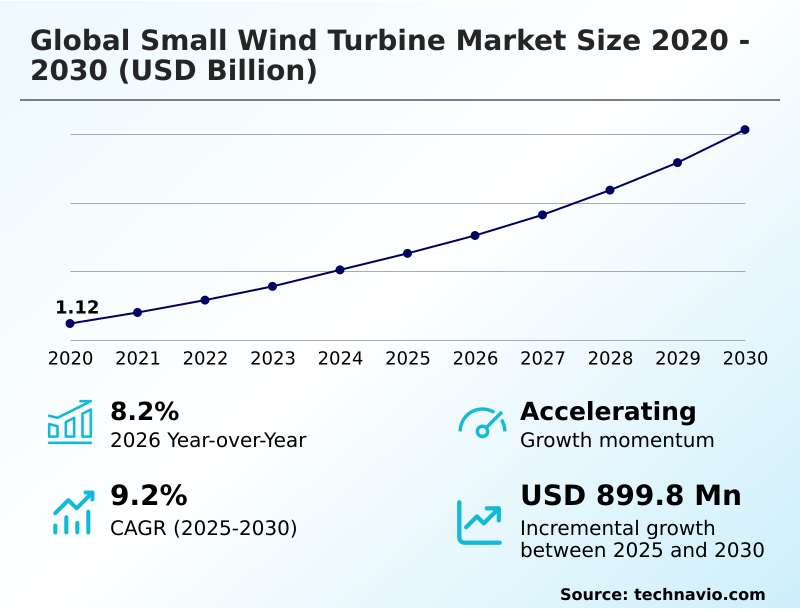
The small wind turbine market size is valued to increase by USD 899.8 million, at a CAGR of 9.2% from 2025 to 2030. Increasing demand for clean energy and supportive government policies will drive the small wind turbine market.

Major Market Trends & Insights

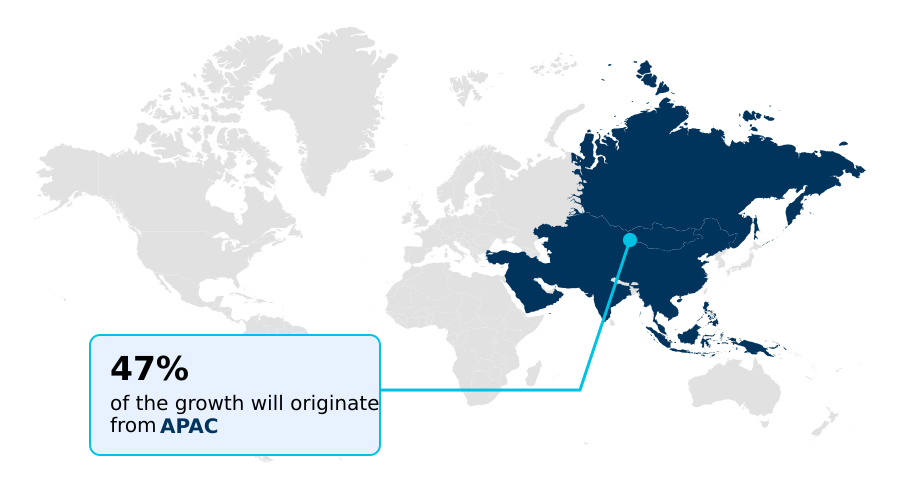
  • APAC dominated the market and accounted for a 46.7% growth during the forecast period.
  • By Type - Horizontal axis segment was valued at USD 1.02 billion in 2024
  • By Installation Sites - Onshore segment accounted for the largest market revenue share in 2024

Market Size & Forecast

  • Market Opportunities: USD 1.41 billion
  • Market Future Opportunities: USD 899.8 million
  • CAGR from 2025 to 2030 : 9.2%

Market Summary

  • The small wind turbine market is pivotal in the global shift towards diversified and resilient energy portfolios. This expansion is propelled by the dual drivers of achieving energy independence and electrifying remote, off-grid locations where extending traditional infrastructure is unfeasible.
  • Technological evolution is a core theme, with significant advancements in aerodynamic design and the widespread adoption of direct-drive systems enhancing both efficiency and reliability. For instance, an agricultural business can leverage a hybrid wind-solar system to power irrigation pumps, ensuring operational continuity and stable crop yields even during prolonged grid outages.
  • This on-site power generation capability provides a hedge against volatile electricity prices. However, the market's trajectory is moderated by challenges such as complex local permitting regulations and intense economic pressure from the rapidly maturing solar PV sector.
  • Success hinges on continued innovation in turbine performance, particularly in turbulent, lower-speed wind environments, and navigating the intricate landscape of public acceptance and policy support. The focus is shifting towards integrated solutions, where small wind is a critical component of a larger, intelligent energy ecosystem rather than a standalone product.

What will be the Size of the Small Wind Turbine Market during the forecast period?

Get Key Insights on Market Forecast (PDF) Request Free Sample

How is the Small Wind Turbine Market Segmented?

The small wind turbine industry research report provides comprehensive data (region-wise segment analysis), with forecasts and estimates in "USD million" for the period 2026-2030, as well as historical data from 2020-2024 for the following segments.

  • Type
    • Horizontal axis
    • Vertical axis
  • Installation sites
    • Onshore
    • Offshore
  • Product type
    • Single rotor
    • Double rotor
    • Multi-rotor
  • Geography
    • APAC
      • China
      • India
      • Japan
    • Europe
      • Germany
      • UK
      • France
    • North America
      • US
      • Canada
      • Mexico
    • South America
      • Brazil
      • Argentina
    • Middle East and Africa
      • South Africa
      • UAE
      • Saudi Arabia
    • Rest of World (ROW)

By Type Insights

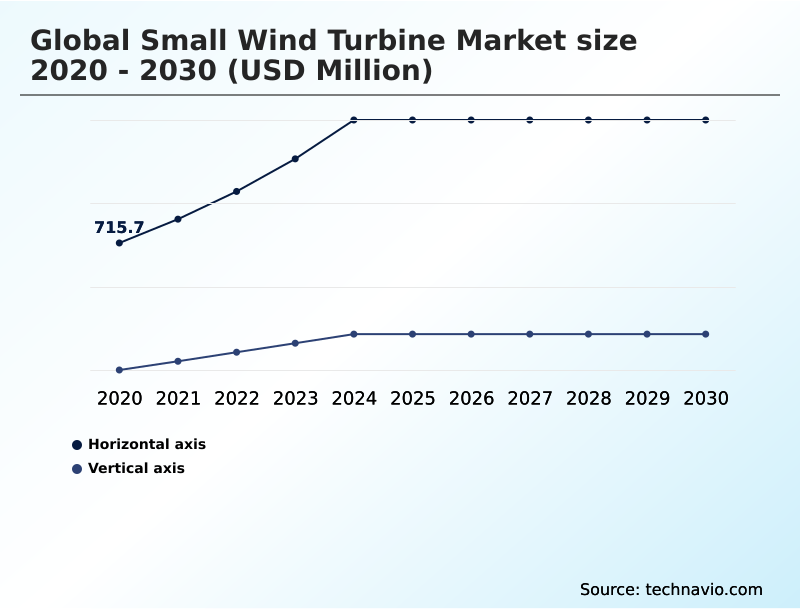
The horizontal axis segment is estimated to witness significant growth during the forecast period.

The horizontal axis segment, or HAWT, is the most established configuration in the small wind turbine market.

This design's mature technology, featuring a rotor with blades spinning on a parallel axis to the ground, is a result of extensive operational refinement.

Its lift-based approach to aerodynamic design provides a significant performance advantage in consistent, non-turbulent wind flows, making it ideal for agricultural and open-land commercial applications.

Systems using this technology demonstrate up to a 15% higher capacity factor in optimal wind sites. Innovation focuses on advanced airfoil profiles and composite materials to enhance the power curve.

The segment's growth is driven by its proven reliability and superior energy yield, supported by a robust manufacturing ecosystem that includes advanced power electronics and standardized grid interconnection protocols for seamless on-site power generation.

Request Free Sample

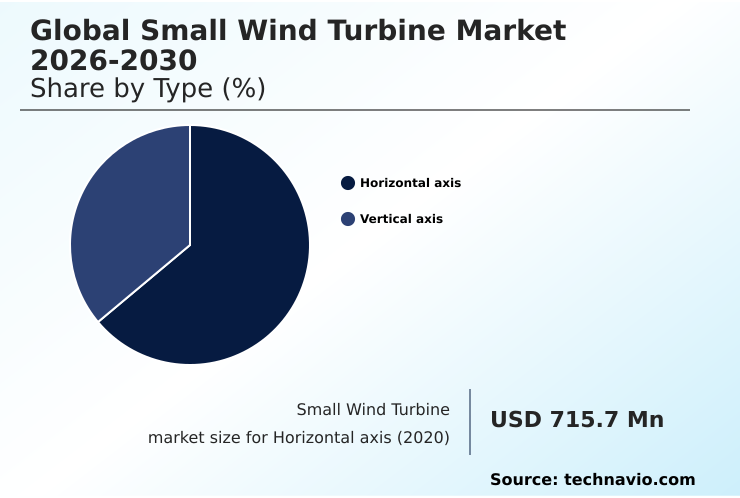
The Horizontal axis segment was valued at USD 1.02 billion in 2024 and showed a gradual increase during the forecast period.

Request Free Sample

Regional Analysis

APAC is estimated to contribute 46.7% to the growth of the global market during the forecast period.Technavio’s analysts have elaborately explained the regional trends and drivers that shape the market during the forecast period.

See How Small Wind Turbine Market Demand is Rising in APAC Request Free Sample

The geographic landscape of the small wind turbine market is diverse, with APAC poised to contribute nearly 47% of the market's incremental growth, driven largely by rural electrification programs and a burgeoning manufacturing base.

In this region, hybrid wind-solar systems for remote power systems have improved energy access for over 60% of targeted off-grid communities. North America and Europe remain mature markets, focusing on enhancing grid resilience and promoting community-owned energy projects.

In these regions, advanced vertical axis wind turbines are being integrated into urban environments to support net-zero energy buildings. The emphasis is on deploying turbines with a low tip-speed ratio to minimize noise and improve public acceptance.

The integration of smart inverters and sophisticated power electronics has boosted grid-connected system efficiency by up to 12%, optimizing energy sales and self-consumption.

Market Dynamics

Our researchers analyzed the data with 2025 as the base year, along with the key drivers, trends, and challenges. A holistic analysis of drivers will help companies refine their marketing strategies to gain a competitive advantage.

  • The decision-making process for adopting distributed wind technology involves a detailed evaluation of various factors, extending beyond initial costs. For an agricultural enterprise considering a small wind turbine for agricultural irrigation, the analysis must weigh the long-term benefits of energy independence against the initial investment.
  • In parallel, a property developer exploring a vertical axis turbine for urban environments must prioritize low-noise operation and aesthetic integration. A critical step for any potential adopter is a thorough cost comparison of small wind vs. solar, considering site-specific resources to accurately project the system's payback period.
  • The technical specifications, such as direct-drive turbine maintenance costs and advances in small wind turbine noise reduction technology, significantly influence the total cost of ownership. For off-grid applications, such as a small wind turbine for remote telecom sites, integrating small wind with battery storage is essential for ensuring a reliable power supply.
  • This hybrid approach is also central to developing a small wind turbine for community microgrids, which enhances local grid resilience. Hybrid systems have demonstrated up to a 40% greater energy availability in regions with complementary wind and solar resources compared to single-source setups, a critical factor for operational planning.
  • The market is also seeing growth in niche areas, with solutions like a small wind turbine for marine buoys gaining traction. Ultimately, leveraging government incentives for small wind turbines is crucial for improving project economics and accelerating the transition toward a small wind turbine for farm energy independence and broader decarbonization goals.

What are the key market drivers leading to the rise in the adoption of Small Wind Turbine Industry?

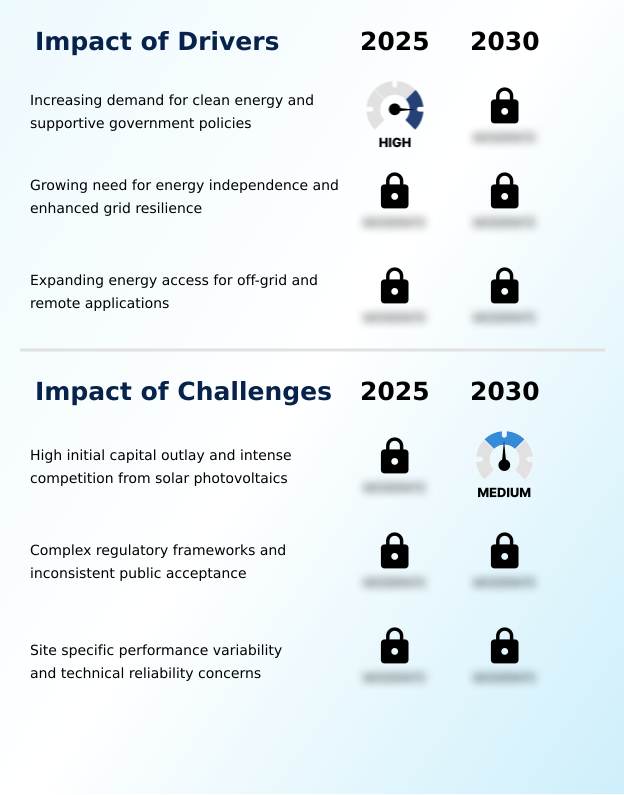
  • The increasing demand for clean energy, coupled with supportive government policies, serves as a key driver for market growth.

  • The market is fundamentally driven by the global pursuit of decentralized power generation and enhanced grid resilience.
  • Frequent power outages from extreme weather have led businesses to adopt on-site power generation, with such systems preventing production losses that can exceed 15% of daily revenue.
  • This demand for energy independence is reinforced by supportive government policies like renewable portfolio standards and feed-in tariffs, which improve the economic case for investment. Another major driver is the need for off-grid electrification in developing regions.
  • Small wind turbines provide a scalable solution for rural electrification and are critical for powering remote telecom tower power infrastructure.
  • The use of standalone systems in agriculture has been shown to boost farm productivity by over 20% by enabling reliable irrigation and processing.

What are the market trends shaping the Small Wind Turbine Industry?

  • The integration with hybrid renewable systems and energy storage is a significant upcoming trend. This shift enhances the reliability and consistency of power supply from distributed wind energy sources.

  • A key trend is the integration of turbines into hybrid systems with energy storage solutions. This approach addresses the intermittency of wind, with hybrid wind-solar installations achieving up to a 40% higher energy availability compared to single-source systems, enhancing energy self-sufficiency.
  • This trend is accelerating the adoption of urban wind energy solutions, where compact vertical axis wind turbines are being designed for building architecture integration to support net-zero energy buildings. Innovations in turbine design and efficiency, particularly in blade aerodynamics and direct-drive generators, are making systems quieter and more reliable.
  • Advanced control systems now allow for sophisticated demand response and peak shaving capabilities, reducing energy costs for commercial users by an average of 15% in certain markets. The market is capitalizing on this shift towards intelligent, multifaceted distributed energy ecosystems.

What challenges does the Small Wind Turbine Industry face during its growth?

  • A key challenge affecting industry growth is the high initial capital outlay required for small wind turbines, compounded by intense competition from solar photovoltaics.

  • A primary challenge is the high initial capital outlay and intense competition from solar PV. Complex regulatory frameworks and inconsistent public acceptance further restrain market growth, with permitting processes in some jurisdictions extending project timelines by over 200% compared to solar installations.
  • Site-specific performance variability is another significant hurdle; turbines can underperform by as much as 30% if site assessments fail to account for local turbulence. Lingering concerns over technical reliability and maintenance requirements also create skepticism among potential buyers.
  • Addressing these issues requires a focus on transparent performance data and designs optimized for lower wind speeds and turbulent wind flows, alongside advocacy for streamlined permitting and better community engagement to overcome aesthetic objections.

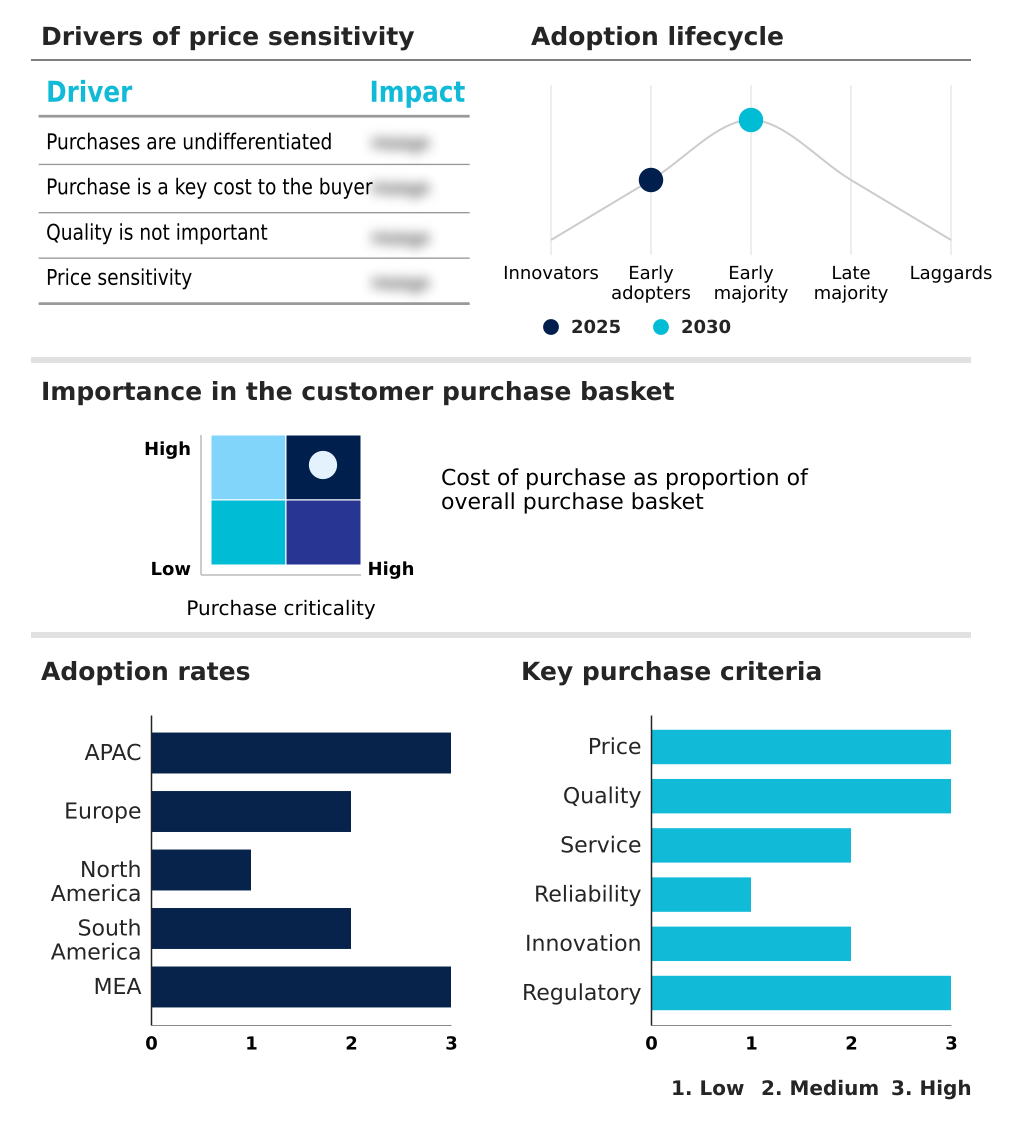
Exclusive Technavio Analysis on Customer Landscape

The small wind turbine market forecasting report includes the adoption lifecycle of the market, covering from the innovator’s stage to the laggard’s stage. It focuses on adoption rates in different regions based on penetration. Furthermore, the small wind turbine market report also includes key purchase criteria and drivers of price sensitivity to help companies evaluate and develop their market growth analysis strategies.

Customer Landscape of Small Wind Turbine Industry

Competitive Landscape

Companies are implementing various strategies, such as strategic alliances, small wind turbine market forecast, partnerships, mergers and acquisitions, geographical expansion, and product/service launches, to enhance their presence in the industry.

Aelius Turbina - Manufacturing wind turbines and generators, the company provides various wind energy solutions catering to diverse customer requirements.

The industry research and growth report includes detailed analyses of the competitive landscape of the market and information about key companies, including:

  • Aelius Turbina
  • Aeolos Wind Energy Ltd.
  • ArborWind
  • Chava Wind LLC
  • City Windmills Ltd.
  • EOCYCLE
  • GRESA GROUP Co.
  • Hi VAWT Technology Corp.
  • Kingspan Group
  • Kliux Energies International Inc.
  • Oy Windside Production Ltd.
  • Ryse Energy
  • SD Wind Energy Ltd.
  • Superwind GmbH
  • TUGE Energia
  • V Air Wind Technologies
  • Viking Wind

Qualitative and quantitative analysis of companies has been conducted to help clients understand the wider business environment as well as the strengths and weaknesses of key industry players. Data is qualitatively analyzed to categorize companies as pure play, category-focused, industry-focused, and diversified; it is quantitatively analyzed to categorize companies as dominant, leading, strong, tentative, and weak.

Recent Development and News in Small wind turbine market

  • In January 2025, the U.S. Department of Energy's National Renewable Energy Laboratory issued a request for proposals through its Competitiveness Improvement Project, making cost-shared grants available to manufacturers to optimize turbine designs and lower production costs.
  • In January 2025, Colbun, a Chilean power company, announced a USD 700 million investment in the Horizonte wind farm, an initiative indicative of growing regional confidence that strengthens the local supply chain for the broader wind energy sector.
  • In January 2025, the Energy Learning Network launched in the United Kingdom, backed by USD 2.025 million in funding, to foster community-led onshore wind projects by providing resources and peer mentoring to local groups.
  • In December 2024, HYKIT, a joint venture involving JCB, was launched to produce hydrogen distribution and refueling infrastructure, signaling a move toward integrated renewable energy systems that can influence small wind strategies.

Dive into Technavio’s robust research methodology, blending expert interviews, extensive data synthesis, and validated models for unparalleled Small Wind Turbine Market insights. See full methodology.

Market Scope
Page number 285
Base year 2025
Historic period 2020-2024
Forecast period 2026-2030
Growth momentum & CAGR Accelerate at a CAGR of 9.2%
Market growth 2026-2030 USD 899.8 million
Market structure Fragmented
YoY growth 2025-2026(%) 8.2%
Key countries China, India, Japan, Australia, South Korea, Indonesia, Germany, UK, France, Spain, Italy, The Netherlands, US, Canada, Mexico, Brazil, Argentina, Chile, South Africa, UAE, Saudi Arabia, Egypt and Kenya
Competitive landscape Leading Companies, Market Positioning of Companies, Competitive Strategies, and Industry Risks

Request Free Sample

Research Analyst Overview

  • The small wind turbine market is defined by continuous technological refinement aimed at enhancing both performance and economic viability across diverse applications. Central to this evolution is the ongoing optimization of aerodynamic design, with advanced airfoil profiles and lightweight composite materials enabling greater energy capture from a given wind resource.
  • A significant industry shift is the move toward direct-drive systems that utilize permanent magnet generators, a design that improves reliability by eliminating the gearbox. A key boardroom consideration is the integration of these assets into broader energy strategies; for instance, investing in building-integrated wind turbines is increasingly tied to corporate ESG goals and brand identity.
  • This is particularly relevant as systems with vertical axis wind turbine architecture, known for their lower shadow flicker and suitability for turbulent wind flows, gain traction in urban settings. The technological ecosystem, encompassing everything from the nacelle and yaw system to sophisticated power electronics and smart inverters, is maturing.
  • Systems featuring a high-quality drivetrain and rotor blades demonstrate a 25% reduction in annual maintenance costs, directly impacting operational budgets. The market offers solutions for both on-grid with grid interconnection and off-grid applications, with microgrid integration and pairing with energy storage solutions becoming standard for enhancing resilience.
  • Both horizontal axis wind turbine and vertical axis models are being engineered to improve their capacity factor and lower the cut-in speed, expanding their viability and addressing the needs of a distributed energy resource landscape.

What are the Key Data Covered in this Small Wind Turbine Market Research and Growth Report?

  • What is the expected growth of the Small Wind Turbine Market between 2026 and 2030?

    • USD 899.8 million, at a CAGR of 9.2%

  • What segmentation does the market report cover?

    • The report is segmented by Type (Horizontal axis, and Vertical axis), Installation Sites (Onshore, and Offshore), Product Type (Single rotor, Double rotor, and Multi-rotor) and Geography (APAC, Europe, North America, South America, Middle East and Africa)

  • Which regions are analyzed in the report?

    • APAC, Europe, North America, South America and Middle East and Africa

  • What are the key growth drivers and market challenges?

    • Increasing demand for clean energy and supportive government policies, High initial capital outlay and intense competition from solar photovoltaics

  • Who are the major players in the Small Wind Turbine Market?

    • Aelius Turbina, Aeolos Wind Energy Ltd., ArborWind, Chava Wind LLC, City Windmills Ltd., EOCYCLE, GRESA GROUP Co., Hi VAWT Technology Corp., Kingspan Group, Kliux Energies International Inc., Oy Windside Production Ltd., Ryse Energy, SD Wind Energy Ltd., Superwind GmbH, TUGE Energia, V Air Wind Technologies and Viking Wind

Market Research Insights

  • The market is defined by a dynamic push toward decentralized power generation, fundamentally altering how communities and businesses achieve grid resilience. This shift is reinforced by supportive renewable portfolio standards and feed-in tariffs in various regions.
  • For instance, the adoption of on-site power generation has been shown to reduce operational downtime by over 95% for critical commercial facilities during grid failures. Concurrently, the focus on urban wind energy is expanding, with building architecture integration becoming a key consideration.
  • Hybrid systems that combine wind with solar and battery storage are achieving over 40% greater energy self-sufficiency compared to standalone installations, improving the return on investment. The drive for rural electrification remains a cornerstone, where small wind turbines provide foundational power for remote communities, enhancing quality of life and enabling economic development with a high degree of reliability.

We can help! Our analysts can customize this small wind turbine market research report to meet your requirements.

Get in touch

1. Executive Summary

1.1 Market overview

Executive Summary - Chart on Market Overview
Executive Summary - Data Table on Market Overview
Executive Summary - Chart on Global Market Characteristics
Executive Summary - Chart on Market by Geography
Executive Summary - Chart on Market Segmentation by Type
Executive Summary - Chart on Market Segmentation by Installation Sites
Executive Summary - Chart on Market Segmentation by Product Type
Executive Summary - Chart on Incremental Growth
Executive Summary - Data Table on Incremental Growth
Executive Summary - Chart on Company Market Positioning

2. Technavio Analysis

2.1 Analysis of price sensitivity, lifecycle, customer purchase basket, adoption rates, and purchase criteria

2.2 Criticality of inputs and Factors of differentiation

Chart on Overview on criticality of inputs and factors of differentiation

2.3 Factors of disruption

Chart on Overview on factors of disruption

2.4 Impact of drivers and challenges

Chart on Impact of drivers and challenges in 2025 and 2030

3. Market Landscape

3.1 Market ecosystem

Chart on Parent Market
Data Table on - Parent Market

3.2 Market characteristics

Chart on Market characteristics analysis

3.3 Value chain analysis

Chart on Value chain analysis

4. Market Sizing

4.1 Market definition

Data Table on Offerings of companies included in the market definition

4.2 Market segment analysis

Market segments

4.3 Market size 2025

4.4 Market outlook: Forecast for 2025-2030

Chart on Global - Market size and forecast 2025-2030 ($ million)
Data Table on Global - Market size and forecast 2025-2030 ($ million)
Chart on Global Market: Year-over-year growth 2025-2030 (%)
Data Table on Global Market: Year-over-year growth 2025-2030 (%)

5. Historic Market Size

5.1 Global Small Wind Turbine Market 2020 - 2024

Historic Market Size - Data Table on Global Small Wind Turbine Market 2020 - 2024 ($ million)

5.2 Type segment analysis 2020 - 2024

Historic Market Size - Type Segment 2020 - 2024 ($ million)

5.3 Installation Sites segment analysis 2020 - 2024

Historic Market Size - Installation Sites Segment 2020 - 2024 ($ million)

5.4 Product Type segment analysis 2020 - 2024

Historic Market Size - Product Type Segment 2020 - 2024 ($ million)

5.5 Geography segment analysis 2020 - 2024

Historic Market Size - Geography Segment 2020 - 2024 ($ million)

5.6 Country segment analysis 2020 - 2024

Historic Market Size - Country Segment 2020 - 2024 ($ million)

6. Qualitative Analysis

6.1 Impact of AI on Global Small Wind Turbine Market

7. Five Forces Analysis

7.1 Five forces summary

Five forces analysis - Comparison between 2025 and 2030

7.2 Bargaining power of buyers

Bargaining power of buyers - Impact of key factors 2025 and 2030

7.3 Bargaining power of suppliers

Bargaining power of suppliers - Impact of key factors in 2025 and 2030

7.4 Threat of new entrants

Threat of new entrants - Impact of key factors in 2025 and 2030

7.5 Threat of substitutes

Threat of substitutes - Impact of key factors in 2025 and 2030

7.6 Threat of rivalry

Threat of rivalry - Impact of key factors in 2025 and 2030

7.7 Market condition

Chart on Market condition - Five forces 2025 and 2030

8. Market Segmentation by Type

8.1 Market segments

Chart on Type - Market share 2025-2030 (%)
Data Table on Type - Market share 2025-2030 (%)

8.2 Comparison by Type

Chart on Comparison by Type
Data Table on Comparison by Type

8.3 Horizontal axis - Market size and forecast 2025-2030

Chart on Horizontal axis - Market size and forecast 2025-2030 ($ million)
Data Table on Horizontal axis - Market size and forecast 2025-2030 ($ million)
Chart on Horizontal axis - Year-over-year growth 2025-2030 (%)
Data Table on Horizontal axis - Year-over-year growth 2025-2030 (%)

8.4 Vertical axis - Market size and forecast 2025-2030

Chart on Vertical axis - Market size and forecast 2025-2030 ($ million)
Data Table on Vertical axis - Market size and forecast 2025-2030 ($ million)
Chart on Vertical axis - Year-over-year growth 2025-2030 (%)
Data Table on Vertical axis - Year-over-year growth 2025-2030 (%)

8.5 Market opportunity by Type

Market opportunity by Type ($ million)
Data Table on Market opportunity by Type ($ million)

9. Market Segmentation by Installation Sites

9.1 Market segments

Chart on Installation Sites - Market share 2025-2030 (%)
Data Table on Installation Sites - Market share 2025-2030 (%)

9.2 Comparison by Installation Sites

Chart on Comparison by Installation Sites
Data Table on Comparison by Installation Sites

9.3 Onshore - Market size and forecast 2025-2030

Chart on Onshore - Market size and forecast 2025-2030 ($ million)
Data Table on Onshore - Market size and forecast 2025-2030 ($ million)
Chart on Onshore - Year-over-year growth 2025-2030 (%)
Data Table on Onshore - Year-over-year growth 2025-2030 (%)

9.4 Offshore - Market size and forecast 2025-2030

Chart on Offshore - Market size and forecast 2025-2030 ($ million)
Data Table on Offshore - Market size and forecast 2025-2030 ($ million)
Chart on Offshore - Year-over-year growth 2025-2030 (%)
Data Table on Offshore - Year-over-year growth 2025-2030 (%)

9.5 Market opportunity by Installation Sites

Market opportunity by Installation Sites ($ million)
Data Table on Market opportunity by Installation Sites ($ million)

10. Market Segmentation by Product Type

10.1 Market segments

Chart on Product Type - Market share 2025-2030 (%)
Data Table on Product Type - Market share 2025-2030 (%)

10.2 Comparison by Product Type

Chart on Comparison by Product Type
Data Table on Comparison by Product Type

10.3 Single rotor - Market size and forecast 2025-2030

Chart on Single rotor - Market size and forecast 2025-2030 ($ million)
Data Table on Single rotor - Market size and forecast 2025-2030 ($ million)
Chart on Single rotor - Year-over-year growth 2025-2030 (%)
Data Table on Single rotor - Year-over-year growth 2025-2030 (%)

10.4 Double rotor - Market size and forecast 2025-2030

Chart on Double rotor - Market size and forecast 2025-2030 ($ million)
Data Table on Double rotor - Market size and forecast 2025-2030 ($ million)
Chart on Double rotor - Year-over-year growth 2025-2030 (%)
Data Table on Double rotor - Year-over-year growth 2025-2030 (%)

10.5 Multi-rotor - Market size and forecast 2025-2030

Chart on Multi-rotor - Market size and forecast 2025-2030 ($ million)
Data Table on Multi-rotor - Market size and forecast 2025-2030 ($ million)
Chart on Multi-rotor - Year-over-year growth 2025-2030 (%)
Data Table on Multi-rotor - Year-over-year growth 2025-2030 (%)

10.6 Market opportunity by Product Type

Market opportunity by Product Type ($ million)
Data Table on Market opportunity by Product Type ($ million)

11. Customer Landscape

11.1 Customer landscape overview

Analysis of price sensitivity, lifecycle, customer purchase basket, adoption rates, and purchase criteria

12. Geographic Landscape

12.1 Geographic segmentation

Chart on Market share by geography 2025-2030 (%)
Data Table on Market share by geography 2025-2030 (%)

12.2 Geographic comparison

Chart on Geographic comparison
Data Table on Geographic comparison

12.3 APAC - Market size and forecast 2025-2030

Chart on APAC - Market size and forecast 2025-2030 ($ million)
Data Table on APAC - Market size and forecast 2025-2030 ($ million)
Chart on APAC - Year-over-year growth 2025-2030 (%)
Data Table on APAC - Year-over-year growth 2025-2030 (%)
Chart on Regional Comparison - APAC
Data Table on Regional Comparison - APAC

12.3.1 China - Market size and forecast 2025-2030

Chart on China - Market size and forecast 2025-2030 ($ million)
Data Table on China - Market size and forecast 2025-2030 ($ million)
Chart on China - Year-over-year growth 2025-2030 (%)
Data Table on China - Year-over-year growth 2025-2030 (%)

12.3.2 India - Market size and forecast 2025-2030

Chart on India - Market size and forecast 2025-2030 ($ million)
Data Table on India - Market size and forecast 2025-2030 ($ million)
Chart on India - Year-over-year growth 2025-2030 (%)
Data Table on India - Year-over-year growth 2025-2030 (%)

12.3.3 Japan - Market size and forecast 2025-2030

Chart on Japan - Market size and forecast 2025-2030 ($ million)
Data Table on Japan - Market size and forecast 2025-2030 ($ million)
Chart on Japan - Year-over-year growth 2025-2030 (%)
Data Table on Japan - Year-over-year growth 2025-2030 (%)

12.3.4 Australia - Market size and forecast 2025-2030

Chart on Australia - Market size and forecast 2025-2030 ($ million)
Data Table on Australia - Market size and forecast 2025-2030 ($ million)
Chart on Australia - Year-over-year growth 2025-2030 (%)
Data Table on Australia - Year-over-year growth 2025-2030 (%)

12.3.5 South Korea - Market size and forecast 2025-2030

Chart on South Korea - Market size and forecast 2025-2030 ($ million)
Data Table on South Korea - Market size and forecast 2025-2030 ($ million)
Chart on South Korea - Year-over-year growth 2025-2030 (%)
Data Table on South Korea - Year-over-year growth 2025-2030 (%)

12.3.6 Indonesia - Market size and forecast 2025-2030

Chart on Indonesia - Market size and forecast 2025-2030 ($ million)
Data Table on Indonesia - Market size and forecast 2025-2030 ($ million)
Chart on Indonesia - Year-over-year growth 2025-2030 (%)
Data Table on Indonesia - Year-over-year growth 2025-2030 (%)

12.4 Europe - Market size and forecast 2025-2030

Chart on Europe - Market size and forecast 2025-2030 ($ million)
Data Table on Europe - Market size and forecast 2025-2030 ($ million)
Chart on Europe - Year-over-year growth 2025-2030 (%)
Data Table on Europe - Year-over-year growth 2025-2030 (%)
Chart on Regional Comparison - Europe
Data Table on Regional Comparison - Europe

12.4.1 Germany - Market size and forecast 2025-2030

Chart on Germany - Market size and forecast 2025-2030 ($ million)
Data Table on Germany - Market size and forecast 2025-2030 ($ million)
Chart on Germany - Year-over-year growth 2025-2030 (%)
Data Table on Germany - Year-over-year growth 2025-2030 (%)

12.4.2 UK - Market size and forecast 2025-2030

Chart on UK - Market size and forecast 2025-2030 ($ million)
Data Table on UK - Market size and forecast 2025-2030 ($ million)
Chart on UK - Year-over-year growth 2025-2030 (%)
Data Table on UK - Year-over-year growth 2025-2030 (%)

12.4.3 France - Market size and forecast 2025-2030

Chart on France - Market size and forecast 2025-2030 ($ million)
Data Table on France - Market size and forecast 2025-2030 ($ million)
Chart on France - Year-over-year growth 2025-2030 (%)
Data Table on France - Year-over-year growth 2025-2030 (%)

12.4.4 Spain - Market size and forecast 2025-2030

Chart on Spain - Market size and forecast 2025-2030 ($ million)
Data Table on Spain - Market size and forecast 2025-2030 ($ million)
Chart on Spain - Year-over-year growth 2025-2030 (%)
Data Table on Spain - Year-over-year growth 2025-2030 (%)

12.4.5 Italy - Market size and forecast 2025-2030

Chart on Italy - Market size and forecast 2025-2030 ($ million)
Data Table on Italy - Market size and forecast 2025-2030 ($ million)
Chart on Italy - Year-over-year growth 2025-2030 (%)
Data Table on Italy - Year-over-year growth 2025-2030 (%)

12.4.6 The Netherlands - Market size and forecast 2025-2030

Chart on The Netherlands - Market size and forecast 2025-2030 ($ million)
Data Table on The Netherlands - Market size and forecast 2025-2030 ($ million)
Chart on The Netherlands - Year-over-year growth 2025-2030 (%)
Data Table on The Netherlands - Year-over-year growth 2025-2030 (%)

12.5 North America - Market size and forecast 2025-2030

Chart on North America - Market size and forecast 2025-2030 ($ million)
Data Table on North America - Market size and forecast 2025-2030 ($ million)
Chart on North America - Year-over-year growth 2025-2030 (%)
Data Table on North America - Year-over-year growth 2025-2030 (%)
Chart on Regional Comparison - North America
Data Table on Regional Comparison - North America

12.5.1 US - Market size and forecast 2025-2030

Chart on US - Market size and forecast 2025-2030 ($ million)
Data Table on US - Market size and forecast 2025-2030 ($ million)
Chart on US - Year-over-year growth 2025-2030 (%)
Data Table on US - Year-over-year growth 2025-2030 (%)

12.5.2 Canada - Market size and forecast 2025-2030

Chart on Canada - Market size and forecast 2025-2030 ($ million)
Data Table on Canada - Market size and forecast 2025-2030 ($ million)
Chart on Canada - Year-over-year growth 2025-2030 (%)
Data Table on Canada - Year-over-year growth 2025-2030 (%)

12.5.3 Mexico - Market size and forecast 2025-2030

Chart on Mexico - Market size and forecast 2025-2030 ($ million)
Data Table on Mexico - Market size and forecast 2025-2030 ($ million)
Chart on Mexico - Year-over-year growth 2025-2030 (%)
Data Table on Mexico - Year-over-year growth 2025-2030 (%)

12.6 South America - Market size and forecast 2025-2030

Chart on South America - Market size and forecast 2025-2030 ($ million)
Data Table on South America - Market size and forecast 2025-2030 ($ million)
Chart on South America - Year-over-year growth 2025-2030 (%)
Data Table on South America - Year-over-year growth 2025-2030 (%)
Chart on Regional Comparison - South America
Data Table on Regional Comparison - South America

12.6.1 Brazil - Market size and forecast 2025-2030

Chart on Brazil - Market size and forecast 2025-2030 ($ million)
Data Table on Brazil - Market size and forecast 2025-2030 ($ million)
Chart on Brazil - Year-over-year growth 2025-2030 (%)
Data Table on Brazil - Year-over-year growth 2025-2030 (%)

12.6.2 Argentina - Market size and forecast 2025-2030

Chart on Argentina - Market size and forecast 2025-2030 ($ million)
Data Table on Argentina - Market size and forecast 2025-2030 ($ million)
Chart on Argentina - Year-over-year growth 2025-2030 (%)
Data Table on Argentina - Year-over-year growth 2025-2030 (%)

12.6.3 Chile - Market size and forecast 2025-2030

Chart on Chile - Market size and forecast 2025-2030 ($ million)
Data Table on Chile - Market size and forecast 2025-2030 ($ million)
Chart on Chile - Year-over-year growth 2025-2030 (%)
Data Table on Chile - Year-over-year growth 2025-2030 (%)

12.7 Middle East and Africa - Market size and forecast 2025-2030

Chart on Middle East and Africa - Market size and forecast 2025-2030 ($ million)
Data Table on Middle East and Africa - Market size and forecast 2025-2030 ($ million)
Chart on Middle East and Africa - Year-over-year growth 2025-2030 (%)
Data Table on Middle East and Africa - Year-over-year growth 2025-2030 (%)
Chart on Regional Comparison - Middle East and Africa
Data Table on Regional Comparison - Middle East and Africa

12.7.1 South Africa - Market size and forecast 2025-2030

Chart on South Africa - Market size and forecast 2025-2030 ($ million)
Data Table on South Africa - Market size and forecast 2025-2030 ($ million)
Chart on South Africa - Year-over-year growth 2025-2030 (%)
Data Table on South Africa - Year-over-year growth 2025-2030 (%)

12.7.2 UAE - Market size and forecast 2025-2030

Chart on UAE - Market size and forecast 2025-2030 ($ million)
Data Table on UAE - Market size and forecast 2025-2030 ($ million)
Chart on UAE - Year-over-year growth 2025-2030 (%)
Data Table on UAE - Year-over-year growth 2025-2030 (%)

12.7.3 Saudi Arabia - Market size and forecast 2025-2030

Chart on Saudi Arabia - Market size and forecast 2025-2030 ($ million)
Data Table on Saudi Arabia - Market size and forecast 2025-2030 ($ million)
Chart on Saudi Arabia - Year-over-year growth 2025-2030 (%)
Data Table on Saudi Arabia - Year-over-year growth 2025-2030 (%)

12.7.4 Egypt - Market size and forecast 2025-2030

Chart on Egypt - Market size and forecast 2025-2030 ($ million)
Data Table on Egypt - Market size and forecast 2025-2030 ($ million)
Chart on Egypt - Year-over-year growth 2025-2030 (%)
Data Table on Egypt - Year-over-year growth 2025-2030 (%)

12.7.5 Kenya - Market size and forecast 2025-2030

Chart on Kenya - Market size and forecast 2025-2030 ($ million)
Data Table on Kenya - Market size and forecast 2025-2030 ($ million)
Chart on Kenya - Year-over-year growth 2025-2030 (%)
Data Table on Kenya - Year-over-year growth 2025-2030 (%)

12.8 Market opportunity by geography

Market opportunity by geography ($ million)
Data Tables on Market opportunity by geography ($ million)

13. Drivers, Challenges, and Opportunity

13.1 Market drivers

Increasing demand for clean energy and supportive government policies
Growing need for energy independence and enhanced grid resilience
Expanding energy access for off-grid and remote applications

13.2 Market challenges

High initial capital outlay and intense competition from solar photovoltaics
Complex regulatory frameworks and inconsistent public acceptance
Site specific performance variability and technical reliability concerns

13.3 Impact of drivers and challenges

Impact of drivers and challenges in 2025 and 2030

13.4 Market opportunities

Integration with hybrid renewable systems and energy storage
Technological advancements in turbine design and efficiency
Growing focus on urban and building-integrated wind energy solutions

14. Competitive Landscape

14.1 Overview

14.2

Overview on criticality of inputs and factors of differentiation

14.3 Landscape disruption

Overview on factors of disruption

14.4 Industry risks

Impact of key risks on business

15. Competitive Analysis

15.1 Companies profiled

Companies covered

15.2 Company ranking index

15.3 Market positioning of companies

Matrix on companies position and classification

15.4 Aelius Turbina

Aelius Turbina - Overview
Aelius Turbina - Product / Service
Aelius Turbina - Key offerings
SWOT

15.5 ArborWind

ArborWind - Overview
ArborWind - Product / Service
ArborWind - Key offerings
SWOT

15.6 Chava Wind LLC

Chava Wind LLC - Overview
Chava Wind LLC - Product / Service
Chava Wind LLC - Key offerings
SWOT

15.7 City Windmills Ltd.

City Windmills Ltd. - Overview
City Windmills Ltd. - Product / Service
City Windmills Ltd. - Key offerings
SWOT

15.8 EOCYCLE

EOCYCLE - Overview
EOCYCLE - Product / Service
EOCYCLE - Key offerings
SWOT

15.9 GRESA GROUP Co.

GRESA GROUP Co. - Overview
GRESA GROUP Co. - Product / Service
GRESA GROUP Co. - Key offerings
SWOT

15.10 Hi VAWT Technology Corp.

Hi VAWT Technology Corp. - Overview
Hi VAWT Technology Corp. - Product / Service
Hi VAWT Technology Corp. - Key offerings
SWOT

15.11 Kingspan Group

Kingspan Group - Overview
Kingspan Group - Product / Service
Kingspan Group - Key news
Kingspan Group - Key offerings
SWOT

15.12 Kliux Energies International Inc.

Kliux Energies International Inc. - Overview
Kliux Energies International Inc. - Product / Service
Kliux Energies International Inc. - Key offerings
SWOT

15.13 Oy Windside Production Ltd.

Oy Windside Production Ltd. - Overview
Oy Windside Production Ltd. - Product / Service
Oy Windside Production Ltd. - Key offerings
SWOT

15.14 Ryse Energy

Ryse Energy - Overview
Ryse Energy - Product / Service
Ryse Energy - Key offerings
SWOT

15.15 SD Wind Energy Ltd.

SD Wind Energy Ltd. - Overview
SD Wind Energy Ltd. - Product / Service
SD Wind Energy Ltd. - Key offerings
SWOT

15.16 Superwind GmbH

Superwind GmbH - Overview
Superwind GmbH - Product / Service
Superwind GmbH - Key offerings
SWOT

15.17 TUGE Energia

TUGE Energia - Overview
TUGE Energia - Product / Service
TUGE Energia - Key offerings
SWOT

15.18 Viking Wind

Viking Wind - Overview
Viking Wind - Product / Service
Viking Wind - Key offerings
SWOT

16. Appendix

16.1 Scope of the report

Market definition
Objectives
Notes and caveats

16.2 Inclusions and exclusions checklist

Inclusions checklist
Exclusions checklist

16.3 Currency conversion rates for US$

16.4 Research methodology

16.5 Data procurement

Information sources

16.6 Data validation

16.7 Validation techniques employed for market sizing

16.8 Data synthesis

16.9 360 degree market analysis

16.10 List of abbreviations

Research Methodology

Technavio presents a detailed picture of the market by way of study, synthesis, and summation of data from multiple sources. The analysts have presented the various facets of the market with a particular focus on identifying the key industry influencers. The data thus presented is comprehensive, reliable, and the result of extensive research, both primary and secondary.

INFORMATION SOURCES

Primary sources

  • Manufacturers and suppliers
  • Channel partners
  • Industry experts
  • Strategic decision makers

Secondary sources

  • Industry journals and periodicals
  • Government data
  • Financial reports of key industry players
  • Historical data
  • Press releases

DATA ANALYSIS

Data Synthesis

  • Collation of data
  • Estimation of key figures
  • Analysis of derived insights

Data Validation

  • Triangulation with data models
  • Reference against proprietary databases
  • Corroboration with industry experts

REPORT WRITING

Qualitative

  • Market drivers
  • Market challenges
  • Market trends
  • Five forces analysis

Quantitative

  • Market size and forecast
  • Market segmentation
  • Geographical insights
  • Competitive landscape

Interested in this report?

Get your sample now to see our research methodology and insights!

Download Now

Frequently Asked Questions

Small Wind Turbine market growth will increase by USD 899.8 million during 2026-2030.

The Small Wind Turbine market is expected to grow at a CAGR of 9.2% during 2026-2030.

Small Wind Turbine market is segmented by Type (Horizontal axis, Vertical axis) Installation sites (Onshore, Offshore) Product type (Single rotor, Double rotor, Multi-rotor)

Aelius Turbina, Aeolos Wind Energy Ltd., ArborWind, Chava Wind LLC, City Windmills Ltd., EOCYCLE, GRESA GROUP Co., Hi VAWT Technology Corp., Kingspan Group, Kliux Energies International Inc., Oy Windside Production Ltd., Ryse Energy, SD Wind Energy Ltd., Superwind GmbH, TUGE Energia, V Air Wind Technologies, Viking Wind are a few of the key vendors in the Small Wind Turbine market.

APAC will register the highest growth rate of 46.7% among the other regions. Therefore, the Small Wind Turbine market in APAC is expected to garner significant business opportunities for the vendors during the forecast period.

China, India, Japan, Australia, South Korea, Indonesia, Germany, UK, France, Spain, Italy, The Netherlands, US, Canada, Mexico, Brazil, Argentina, Chile, South Africa, UAE, Saudi Arabia, Egypt, Kenya

  • Increasing demand for clean energy and supportive government policies is the driving factor this market.

The Small Wind Turbine market vendors should focus on grabbing business opportunities from the Type segment as it accounted for the largest market share in the base year.
RIA - Research AI Assistant
Ask RIA