Smart Connected Cooking Appliances Market Analysis North America, Europe, APAC, South America, Middle East and Africa - US, China, Japan, Germany, UK - Size and Forecast 2024-2028

Smart Connected Cooking Appliances Market Analysis North America, Europe, APAC, South America, Middle East and Africa - US, China, Japan, Germany, UK - Size and Forecast 2024-2028

Published: Dec 2023 170 Pages SKU: IRTNTR70437

Market Overview at a Glance

$19.62 B
Market Opportunity
26.58%
CAGR
22.06
YoY growth 2023-2024(%)

Smart Connected Cooking Appliances Market Size 2024-2028 

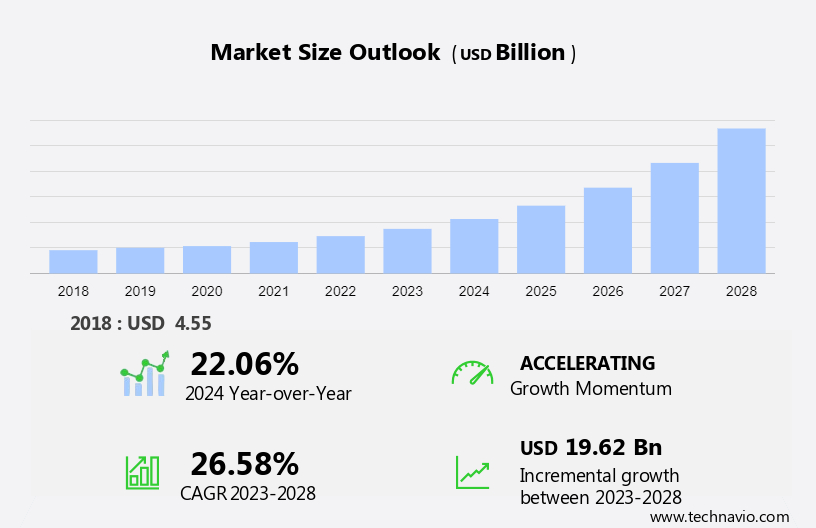
The smart connected cooking appliances market size is forecast to increase by USD 19.62 billion at a CAGR of 26.58% between 2023 and 2028.

  • The market is experiencing significant growth due to several key trends. Firstly, the rising innovation in product and technology is driving the market, as manufacturers continue to develop advanced features and functionalities to enhance the user experience. Secondly, the increasing adoption of modular kitchens, which allow for the integration of smart home technology, is also fueling market growth. However, the high price of smart connected cooking appliances remains a challenge for the market, limiting their accessibility to a wider consumer base. Despite this, the benefits of energy efficiency, convenience, and improved cooking performance are expected to continue driving demand for these appliances in the coming years.

What will the size of the market be during the forecast period?

Smart Connected Cooking Appliances Market Size

 Request Free Sample

  • The global market for smart kitchen appliances is experiencing significant growth due to several factors. The rise of single-person households and the increasing disposable income of tech-savvy homeowners have led to an increased demand for smart home appliances in the kitchen. Smart kitchen appliances, including refrigerators, blenders, smart coffee makers, and weighing scales, are becoming increasingly popular as they offer convenience, energy efficiency, and sustainability. Furthermore, the hospitality sector is also adopting smart technologies in kitchen appliances to improve efficiency and provide a better customer experience. The urban population, with a growing focus on healthy lifestyles, is also driving demand for smart appliances that can help prepare nutritious meals quickly and easily.
  • Design is another key factor driving the growth of the smart kitchen appliances market. Further, consumers are looking for appliances that not only offer advanced features but also fit seamlessly into their kitchen design. Traditional kitchen tools are being replaced by tiny, energy-efficient appliances that offer the same functionality but with a modern, tech-savvy twist. In conclusion, the market for smart kitchen appliances is expected to continue growing as more consumers embrace the convenience, energy efficiency, and sustainability benefits of these devices. Smart home language and connectivity, design, and energy efficiency are key trends driving the growth of this market.

How is this market segmented and which is the largest segment?

The market research report provides comprehensive data (region-wise segment analysis), with forecasts and estimates in "USD billion" for the period 2024-2028, as well as historical data from 2018-2022 for the following segments.

  • Distribution Channel
    • Offline
    • Online
  • End-user
    • Residential
    • Commercial
  • Geography
    • North America
      • US
    • Europe
      • Germany
      • UK
    • APAC
      • China
      • Japan
    • South America
    • Middle East and Africa

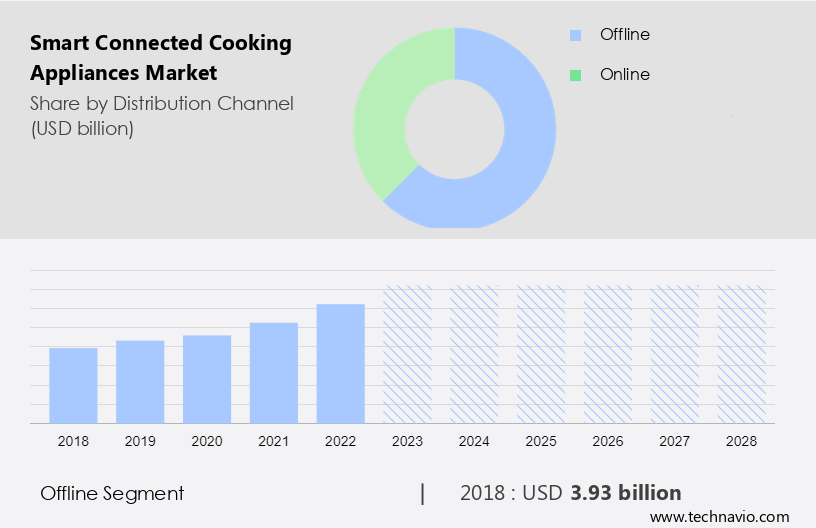
By Distribution Channel Insights

  • The offline segment is estimated to witness significant growth during the forecast period.

The market is experiencing significant growth due to the integration of advanced technologies such as Food tracking, Meal planning, Monitoring and control, and Environmental sustainability. Residential and Commercial sectors are increasingly adopting these energy-efficient and AI-enabled appliances, including Cooking equipment like Blenders, Coffee makers, Weighing scales, Tiny appliances, Refrigerators, Ovens, Dishwashers, and Cooktops. Rising costs and home improvement projects, including remodeling tasks in older homes and modern kitchens, are driving the demand for these appliances.

Furthermore, traditional household structures are evolving towards sustainability, with a focus on reducing Food wastage and Energy efficiency. companies are also collaborating with retailers and implementing marketing strategies to boost sales through both online and offline channels. These initiatives aim to cater to consumers' preferences for convenience and eco-friendly cooking solutions, from Appetizers to Desserts, Entrees, Cocktails, and Cooking shows on TV.

Smart Connected Cooking Appliances Market Size

Get a glance at the market report of share of various segments Request Free Sample

The offline segment was valued at USD 3.93 billion in 2018 and showed a gradual increase during the forecast period.
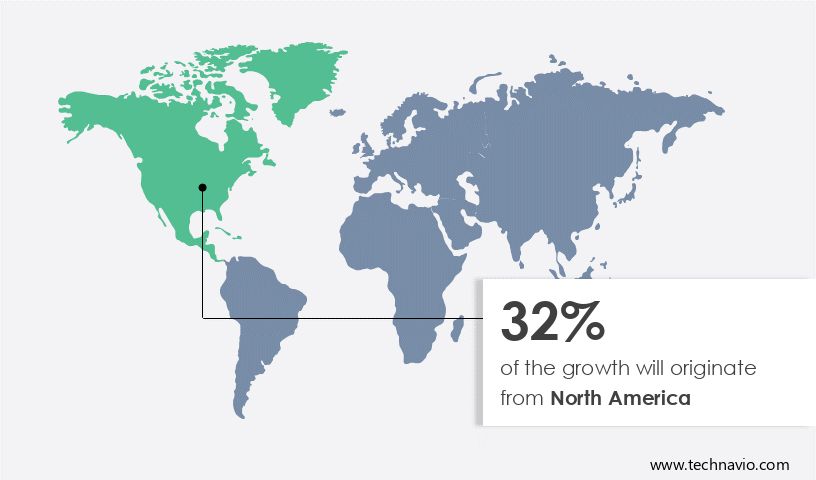
Regional Analysis

  • North America is estimated to contribute 32% to the growth of the global market during the forecast period.

Technavio's analysts have elaborately explained the regional trends and drivers that shape the market during the forecast period.

Smart Connected Cooking Appliances Market Share by Geography

For more insights on the market share of various regions Request Free Sample

The global market for smart connected cooking appliances experienced significant growth in 2023, with North America leading the way due to increasing consumer awareness and favorable infrastructure. Smart connected cooking appliances, including fridges, ovens, cooktops, dishwashers, blenders, coffee makers, and weighing scales, offer features such as food tracking, meal planning, monitoring, and control, reducing food wastage, and promoting environmental sustainability. In North America, the US and Canada are driving the market's growth, with modern kitchens in residential and commercial settings undergoing home improvement and remodeling projects. Additionally, traditional appliances are being replaced with energy-efficient, AI-enabled, and design-conscious smart connected cooking appliances. The trend is expected to continue, with rising costs and the popularity of green buildings further fueling the demand for these appliances during the forecast period. Cooking enthusiasts can now prepare appetizers, desserts, entrees, and cocktails with ease, while cooking shows and TV continue to inspire home cooking.

Market Dynamics

Our researchers analyzed the data with 2023 as the base year, along with the key drivers, trends, and challenges. A holistic analysis of drivers will help companies refine their marketing strategies to gain a competitive advantage.

What are the key market drivers leading to the rise in adoption of Smart Connected Cooking Appliances Market?

Rising innovation in product and technology is the key driver of the market.

  • In the contemporary market, health-conscious consumers are increasingly seeking advanced and smart kitchen products that minimize the use of preservatives and additives. Smart connected cooking appliances, such as cooktops, wall ovens, microwaves, ranges, and coffee makers, cater to this demand. The integration of multifunctionality, huge sizes, touchscreens, voice control, sensors, and anti-fingerprint coatings in these appliances appeals to both residential and commercial consumers, including restaurants, pubs, and hotels. These technologically advanced appliances offer convenience through connectivity to smartphones via Bluetooth or Wi-Fi, enabling users to access cooking tips, self-cleaning abilities, and reduced waste. companies prioritize innovation and technology to cater to the growing market trend, providing features like apps and voice control for an enhanced cooking experience.

What are the market trends shaping the Smart Connected Cooking Appliances Market?

Increasing adoption of modular kitchen is the upcoming trend in the market.

  • Health-conscious consumers are increasingly prioritizing preservative- and additive-free meals, leading to a surge in demand for smart connected cooking appliances. These advanced kitchen products offer multifunctionality, catering to various cooking requirements in huge commercial kitchens, such as restaurants, pubs, and hotels. Smart kitchen appliances, including touchscreens, voice control, sensors, and anti-fingerprint coatings, are becoming the norm.
  • Modular kitchen designs are gaining popularity due to their space-saving features and sleek appearances. companies are responding to this trend by introducing innovative smart oven models, apps, and cooking tips, enabling users to optimize their cooking experience. Self-cleaning abilities and reduced waste are additional features that add value to these appliances. The integration of smartphone connectivity further enhances their functionality, making them indispensable tools for modern, design- and tech-savvy consumers.

What challenges does Smart Connected Cooking Appliances Market face during the growth?

The high price of smart connected cooking appliances is a key challenge affecting the market growth.

  • Smart connected cooking appliances cater to health-conscious consumers who seek to minimize the use of preservatives and additives in their food. These advanced kitchen products offer multifunctionality, making them suitable for both residential and commercial kitchens, including restaurants, pubs, and hotels. Smart kitchen appliances come in huge sizes and feature touchscreens, voice control, sensors, and anti-fingerprint coatings for easy maintenance. Modular designs enable seamless integration into modern kitchens.
  • A smartphone app allows users to access cooking tips, monitor cooking progress, and even self-clean the appliance for reduced waste. Despite their advantages, the high cost, which is around 30% to 50% more than traditional appliances, remains a significant barrier for price-sensitive consumers. Manufacturers face challenges in marketing these innovative products and generating the expected revenue, which could potentially hinder the growth of the market.

Exclusive Customer Landscape

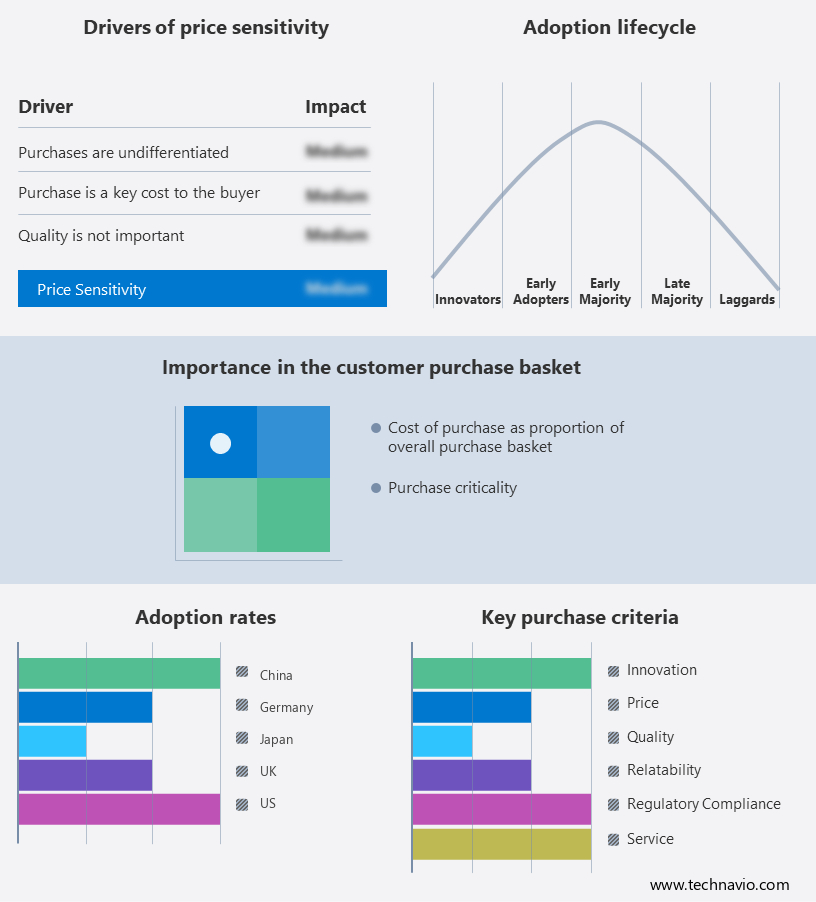
The market forecasting report includes the adoption lifecycle of the market, covering from the innovator's stage to the laggard's stage. It focuses on adoption rates in different regions based on penetration. Furthermore, the market report also includes key purchase criteria and drivers of price sensitivity to help companies evaluate and develop their market growth analysis strategies.

Smart Connected Cooking Appliances Market Share by Geography

 Customer Landscape

Key Companies & Market Insights

Companies are implementing various strategies, such as strategic alliances, market forecast , partnerships, mergers and acquisitions, geographical expansion, and product/service launches, to enhance their presence in the market. The market research and growth report includes detailed analyses of the competitive landscape of the market and information about key companies, including:

  • Behmor Inc.
  • Breville Pty Ltd
  • Daewoo Electricals
  • Electrolux Professional AB
  • Haier Smart Home Co. Ltd.
  • Hindware Home Innovation Ltd.
  • June Life Inc.
  • Koninklijke Philips N.V.
  • Legrand SA
  • LG Electronics Inc.
  • MIDEA Group Co. Ltd.
  • Miele and Cie. KG
  • Mitsubishi Electric Corp.
  • Newell Brands Inc.
  • Panasonic Holdings Corp.
  • Robert Bosch GmbH
  • Samsung Electronics Co. Ltd.
  • Sharp Corp.
  • Smarter Applications Ltd.
  • Whirlpool Corp.

Qualitative and quantitative analysis of companies has been conducted to help clients understand the wider business environment as well as the strengths and weaknesses of key market players. Data is qualitatively analyzed to categorize companies as pure play, category-focused, industry-focused, and diversified; it is quantitatively analyzed to categorize companies as dominant, leading, strong, tentative, and weak.

Research Analyst Overview

The smart kitchen appliances market is experiencing significant growth due to the rising disposable income of tech-savvy homeowners, particularly in single person households, and the increasing popularity of smart homes. Urban population, with their modern lifestyle and rigid work schedules, are increasingly turning to smart home language and technologies to make their kitchens more efficient and convenient. Smart kitchen appliances, such as smart refrigerators, ovens, and dishwashers, are becoming essential components of a connected home. These appliances are equipped with IoT, Bluetooth, and Wi-Fi capabilities, allowing users to control them using digital tools like smartphones and tablets. Smart refrigerators, with inner cameras and AI capabilities, help maintain a hygienic environment by preventing cross contamination and ensuring a nutrient-rich food supply.

Further, the Smart Connected Cooking Appliances market is growing rapidly, driven by tech-savvy homeowners and the increasing demand for smart cookware and cooktops. The integration of the Internet of Things (IoT) enables seamless control and automation of appliances, enhancing convenience and efficiency in the kitchen. E-commerce platforms are playing a key role in providing easy access to these innovative products, with many consumers investing in energy-efficient models that contribute to a healthier lifestyle. Fridges, as part of smart kitchens, offer advanced features like remote monitoring and temperature control. As expenditure on home renovations rises, many homeowners are replacing conventional appliances with smart options to reduce energy consumption and improve overall home functionality. This trend reflects a shift towards more connected, sustainable cooking solutions.

Market Scope

Report Coverage

Details

Page number

170

Base year

2023

Historic period

2018-2022

Forecast period

2024-2028

Growth momentum & CAGR

Accelerate at a CAGR of 26.58%

Market Growth 2024-2028

USD 19.62 billion

Market structure

Fragmented

YoY growth 2023-2024(%)

22.06

Key countries

US, China, Japan, Germany, and UK

Competitive landscape

Leading Companies, Market Positioning of Companies, Competitive Strategies, and Industry Risks

Request Free Sample

What are the Key Data Covered in this Market Research and Growth Report?

  • CAGR of the market during the forecast period
  • Detailed information on factors that will drive the market growth and forecasting between 2024 and 2028
  • Precise estimation of the size of the market  and its contribution of the market in focus to the parent market
  • Accurate predictions about upcoming market growth and trends and changes in consumer behaviour
  • Growth of the market across North America, Europe, APAC, South America, and Middle East and Africa
  • Thorough analysis of the market's competitive landscape and detailed information about companies
  • Comprehensive analysis of factors that will challenge the growth of market companies

We can help! Our analysts can customize this market research report to meet your requirements. Get in touch

1 Executive Summary

  • 1.1 Market overview
    • Exhibit 01: Executive Summary – Chart on Market Overview
    • Exhibit 02: Executive Summary – Data Table on Market Overview
    • Exhibit 03: Executive Summary – Chart on Global Market Characteristics
    • Exhibit 04: Executive Summary – Chart on Market by Geography
    • Exhibit 05: Executive Summary – Chart on Market Segmentation by Distribution Channel
    • Exhibit 06: Executive Summary – Chart on Market Segmentation by End-user
    • Exhibit 07: Executive Summary – Chart on Incremental Growth
    • Exhibit 08: Executive Summary – Data Table on Incremental Growth
    • Exhibit 09: Executive Summary – Chart on Vendor Market Positioning

2 Market Landscape

  • 2.1 Market ecosystem
    • Exhibit 10: Parent market
    • Exhibit 11: Market Characteristics

3 Market Sizing

  • 3.1 Market definition
    • Exhibit 12: Offerings of vendors included in the market definition
  • 3.2 Market segment analysis
    • Exhibit 13: Market segments
  • 3.3 Market size 2023
    • 3.4 Market outlook: Forecast for 2023-2028
      • Exhibit 14: Chart on Global - Market size and forecast 2023-2028 ($ billion)
      • Exhibit 15: Data Table on Global - Market size and forecast 2023-2028 ($ billion)
      • Exhibit 16: Chart on Global Market: Year-over-year growth 2023-2028 (%)
      • Exhibit 17: Data Table on Global Market: Year-over-year growth 2023-2028 (%)

    4 Historic Market Size

    • 4.1 Global smart connected cooking appliances market 2018 - 2022
      • Exhibit 18: Historic Market Size – Data Table on global smart connected cooking appliances market 2018 - 2022 ($ billion)
    • 4.2 Distribution Channel Segment Analysis 2018 - 2022
      • Exhibit 19: Historic Market Size – Distribution Channel Segment 2018 - 2022 ($ billion)
    • 4.3 End-user Segment Analysis 2018 - 2022
      • Exhibit 20: Historic Market Size – End-user Segment 2018 - 2022 ($ billion)
    • 4.4 Geography Segment Analysis 2018 - 2022
      • Exhibit 21: Historic Market Size – Geography Segment 2018 - 2022 ($ billion)
    • 4.5 Country Segment Analysis 2018 - 2022
      • Exhibit 22: Historic Market Size – Country Segment 2018 - 2022 ($ billion)

    5 Five Forces Analysis

    • 5.1 Five forces summary
      • Exhibit 23: Five forces analysis - Comparison between 2023 and 2028
    • 5.2 Bargaining power of buyers
      • Exhibit 24: Chart on Bargaining power of buyers – Impact of key factors 2023 and 2028
    • 5.3 Bargaining power of suppliers
      • Exhibit 25: Bargaining power of suppliers – Impact of key factors in 2023 and 2028
    • 5.4 Threat of new entrants
      • Exhibit 26: Threat of new entrants – Impact of key factors in 2023 and 2028
    • 5.5 Threat of substitutes
      • Exhibit 27: Threat of substitutes – Impact of key factors in 2023 and 2028
    • 5.6 Threat of rivalry
      • Exhibit 28: Threat of rivalry – Impact of key factors in 2023 and 2028
    • 5.7 Market condition
      • Exhibit 29: Chart on Market condition - Five forces 2023 and 2028

    6 Market Segmentation by Distribution Channel

    • 6.1 Market segments
      • Exhibit 30: Chart on Distribution Channel - Market share 2023-2028 (%)
      • Exhibit 31: Data Table on Distribution Channel - Market share 2023-2028 (%)
    • 6.2 Comparison by Distribution Channel
      • Exhibit 32: Chart on Comparison by Distribution Channel
      • Exhibit 33: Data Table on Comparison by Distribution Channel
    • 6.3 Offline - Market size and forecast 2023-2028
      • Exhibit 34: Chart on Offline - Market size and forecast 2023-2028 ($ billion)
      • Exhibit 35: Data Table on Offline - Market size and forecast 2023-2028 ($ billion)
      • Exhibit 36: Chart on Offline - Year-over-year growth 2023-2028 (%)
      • Exhibit 37: Data Table on Offline - Year-over-year growth 2023-2028 (%)
    • 6.4 Online - Market size and forecast 2023-2028
      • Exhibit 38: Chart on Online - Market size and forecast 2023-2028 ($ billion)
      • Exhibit 39: Data Table on Online - Market size and forecast 2023-2028 ($ billion)
      • Exhibit 40: Chart on Online - Year-over-year growth 2023-2028 (%)
      • Exhibit 41: Data Table on Online - Year-over-year growth 2023-2028 (%)
    • 6.5 Market opportunity by Distribution Channel
      • Exhibit 42: Market opportunity by Distribution Channel ($ billion)
      • Exhibit 43: Data Table on Market opportunity by Distribution Channel ($ billion)

    7 Market Segmentation by End-user

    • 7.1 Market segments
      • Exhibit 44: Chart on End-user - Market share 2023-2028 (%)
      • Exhibit 45: Data Table on End-user - Market share 2023-2028 (%)
    • 7.2 Comparison by End-user
      • Exhibit 46: Chart on Comparison by End-user
      • Exhibit 47: Data Table on Comparison by End-user
    • 7.3 Residential - Market size and forecast 2023-2028
      • Exhibit 48: Chart on Residential - Market size and forecast 2023-2028 ($ billion)
      • Exhibit 49: Data Table on Residential - Market size and forecast 2023-2028 ($ billion)
      • Exhibit 50: Chart on Residential - Year-over-year growth 2023-2028 (%)
      • Exhibit 51: Data Table on Residential - Year-over-year growth 2023-2028 (%)
    • 7.4 Commercial - Market size and forecast 2023-2028
      • Exhibit 52: Chart on Commercial - Market size and forecast 2023-2028 ($ billion)
      • Exhibit 53: Data Table on Commercial - Market size and forecast 2023-2028 ($ billion)
      • Exhibit 54: Chart on Commercial - Year-over-year growth 2023-2028 (%)
      • Exhibit 55: Data Table on Commercial - Year-over-year growth 2023-2028 (%)
    • 7.5 Market opportunity by End-user
      • Exhibit 56: Market opportunity by End-user ($ billion)
      • Exhibit 57: Data Table on Market opportunity by End-user ($ billion)

    8 Customer Landscape

    • 8.1 Customer landscape overview
      • Exhibit 58: Analysis of price sensitivity, lifecycle, customer purchase basket, adoption rates, and purchase criteria

    9 Geographic Landscape

    • 9.1 Geographic segmentation
      • Exhibit 59: Chart on Market share by geography 2023-2028 (%)
      • Exhibit 60: Data Table on Market share by geography 2023-2028 (%)
    • 9.2 Geographic comparison
      • Exhibit 61: Chart on Geographic comparison
      • Exhibit 62: Data Table on Geographic comparison
    • 9.3 North America - Market size and forecast 2023-2028
      • Exhibit 63: Chart on North America - Market size and forecast 2023-2028 ($ billion)
      • Exhibit 64: Data Table on North America - Market size and forecast 2023-2028 ($ billion)
      • Exhibit 65: Chart on North America - Year-over-year growth 2023-2028 (%)
      • Exhibit 66: Data Table on North America - Year-over-year growth 2023-2028 (%)
    • 9.4 Europe - Market size and forecast 2023-2028
      • Exhibit 67: Chart on Europe - Market size and forecast 2023-2028 ($ billion)
      • Exhibit 68: Data Table on Europe - Market size and forecast 2023-2028 ($ billion)
      • Exhibit 69: Chart on Europe - Year-over-year growth 2023-2028 (%)
      • Exhibit 70: Data Table on Europe - Year-over-year growth 2023-2028 (%)
    • 9.5 APAC - Market size and forecast 2023-2028
      • Exhibit 71: Chart on APAC - Market size and forecast 2023-2028 ($ billion)
      • Exhibit 72: Data Table on APAC - Market size and forecast 2023-2028 ($ billion)
      • Exhibit 73: Chart on APAC - Year-over-year growth 2023-2028 (%)
      • Exhibit 74: Data Table on APAC - Year-over-year growth 2023-2028 (%)
    • 9.6 South America - Market size and forecast 2023-2028
      • Exhibit 75: Chart on South America - Market size and forecast 2023-2028 ($ billion)
      • Exhibit 76: Data Table on South America - Market size and forecast 2023-2028 ($ billion)
      • Exhibit 77: Chart on South America - Year-over-year growth 2023-2028 (%)
      • Exhibit 78: Data Table on South America - Year-over-year growth 2023-2028 (%)
    • 9.7 Middle East and Africa - Market size and forecast 2023-2028
      • Exhibit 79: Chart on Middle East and Africa - Market size and forecast 2023-2028 ($ billion)
      • Exhibit 80: Data Table on Middle East and Africa - Market size and forecast 2023-2028 ($ billion)
      • Exhibit 81: Chart on Middle East and Africa - Year-over-year growth 2023-2028 (%)
      • Exhibit 82: Data Table on Middle East and Africa - Year-over-year growth 2023-2028 (%)
    • 9.8 US - Market size and forecast 2023-2028
      • Exhibit 83: Chart on US - Market size and forecast 2023-2028 ($ billion)
      • Exhibit 84: Data Table on US - Market size and forecast 2023-2028 ($ billion)
      • Exhibit 85: Chart on US - Year-over-year growth 2023-2028 (%)
      • Exhibit 86: Data Table on US - Year-over-year growth 2023-2028 (%)
    • 9.9 China - Market size and forecast 2023-2028
      • Exhibit 87: Chart on China - Market size and forecast 2023-2028 ($ billion)
      • Exhibit 88: Data Table on China - Market size and forecast 2023-2028 ($ billion)
      • Exhibit 89: Chart on China - Year-over-year growth 2023-2028 (%)
      • Exhibit 90: Data Table on China - Year-over-year growth 2023-2028 (%)
    • 9.10 Germany - Market size and forecast 2023-2028
      • Exhibit 91: Chart on Germany - Market size and forecast 2023-2028 ($ billion)
      • Exhibit 92: Data Table on Germany - Market size and forecast 2023-2028 ($ billion)
      • Exhibit 93: Chart on Germany - Year-over-year growth 2023-2028 (%)
      • Exhibit 94: Data Table on Germany - Year-over-year growth 2023-2028 (%)
    • 9.11 UK - Market size and forecast 2023-2028
      • Exhibit 95: Chart on UK - Market size and forecast 2023-2028 ($ billion)
      • Exhibit 96: Data Table on UK - Market size and forecast 2023-2028 ($ billion)
      • Exhibit 97: Chart on UK - Year-over-year growth 2023-2028 (%)
      • Exhibit 98: Data Table on UK - Year-over-year growth 2023-2028 (%)
    • 9.12 Japan - Market size and forecast 2023-2028
      • Exhibit 99: Chart on Japan - Market size and forecast 2023-2028 ($ billion)
      • Exhibit 100: Data Table on Japan - Market size and forecast 2023-2028 ($ billion)
      • Exhibit 101: Chart on Japan - Year-over-year growth 2023-2028 (%)
      • Exhibit 102: Data Table on Japan - Year-over-year growth 2023-2028 (%)
    • 9.13 Market opportunity by geography
      • Exhibit 103: Market opportunity by geography ($ billion)
      • Exhibit 104: Data Tables on Market opportunity by geography ($ billion)

    10 Drivers, Challenges, and Trends

    • 10.1 Market drivers
      • 10.2 Market challenges
        • 10.3 Impact of drivers and challenges
          • Exhibit 105: Impact of drivers and challenges in 2023 and 2028
        • 10.4 Market trends

          11 Vendor Landscape

          • 11.1 Overview
            • 11.2 Vendor landscape
              • Exhibit 106: Overview on Criticality of inputs and Factors of differentiation
            • 11.3 Landscape disruption
              • Exhibit 107: Overview on factors of disruption
            • 11.4 Industry risks
              • Exhibit 108: Impact of key risks on business

            12 Vendor Analysis

            • 12.1 Vendors covered
              • Exhibit 109: Vendors covered
            • 12.2 Market positioning of vendors
              • Exhibit 110: Matrix on vendor position and classification
            • 12.3 Breville Pty Ltd
              • Exhibit 111: Breville Pty Ltd - Overview
              • Exhibit 112: Breville Pty Ltd - Product / Service
              • Exhibit 113: Breville Pty Ltd - Key offerings
            • 12.4 Electrolux Professional AB
              • Exhibit 114: Electrolux Professional AB - Overview
              • Exhibit 115: Electrolux Professional AB - Business segments
              • Exhibit 116: Electrolux Professional AB - Key news
              • Exhibit 117: Electrolux Professional AB - Key offerings
              • Exhibit 118: Electrolux Professional AB - Segment focus
            • 12.5 Haier Smart Home Co. Ltd.
              • Exhibit 119: Haier Smart Home Co. Ltd. - Overview
              • Exhibit 120: Haier Smart Home Co. Ltd. - Business segments
              • Exhibit 121: Haier Smart Home Co. Ltd. - Key offerings
              • Exhibit 122: Haier Smart Home Co. Ltd. - Segment focus
            • 12.6 June Life Inc.
              • Exhibit 123: June Life Inc. - Overview
              • Exhibit 124: June Life Inc. - Product / Service
              • Exhibit 125: June Life Inc. - Key offerings
            • 12.7 Koninklijke Philips N.V.
              • Exhibit 126: Koninklijke Philips N.V. - Overview
              • Exhibit 127: Koninklijke Philips N.V. - Business segments
              • Exhibit 128: Koninklijke Philips N.V. - Key news
              • Exhibit 129: Koninklijke Philips N.V. - Key offerings
              • Exhibit 130: Koninklijke Philips N.V. - Segment focus
            • 12.8 Legrand SA
              • Exhibit 131: Legrand SA - Overview
              • Exhibit 132: Legrand SA - Business segments
              • Exhibit 133: Legrand SA - Key offerings
              • Exhibit 134: Legrand SA - Segment focus
            • 12.9 LG Electronics Inc.
              • Exhibit 135: LG Electronics Inc. - Overview
              • Exhibit 136: LG Electronics Inc. - Product / Service
              • Exhibit 137: LG Electronics Inc. - Key offerings
            • 12.10 MIDEA Group Co. Ltd.
              • Exhibit 138: MIDEA Group Co. Ltd. - Overview
              • Exhibit 139: MIDEA Group Co. Ltd. - Product / Service
              • Exhibit 140: MIDEA Group Co. Ltd. - Key offerings
            • 12.11 Miele and Cie. KG
              • Exhibit 141: Miele and Cie. KG - Overview
              • Exhibit 142: Miele and Cie. KG - Product / Service
              • Exhibit 143: Miele and Cie. KG - Key offerings
            • 12.12 Newell Brands Inc.
              • Exhibit 144: Newell Brands Inc. - Overview
              • Exhibit 145: Newell Brands Inc. - Business segments
              • Exhibit 146: Newell Brands Inc. - Key news
              • Exhibit 147: Newell Brands Inc. - Key offerings
              • Exhibit 148: Newell Brands Inc. - Segment focus
            • 12.13 Panasonic Holdings Corp.
              • Exhibit 149: Panasonic Holdings Corp. - Overview
              • Exhibit 150: Panasonic Holdings Corp. - Business segments
              • Exhibit 151: Panasonic Holdings Corp. - Key news
              • Exhibit 152: Panasonic Holdings Corp. - Key offerings
              • Exhibit 153: Panasonic Holdings Corp. - Segment focus
            • 12.14 Robert Bosch GmbH
              • Exhibit 154: Robert Bosch GmbH - Overview
              • Exhibit 155: Robert Bosch GmbH - Business segments
              • Exhibit 156: Robert Bosch GmbH - Key news
              • Exhibit 157: Robert Bosch GmbH - Key offerings
              • Exhibit 158: Robert Bosch GmbH - Segment focus
            • 12.15 Samsung Electronics Co. Ltd.
              • Exhibit 159: Samsung Electronics Co. Ltd. - Overview
              • Exhibit 160: Samsung Electronics Co. Ltd. - Business segments
              • Exhibit 161: Samsung Electronics Co. Ltd. - Key news
              • Exhibit 162: Samsung Electronics Co. Ltd. - Key offerings
              • Exhibit 163: Samsung Electronics Co. Ltd. - Segment focus
            • 12.16 Sharp Corp.
              • Exhibit 164: Sharp Corp. - Overview
              • Exhibit 165: Sharp Corp. - Business segments
              • Exhibit 166: Sharp Corp. - Key news
              • Exhibit 167: Sharp Corp. - Key offerings
              • Exhibit 168: Sharp Corp. - Segment focus
            • 12.17 Whirlpool Corp.
              • Exhibit 169: Whirlpool Corp. - Overview
              • Exhibit 170: Whirlpool Corp. - Business segments
              • Exhibit 171: Whirlpool Corp. - Key offerings
              • Exhibit 172: Whirlpool Corp. - Segment focus

            13 Appendix

            • 13.1 Scope of the report
              • 13.2 Inclusions and exclusions checklist
                • Exhibit 173: Inclusions checklist
                • Exhibit 174: Exclusions checklist
              • 13.3 Currency conversion rates for US$
                • Exhibit 175: Currency conversion rates for US$
              • 13.4 Research methodology
                • Exhibit 176: Research methodology
                • Exhibit 177: Validation techniques employed for market sizing
                • Exhibit 178: Information sources
              • 13.5 List of abbreviations
                • Exhibit 179: List of abbreviations

              Research Methodology

              Technavio presents a detailed picture of the market by way of study, synthesis, and summation of data from multiple sources. The analysts have presented the various facets of the market with a particular focus on identifying the key industry influencers. The data thus presented is comprehensive, reliable, and the result of extensive research, both primary and secondary.

              INFORMATION SOURCES

              Primary sources

              • Manufacturers and suppliers
              • Channel partners
              • Industry experts
              • Strategic decision makers

              Secondary sources

              • Industry journals and periodicals
              • Government data
              • Financial reports of key industry players
              • Historical data
              • Press releases

              DATA ANALYSIS

              Data Synthesis

              • Collation of data
              • Estimation of key figures
              • Analysis of derived insights

              Data Validation

              • Triangulation with data models
              • Reference against proprietary databases
              • Corroboration with industry experts

              REPORT WRITING

              Qualitative

              • Market drivers
              • Market challenges
              • Market trends
              • Five forces analysis

              Quantitative

              • Market size and forecast
              • Market segmentation
              • Geographical insights
              • Competitive landscape

              Interested in this report?

              Get your sample now to see our research methodology and insights!

              Download Now

              Frequently Asked Questions

              Smart Connected Cooking Appliances market growth will increase by $ 19.62 bn during 2024-2028.

              The Smart Connected Cooking Appliances market is expected to grow at a CAGR of 26.58% during 2024-2028.

              Smart Connected Cooking Appliances market is segmented by Distribution Channel( Offline, Online) End-user( Residential, Commercial, APAC, South America, Middle East and Africa)

              Behmor Inc., Breville Pty Ltd, Daewoo Electricals, Electrolux Professional AB, Haier Smart Home Co. Ltd., Hindware Home Innovation Ltd., June Life Inc., Koninklijke Philips N.V., Legrand SA, LG Electronics Inc., MIDEA Group Co. Ltd., Miele and Cie. KG, Mitsubishi Electric Corp., Newell Brands Inc., Panasonic Holdings Corp., Robert Bosch GmbH, Samsung Electronics Co. Ltd., Sharp Corp., Smarter Applications Ltd., Whirlpool Corp. are a few of the key vendors in the Smart Connected Cooking Appliances market.

              North America will register the highest growth rate of 32% among the other regions. Therefore, the Smart Connected Cooking Appliances market in North America is expected to garner significant business opportunities for the vendors during the forecast period.

              US, China, Japan, Germany, UK

              • Rising innovation in product and technologyIn the global smart connected cooking appliances market is the driving factor this market.
              • the products usually fall into the premium category. This is attributed to the innovation and technology implemented in cooking appliances. Different varieties of cooking appliances are offered with smart connectivity technology. Such products include cooktops is the driving factor this market.
              • wall ovens is the driving factor this market.
              • microwaves is the driving factor this market.
              • ranges is the driving factor this market.
              • and coffee makers. The rising living standards of people and increasing expenditure on technology and connected devices propel the demand for smart and advanced appliances. Smart connected products provide convenience to customers while cooking. All cooking appliances can be easily accessed through users' smartphones by using either Bluetooth or Wi-Fi connectivity. Vendors are focusing on providing technologically advanced appliances for the easy access and convenience of customers. With the use of advanced technology is the driving factor this market.
              • vendors can extend their product lines and develop premium products. Such innovative features will drive the global smart connected cooking appliances market during the forecast period. is the driving factor this market.

              The Smart Connected Cooking Appliances market vendors should focus on grabbing business opportunities from the Offline segment as it accounted for the largest market share in the base year.
              RIA - Research AI Assistant
              Ask RIA